. 2023 Sep 22;8(18):e164816.
doi: 10.1172/jci.insight.164816.

MicroRNA-1 protects the endothelium in acute lung injury

Affiliations

MicroRNA-1 protects the endothelium in acute lung injury

Asawari Korde et al. JCI Insight. .

Abstract

Acute lung injury (ALI) and its most severe form, acute respiratory distress syndrome (ARDS), cause severe endothelial dysfunction in the lung, and vascular endothelial growth factor (VEGF) is elevated in ARDS. We found that the levels of a VEGF-regulated microRNA, microRNA-1 (miR-1), were reduced in the lung endothelium after acute injury. Pulmonary endothelial cell-specific (EC-specific) overexpression of miR-1 protected the lung against cell death and barrier dysfunction in both murine and human models and increased the survival of mice after pneumonia-induced ALI. miR-1 had an intrinsic protective effect in pulmonary and other types of ECs; it inhibited apoptosis and necroptosis pathways and decreased capillary leak by protecting adherens and tight junctions. Comparative gene expression analysis and RISC recruitment assays identified miR-1 targets in the context of injury, including phosphodiesterase 5A (PDE5A), angiopoietin-2 (ANGPT2), CNKSR family member 3 (CNKSR3), and TNF-α-induced protein 2 (TNFAIP2). We validated miR-1-mediated regulation of ANGPT2 in both mouse and human ECs and found that in a 119-patient pneumonia cohort, miR-1 correlated inversely with ANGPT2. These findings illustrate a previously unknown role of miR-1 as a cytoprotective orchestrator of endothelial responses to acute injury with prognostic and therapeutic potential.

Keywords: Endothelial cells; Noncoding RNAs; Pulmonology; Vascular Biology.


Conflict of interest statement

Conflict of interest: The authors have declared that no conflict of interest exists.

Figures

Figure 1
Figure 1. Lung injury downregulates miR-1.
Mouse or human lung tissue were exposed to injury. Lung RNA was extracted and miR-1/18S levels were measured by qRT-PCR, analyzed by comparative Ct method, normalized to the control (PBS), and expressed as 2–ΔΔCt. (A) LPS model (n = 3). *P = 0.038. (B) Hyperoxia (HO) model (n = 10 in room air [RA] and 13 in HO). *P = 0.0201. (C) E. coli model (n ≥ 5). *P = 0.0062. (D) Human lung ex vivo culture: Human lung was exposed to various concentrations of LPS for 24 hours (n = 4 patients, 5 replicates each). *P = 0.0028, **P = 0.000025. (E) Ex vivo human lung perfusion: Human lungs were perfused with LPS (5 μg/kg ideal body weight of the donor) or PBS (control group) and biopsy samples were collected 6 hours after the initiation of perfusion (n = 3 donors). *P = 0.0478. Error bars represent the SEM. Data were analyzed by unpaired, 2-tailed t test with Welch’s correction or Mann-Whitney U test based on normality.
Figure 2
Figure 2. Lung injury downregulates miR-1 in endothelial cells.
(A) Human ex vivo–cultured lungs were treated with LPS (500 ng/mL) or vehicle (PBS) for 24 hours. Endothelial (CD45CD31+) and immune (CD45+) cells were isolated and miR-1 levels measured as described in Figure 1 (n = 3 patients). *P = 0.008. (B) Lung endothelial miR-1 in hyperoxia (HO) model; RA, room air (n ≥ 3). *P = 0.004. (C) Lung endothelial miR-1 in the E. coli model (n = 3 PBS, 4 for E. coli). *P = 0.0325. (DF) Endothelial cells were treated with increasing concentrations of LPS for 24 hours and miR-1 levels were measured and expressed as described in A. (D) MLECs (n ≥ 4, from 2 experiments). *P = 0.0339, **P = 0.0019, ***P = 0.0097. (E) HPMECs (n ≥ 8 from 3 experiments). *P = 0.02, **P < 0.0001. (F) HUVECs (n = 6). *P = 0.02, **P = 0.008. (G) HDMECs (n = 12, from 2 experiments). *P = 0.0005, **P = 0.0001. (H) HPMECs were treated with increasing concentrations of TNF-α for 24 hours and mature miR-1 levels were measured, analyzed, and expressed as in A (n = 3). *P < 0.05. Error bars represent the SEM. Data were analyzed by unpaired, 2-tailed t test with Welch’s correction or Mann-Whitney U test based on normality.
Figure 3
Figure 3. The mechanism of miR-1 downregulation in lung injury.
(A) HPMECs were treated with increasing concentrations of TNF-α for 24 hours. VEGF/18S mRNA levels were measured by qRT-PCR, analyzed by the comparative Ct method, and normalized values expressed as 2–ΔΔCt (n > 3, from 2 experiments). *P = 0.04. (B) HPMECs were incubated with VEGFR2 blocker (SU5614) for 2 hours followed by TNF-α treatment for 24 hours. miR-1/18S levels were measured and expressed as in Figure 2A (n = 6). *P < 0.022. (C) HPMECs were incubated with various inhibitors followed by TNF-α treatment. miR-1/18S levels were measured and expressed as in Figure 2A (n > 5). *P = 0.006, **P = 0.003. (DF) HPMECs were treated with increasing concentrations of TNF-α for 24 hours. The levels of pre- and pri-miR-1/18s transcripts were measured by qRT-PCR, analyzed by comparative Ct method, and normalized values expressed as 2–ΔΔCt. (D) pri-miR-1 (n = 3), (E) pre-miR-1-1 (n = 3, **P = 0.006), and (F) pre-miR-1-2 (n = 3). Error bars represent the SEM. Data were analyzed by unpaired, 2-tailed t test with Welch’s correction or Mann-Whitney U test based on normality. ERK, extracellular signal–regulated kinase; P38K, p38 mitogen–activated protein kinase; JNK, c-jun N-terminal kinase; PI3K, phosphoinositide 3-kinase; VEGFR2, vascular endothelial growth factor receptor 2; Pri-, primary miR-1; Pre, precursor miR-1 transcript.
Figure 4
Figure 4. Endothelial miR-1 protects murine lung from injury.
(A) Mice received a double-stranded miR-1 RNA mimic (miR-1) or control RNA (ctrl) intranasally, followed by intranasal LPS (4 mg/kg). TUNEL assay was performed on the lung tissues and percentage TUNEL-positive/total (DAPI-positive) cells was calculated and graphed. Images were acquired at ×200 magnification (n > 4 for PBS groups, n = 5 for LPS groups). *P = 0.0159. (BF) Mice received endothelial cell–specific lentiviral vector V-miR-1 or control (V-ctrl) and were infected with E. coli through the intranasal route. Lungs were harvested 24 hours after infection and processed for various indices. (B) Percentage TUNEL-positive cells was determined and graphed as in A (n = 3 for PBS, 7 for E. coli). *P = 0.00004, **P = 0.00027, ***P = 0.00566, ****P = 0.00025. (C) LDH was measured in the BAL collected from murine lungs (n = 3 PBS and n = 7 E. coli). *P = 0.005364, **P = 0.011498, ***P = 0.018881. (D) Total protein in BAL was measured using BCA assay (n = 3 for PBS and 7 for E. coli). *P = 0.00000631, **P = 0.0000677, ***P = 0.0000745. (E) Lung water was measured and expressed as relative weight change ([wet – dry]/wet weight, n = 5). *P = 0.000502. (F) Kaplan-Meier curves for the survival of mice. Difference between the groups was analyzed using log-rank (Mantel-Cox) test (n = 17 per group, from 2 experiments). *P = 0.033. (G) miR-1–transgenic (miR-1 TG) and WT mice were exposed to LPS (4 mg/kg) or control and percentage TUNEL-positive cells was determined as in A (n ≥ 4). *P = 0.015, **P = 0.0079. Scale bars: 100 μm. Error bars represent the SEM. Data were analyzed by unpaired, 2-tailed t test with Welch’s correction or Mann-Whitney U test based on normality.
Figure 5
Figure 5. miR-1 protects human lungs against cell death.
Human lung tissue samples were cultured and transfected with a double-stranded miR-1 RNA mimic (miR-1) or control RNA (ctrl), followed by 24-hour treatment with LPS (500 ng/mL) or vehicle (PBS). (A) Percentage TUNEL-positive cells was measured and graphed as in Figure 4A (n = 3 patients, 6 replicates each). *P = 0.0016, **P = 0.0225, ***P = 0.0014, ****P = 0.0058. Scale bars: 100 μm. (B) LDH levels were measured in culture media, and the values were normalized to the mean of the PBS group (n = 3 patients, 2 replicates each). *P = 0.0067, **P = 0.0052, ***P = 0.0011, ****P = 0.0043. (C and D) PCLS samples from the human lung were cultured in the growth medium, transduced with V-miR-1 or V-Ctrl, and treated with LPS (500 ng/mL) for 24 hours. Paraffin-embedded sections were stained for TUNEL, von Willebrand factor (VWF, for endothelial cells), and epithelial cell adhesion molecule (EpCAM, for epithelial cells). (C) Representative confocal images (×200 magnification) of alveoli. The graph represents the quantification of percentage TUNEL-positive cells/length of the alveolar wall (n = 5 replicates for V-ctrl and 4 for V-miR-1). *P = 0.0004. (D) Representative images of small lung vessels. The graph represents percentage TUNEL-positive cells/perimeter of the vessel (n = 6 replicates per group). Scale bars: 50 μm (C and D). *P = 0.0002. Error bars represent the SEM. Data were analyzed by unpaired, 2-tailed t test with Welch’s correction or Mann-Whitney U test based on normality.
Figure 6
Figure 6. miR-1 reduces endothelial cell permeability.
HPMECs were transfected with miR-1 or control RNA (Ctrl) and treated with TNF-α (10 ng/mL) or vehicle (PBS). (A) The permeability (transendothelial electric resistances, TEER) of the endothelial monolayers was measured at the given time points and plotted after normalization to the baseline values (n = 24, from 2 experiments). *P = 0.0001 at 6 hours. (B and C) Cells were stained for VE-cadherin (red) or zonula occludens-1 (ZO-1, green) and with DAPI (nuclei in blue). Images were collected from randomly selected fields and percentage confluently stained/total stained cell circumference was quantified by fluorescence microscopy. Values were normalized to the control/PBS group. (B) Representative images (left panel) and graphs (right panel) for VE-cadherin. (C) Representative images (left panel) and graphs (right panel) for ZO-1 (n ≥ 5 per group). Scale bars: 25 μm. *P < 0.01, **P < 0.001, ***P < 0.0001. Error bars represent the SEM. Data were analyzed by unpaired, 2-tailed t test with Welch’s correction or Mann-Whitney U test based on normality.
Figure 7
Figure 7. miR-1 protects endothelium from cell death.
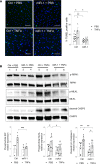
HPMECs were transfected with miR-1 or control (Ctrl) RNA and treated with TNF-α (10 ng/mL) or vehicle (PBS) for 24 hours. (A) Percentage TUNEL-positive cells was measured and graphed as in Figure 4A. Images were acquired under ×40 magnification (n ≥ 7 per group). Scale bars: 50 μm. *P = 0.0063, **P = 0.022. (B) Phosphorylated and total RIPK1 and MLKL proteins and cleaved and total caspase 3 (CASP3) were detected by Western blotting. The panel on the left shows representative immunoblots and the panel on the right shows quantification for each group normalized to the control/PBS group (n ≥ 3 for RIPK1 and n ≥ 9 for MLKL and CASP3). *P < 0.05, **P < 0.01, ***P < 0.005. Error bars represent the SEM. Data were analyzed by unpaired, 2-tailed t test with Welch’s correction or Mann-Whitney U test based on normality. RIPK1, receptor-interacting protein kinase 1; MLKL, mixed-lineage kinase domain–like pseudokinase.
Figure 8
Figure 8. miR-1 targets in the injured endothelium.
(A) Schematic representation of our strategy for selecting the candidate genes. Circles represent the genes that were selected based on the criteria in each group. (B) Heatmap shows the RISC-recruited genes (circle 3 in A). Arrows show the genes from the list that were known to be involved in ALI or cell death. (C) Validation of RISC recruitment for the selected genes (marked by arrows in B). HUVECs were transduced with V-miR-1 or control (V-ctrl) and their lysates were used in an Ago pull-down assay. Expression levels for the selected genes were measured by qRT-PCR in the Ago-immunoprecipitated fraction and normalized to their expression levels in the whole lysate. The values for V-miR-1–transduced cells /V-ctrl–transduced cells are expressed as relative RISC recruitment (n = 4, from 2 experiments). *P < 0.05. (DG) HUVECs were transfected with miR-1 or control RNA (Ctrl) and treated with TNF-α (10 ng/mL) or vehicle (PBS) and levels of each mRNA/18S in the lysates were measured and expressed as in Figure 3A. Graphs show the levels for (D) phosphodiesterase 5A (PDE5A), (E) connector enhancer of kinase suppressor of Ras (CNKSR3), (F) angiopoietin-2 (ANGPT2), and (G) TNF-α–induced protein 2 (TNFAIP) (n = 6 per group in each, from 2 experiments). *P < 0.05. Error bars represent the SEM. Data were analyzed by unpaired, 2-tailed t test with Welch’s correction or Mann-Whitney U test based on normality.
Figure 9
Figure 9. miR-1/ANGPT2 axis.
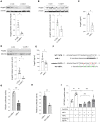
(A and B) Endothelial cells were transduced with V-miR-1 or V-ctrl. Cell lysates were collected after 48 hours and ANGPT2 protein levels were measured by Western blotting. The top panels show a representative Western blot and the bottom panels show quantification based on band density values, normalized to β-actin for (A) HUVECs (n = 3, *P = 0.044) and (B) MLECs (n = 3, *P = 0.05). (C) HUVECs were transfected with miR-1 or control RNA (Ctrl) and grown in starvation media (containing 2% FBS) for 16 hours. ANGPT2 levels in the media were measured by ELISA (n = 3 per group). *P = 0.0252. (D) Mice received V-miR-1 or V-ctrl intranasally. BAL was collected after 2 weeks and analyzed for ANGPT2 and albumin content by Western blotting assay. The top panel shows the Western blot and the bottom panel shows band density values normalized to albumin (n = 5 for V-ctrl and 4 for V-miR-1). *P = 0.037. (E) Human lung tissue samples were cultured and transfected with a double-stranded miR-1 RNA mimic (miR-1) or control RNA (ctrl). Culture media were collected after 24 hours and ANGPT2 levels were measured by ELISA (n = 4 patients, 2 replicates each). *P = 0.0011. (F) The sequence of the miR-1 binding sites in Angpt2 luciferase vectors: Green letters indicate mutations in the scrambled (Scr)–miR-1, and red letters indicate compensatory mutations in the Angpt2 3′UTR. (G and H) 293T cells were cotransfected with miR-1 or scr-miR-1 RNA and the luciferase vector containing (G) Angpt2 WT 3′UTR or (H) Angpt2 mutated 3′UTR. Relative firefly/Renilla luciferase activities were normalized to the mean of the control groups (2 experiments, n = 4). **P = 0.002, ***P = 0.0007. (I) HPMECs were transfected with miR-1 (or control RNA) and treated with TNF-α (10 ng/mL) in the presence of increasing concentrations of recombinant ANGPT2 and harvested after 24 hours. Cell death was measured and expressed as percentage TUNEL-positive cells, as described in Figure 4A (n > 4, from 2 experiments). *P = 0.01, **P < 0.0004, ***P < 0.0005). Error bars represent the SEM. Data were analyzed by unpaired, 2-tailed t test with Welch’s correction or Mann-Whitney U test based on normality.
Figure 10
Figure 10. Clinical associations of miR-1 in pneumonia patients.
(A and B) Serum samples were collected from hospitalized patients with bacterial pneumonia. ANGPT2 protein levels were measured by ELISA and serum miR-1/18S RNA levels were measured and expressed as in Figure 1 after normalizing to the median. (A) miR-1–ANGPT2 association in the whole clinical cohort (n = 119). Pearson’s r = –0.2088, P = 0.0227. (B) miR-1 levels in high-ANGPT2 (>2 ng/mL) and low-ANGPT2 (<2 ng/mL) patients (n = 119: 64 high- and 55 low-ANGPT2 patients). *P = 0.0462 by Mann-Whitney U test. (C) Association between miR-1 levels and the length of stay in the hospital in days (n = 99). Spearman’s r = –0.2114, P = 0.0357. (D and E) miR-1 levels in the patients admitted to the intensive care unit (D) with high (>2) or low (<2) modified sequential organ failure assessment (mSOFA) scores (n = 67, *P = 0.0433 by unpaired, 2-tailed t test with Welch’s correction) and (E) who had died or survived at 30 days after admission (n = 56, *P = 0.0450 by Mann-Whitney U test). Patients with do not intubate (DNI) and do not resuscitate (DNR) orders were excluded from this analysis. Error bars represent the SEM.

References

    1. Huppert LA, et al. Pathogenesis of acute respiratory distress syndrome. Semin Respir Crit Care Med. 2019;40(1):31–39. doi: 10.1055/s-0039-1683996. - DOI - PMC - PubMed
    1. Bachofen M, Weibel E. Structural alterations of lung parenchyma in the adult respiratory distress syndrome. Clin Chest Med. 1982;3(1):35–56. doi: 10.1016/S0272-5231(21)00143-X. - DOI - PubMed
    1. Millar FR, et al. The pulmonary endothelium in acute respiratory distress syndrome: insights and therapeutic opportunities. Thorax. 2016;71(5):462–473. doi: 10.1136/thoraxjnl-2015-207461. - DOI - PubMed
    1. Takyar S, et al. An endothelial TLR4-VEGFR2 pathway mediates lung protection against oxidant-induced injury. FASEB J. 2016;30(3):1317–1327. doi: 10.1096/fj.15-275024. - DOI - PMC - PubMed
    1. Ferrara N, et al. The biology of VEGF and its receptors. Nat Med. 2003;9(6):669–676. doi: 10.1038/nm0603-669. - DOI - PubMed

Publication types