. 2023 Sep 22;14(1):5904.
doi: 10.1038/s41467-023-41492-3.

A branching model of lineage differentiation underpinning the neurogenic potential of enteric glia

Affiliations

A branching model of lineage differentiation underpinning the neurogenic potential of enteric glia

Anna Laddach et al. Nat Commun. .

Abstract

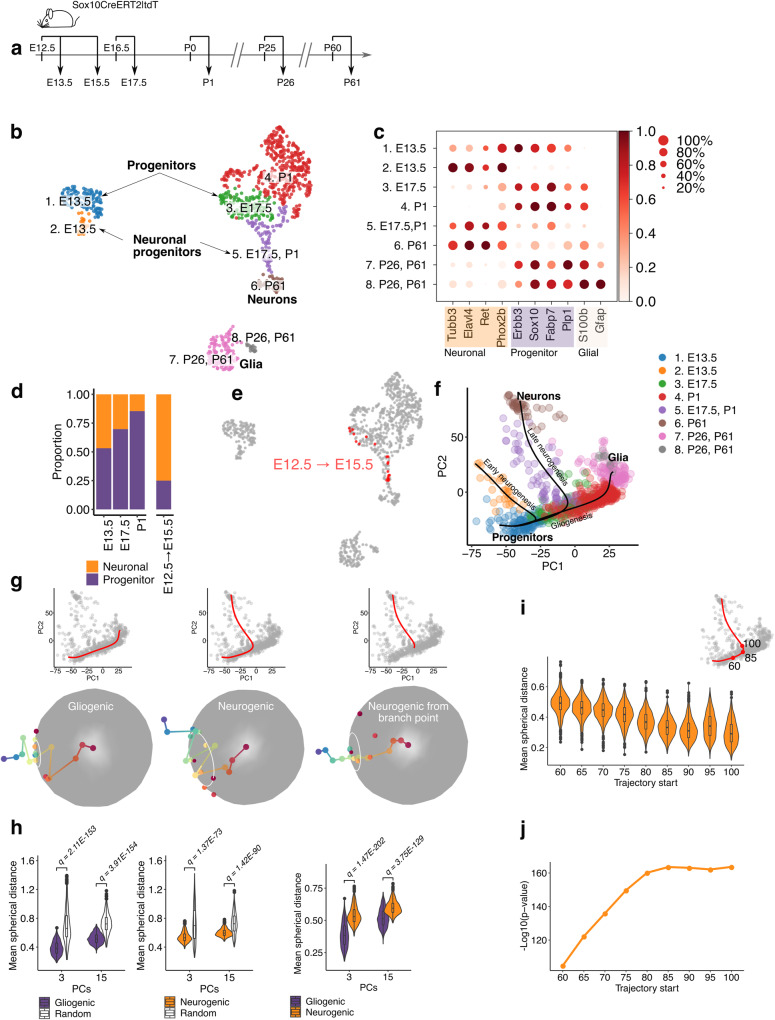
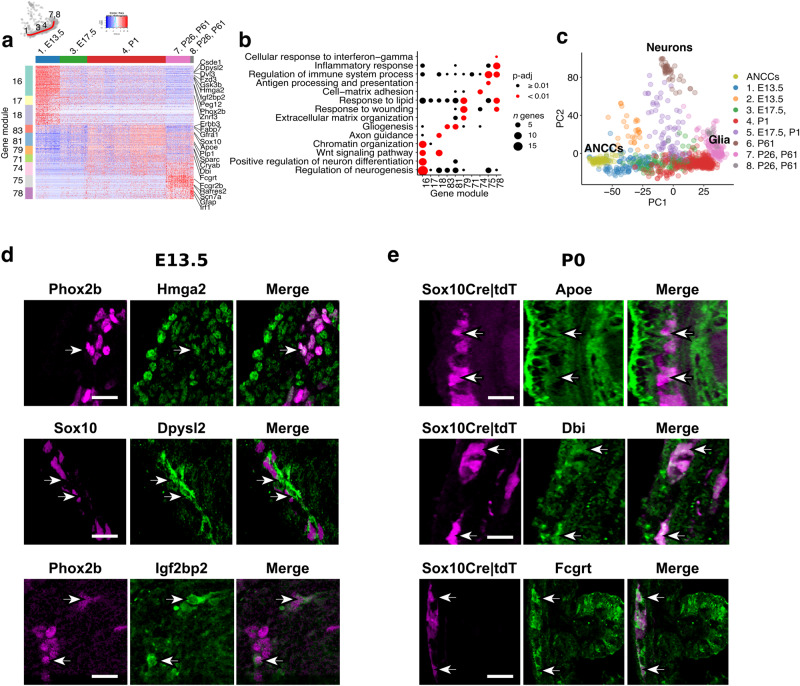
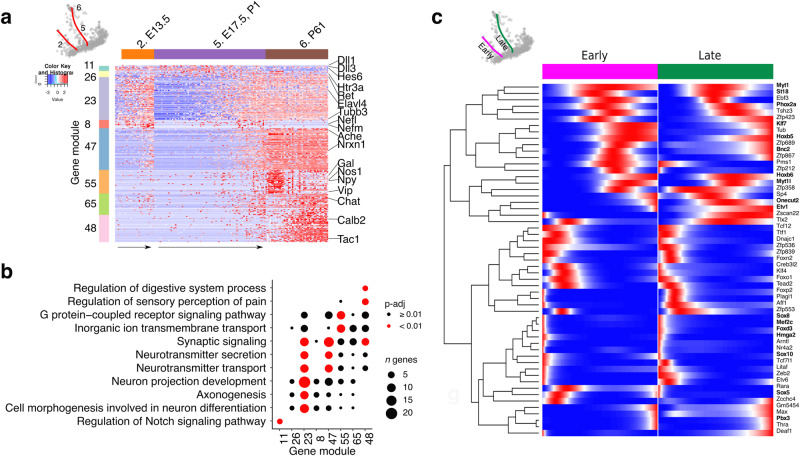
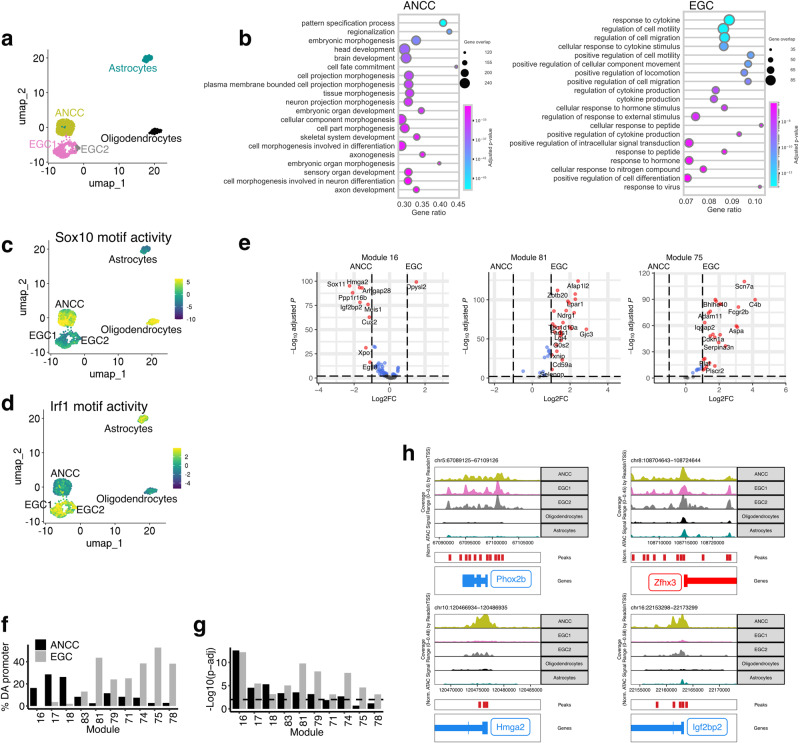
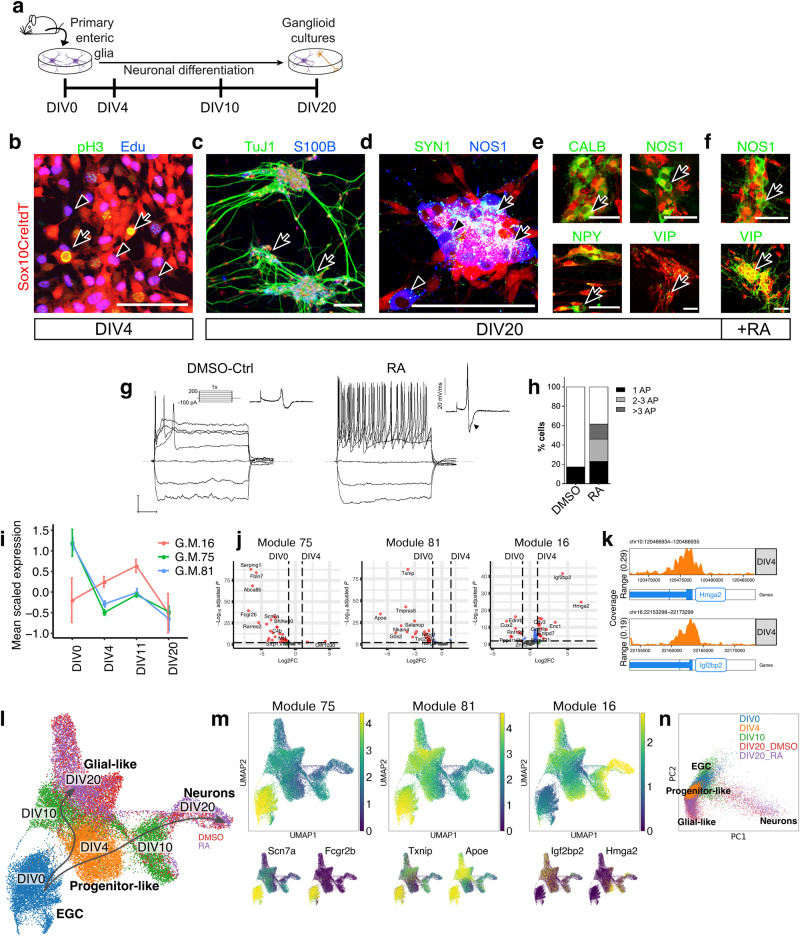
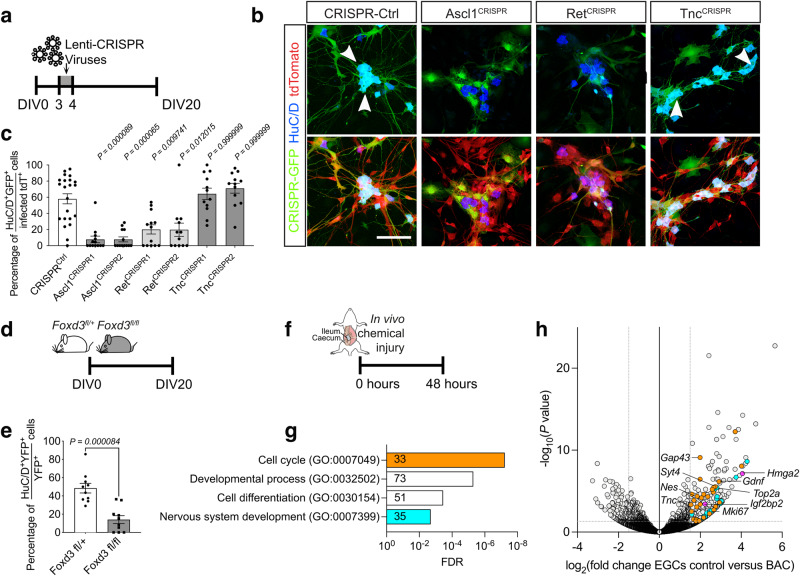
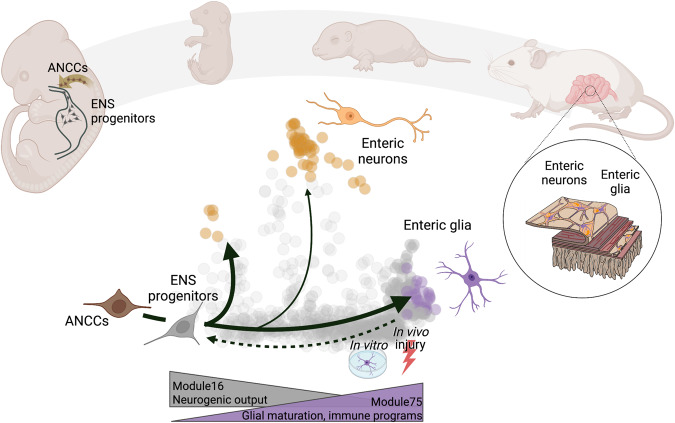
Glial cells have been proposed as a source of neural progenitors, but the mechanisms underpinning the neurogenic potential of adult glia are not known. Using single cell transcriptomic profiling, we show that enteric glial cells represent a cell state attained by autonomic neural crest cells as they transition along a linear differentiation trajectory that allows them to retain neurogenic potential while acquiring mature glial functions. Key neurogenic loci in early enteric nervous system progenitors remain in open chromatin configuration in mature enteric glia, thus facilitating neuronal differentiation under appropriate conditions. Molecular profiling and gene targeting of enteric glial cells in a cell culture model of enteric neurogenesis and a gut injury model demonstrate that neuronal differentiation of glia is driven by transcriptional programs employed in vivo by early progenitors. Our work provides mechanistic insight into the regulatory landscape underpinning the development of intestinal neural circuits and generates a platform for advancing glial cells as therapeutic agents for the treatment of neural deficits.


Conflict of interest statement

The authors declare no competing interests.

Figures

Fig. 1
Fig. 1. scRNA-seq and TrajectoryGeometry support a branching model of ENS lineage development.
a Developmental timeline for labelling and isolation of SOX10+ ENS cells. b UMAP representation of sequenced cells (904) coloured by cluster. c Dot plot representing level of expression of neuronal, progenitor and glial markers in clusters shown in (b). The colour scale represents the mean expression level; dot size represents the percentage of cells with non-zero expression within a given cluster. d Stacked bar plot showing neuronal and progenitor fractions within the cell populations isolated at the indicated timepoints. e The UMAP of panel b showing SOX10+ cells labelled at E12.5 and isolated at E15.5. f Slingshot analysis indicating the differentiation trajectories of ENS lineages, depicted on a PCA plot. g Individual paths for the gliogenic, neurogenic and post-branching neurogenic trajectories shown on the PCA plot (top) and projected onto a sphere (bottom). The radius of the white circles indicates the mean spherical distance from the centre of the projections. h Violin plots indicating the mean spherical distance (radii of the white circles in g) for paths sampled from the gliogenic and neurogenic trajectories (purple and orange, respectively) relative to random trajectories (white) and to each other. Statistics (two-sided Wilcoxon signed-rank for comparison to random trajectories and two-sided Mann–Whitney U test for neurogenic/gliogenic comparison) calculated using 1000 paths sampled from each trajectory. i Violin plots indicating the mean spherical distance for the neurogenic trajectory starting from successively later points in pseudotime, as the branch point is approached (85 value on the neurogenic trajectory shown in the top right inset). Calculated using three principal components. In (h) and (i) the box centre represents the median, lower and upper hinges correspond to the first and third quartiles (the 25th and 75th percentiles). The whiskers extend from the hinge to the largest value no further than 1.5 * inter-quartile from the hinge. Points beyond the end of these are plotted individually. j Line graph indicating the –log10(p-value) for the significance of directionality (two-sided Wilcoxon signed-rank tests) for the neuronal trajectory relative to random trajectories, starting from successively later points in pseudotime. Calculated using three principal components. Source data are provided as Source Data files.
Fig. 2
Fig. 2. Transcriptional changes along the gliogenic trajectory.
a Heatmap (scaled normalised expression) for selected gene modules associated with transcriptional changes along the gliogenic trajectory (red line on the PCA; top left). Representative genes are indicated on the right. b Dot plot showing statistical significance (colour of dot) and size of overlap (size of dot) between selected gene modules and indicated GO terms. Statistics have been calculated using Fisher’s one-tailed test and p values have been adjusted for multiple comparisons. c PCA plot of scRNA-seq datasets from tdT+ ENS cells (904) (Fig. 1b, e) and ANCCs (94). d, e Immunostaining for the validation of expression of genes from ANTLER GMs in the ENS of mice at E13.5 (d) and P0 (e). Arrows point to cells of the ENS lineages. Scale bars: 50 μm. Immunostainings were performed twice independently with similar results. Source data is provided as a Source Data file.
Fig. 3
Fig. 3. Transcriptomic analysis of early and late neurogenic trajectories of the ENS.
a Heatmap (scaled normalised expression) for selected gene modules associated with early and late post-branch neurogenic trajectories (red lines on the PCA; top left). Representative genes are indicated on the right. b Dot plot showing statistical significance (colour of dot) and size of overlap (size of dot) between selected gene modules and indicated GO terms. Statistics have been calculated using Fisher’s one-tailed test and p values have been adjusted for multiple comparisons. c Smoothed expression profiles for genes differentially expressed over pseudotime for early (magenta) or late (green) post-branch neurogenic trajectories. Genes shown in bold overlap with those reported in ref. . Source data is provided as a Source Data file.
Fig. 4
Fig. 4. Epigenetic changes along the gliogenic trajectory.
a UMAP representation of scATAC-seq for EGCs (686), ANCCs (964), cortical astrocytes (246) and cortical oligodendrocytes (214). b Dot plot showing GO terms overrepresented among genes with differentially accessible peaks (log2FC > 1 & padj <0.01) in promoter regions for ANCCs and EGCs. Dot size indicates the overlap for each term, and gene ratio indicates the fraction of genes in each term. c, d UMAPs (as in panel a) indicating SOX10 (c) and IRF1 (d) motif activity, calculated using Chromvar. e Volcano plots showing mean log2-transformed fold change (FC; x axis) and significance (−Log10(adjusted P value)) of differentially accessible (DA) genes from the indicated GMs between ANCCs and EGCs. f Bar plot showing the percentage of genes in the indicated GMs (x axis) that have at least one DA peak in their promoter region between ANCCs and EGCs. g Bar plot showing the statistical significance (hypergeometric test, −Log10(p-adj)) of enrichment of genes with at least one peak in their promoter region for the indicated GMs. Dashed line indicates p-adj = 0.01. h Track plots of ATAC signals for genes maintaining accessibility in EGCs relative to ANCCs (Phox2b, Zfhx3) and genes with reduced accessibility in EGCs relative to ANCCs (Hmga2, Igfbp2). Source data are provided as Source Data files.
Fig. 5
Fig. 5. Characterization of ganglioid cultures.
a Time points of ganglioid culture analysis. b At DIV4, cells derived from tdT+ EGCs (red) incorporate EdU (blue, arrowhead) and are labelled by pH3 (green/yellow, arrow). Scale bar: 100 μm. ce Immunostaining of DIV20 ganglioids (arrows) with TuJ1 (green) and S100B (blue) (c), SYN1 (green, arrows) and NOS1 (blue, arrowheads) (d), CALB, NOS1, NPY and VIP (green, arrows) (e). Scale bars: 500 μm (c), 100 μm (d, e). f Immunostaining of retinoic acid-supplemented DIV20 ganglioid cultures for NOS1 (green, arrows, top) and VIP (green, arrows, bottom). Scale bars: 100 μm. All immunostainings (bf) were performed at least 4 times. g Superimposed membrane voltage responses of representative action potential-generating DMSO (control; left) and retinoic acid-treated (right) neurons following 1 s current injections from −100 to +200 pA in 50 pA increments (scale bars: horizontal 200 ms, vertical 20 mV). Corresponding time derivative waveforms of action potentials are shown as inserts. Arrowhead points to the presence of a hump, which is a defining feature of AH-type enteric neurons (control 0/5 = 0%; RA 14/15 = 93.3%). h Bar plot showing proportion of cells firing action potentials in each treatment group: control (untreated and DMSO-ctrl cells) n = 29; RA treated: n = 26. i Mean (±standard deviation) scaled expression of GM16, 75 and 81 in bulk RNA-seq datasets (three biologically independent samples each DIV0, DIV4, DIV10, four biologically independent samples DIV20) generated from ganglioid cultures at the indicated time points. j Volcano plots showing mean log2-transformed fold change (FC; x axis) and significance (−Log10(adjusted P value)) of differentially expressed genes from the indicated GMs at DIV0 and DIV4 of ganglioid cultures. k Track plots showing Hmga2 and Igf2bp2 accessibility in bulk ATAC-seq data collected from DIV4. l UMAP representation of sequenced cells (27726) from ganglioid cultures colour-coded according to DIV. m Mean expression of developmental time-associated GMs on the UMAP shown in (l) (top) and expression of representative genes (bottom). n PCA representation of scRNA-seq data for ganglioid cultures coloured by Louvain cluster. Source data are provided as Source Data files. Cell images used in panel 5a were from BioRender.com.
Fig. 6
Fig. 6. Ganglioid cultures and gut injury recapitulate key features of enteric neurogenesis.
a Experimental strategy for CRISPR editing of ganglioid cultures. b Immunostaining of CRISPR-virus infected ganglioid cultures for HuC/D at DIV20. tdTomato (red) indicates cells originating from tdT+ EGCs and GFP (green) identifies CRISPR-infected cells (arrows), respectively. The genes targeted by CRISPR are indicated at the top. c Quantification of neurons following CRISPR editing of ganglioid cultures at DIV20. Data are mean ± s.e.m. (n = 22 (CRISPRCTRL), n = 13 (Ascl1CRISPR1+2, RetCRISPR1), n = 12 (RetCRISPR2, TncCRISPR1+2,) fields of view per group). Kruskal–Wallis test with Dunn’s multiple comparisons test. d Experimental strategy for the generation of ganglioid cultures established from Sox10CreERT2;Foxd3fl/+ and Sox10CreERT2;Foxd3fl/fl mice. e Quantification of neurons in cultures from Sox10CreERT2;Foxd3fl/+ and Sox10CreERT2;Foxd3fl/fl mice at DIV20. Data are mean ± s.e.m. (n = 10, fields of view per group, pooled from two independent experiments). Unpaired student’s t-test. f Experimental strategy for the collection of bulk RNA-seq data after BAC treatment. g Bar plot showing GO terms overrepresented amongst genes upregulated after BAC treatment. The number of genes upregulated per GO term are indicated in the bars. h Volcano plots showing mean log2-transformed fold change (FC; x axis) and significance (−Log10(adjusted P value)) of differentially expressed genes after BAC treatment. Cell-cycle associated genes coloured yellow, nervous system development associated genes coloured cyan and GM16 genes coloured magenta. Source data are provided as Source Data files.
Fig. 7
Fig. 7. Schematic showing how a branching model of lineage decisions in the ENS underpins the neurogenic potential of adult glia.
ANCCs become ENS progenitors upon invasion of the foregut. A default differentiation trajectory, that maintains a relatively continuous directionality of gene expression change, gives rise to mature enteric glia. Neurogenic trajectories branch off from this default trajectory during embryonic and early postnatal time points. As cells transit along the default ENS progenitor-glia axis neurogenic output diminishes until it ceases in adult animals at homeostasis. Accordingly, transcriptional modules that underlie active neurogenic activity (e.g. GM 16) are downregulated, whereas those related to glial maturation and immune function (e.g. GM75) are upregulated. In response to changes in the environment (in vivo injury, culture conditions) glial cells can transit to upstream positions of their developmental axis and reactivate neurogenic transcriptional programmes. Figure created with BioRender.com.

References

    1. Kriegstein A, Alvarez-Buylla A. The glial nature of embryonic and adult neural stem cells. Annu. Rev. Neurosci. 2009;32:149–184. doi: 10.1146/annurev.neuro.051508.135600. - DOI - PMC - PubMed
    1. Pardal R, Ortega-Saenz P, Duran R, Lopez-Barneo J. Glia-like stem cells sustain physiologic neurogenesis in the adult mammalian carotid body. Cell. 2007;131:364–377. doi: 10.1016/j.cell.2007.07.043. - DOI - PubMed
    1. McCallum, S. et al. Enteric glia as a source of neural progenitors in adult zebrafish. Elife10.7554/eLife.56086 (2020). - PMC - PubMed
    1. Furness, J. The Enteric Nervous System (Blackwell Publishing, 2006).
    1. Wang H, Foong JPP, Harris NL, Bornstein JC. Enteric neuroimmune interactions coordinate intestinal responses in health and disease. Mucosal Immunol. 2022;15:27–39. doi: 10.1038/s41385-021-00443-1. - DOI - PMC - PubMed

Publication types