. 2023 Sep 22;14(1):5906.
doi: 10.1038/s41467-023-41669-w.

A de novo evolved gene contributes to rice grain shape difference between indica and japonica

Affiliations

A de novo evolved gene contributes to rice grain shape difference between indica and japonica

Rujia Chen et al. Nat Commun. .

Abstract

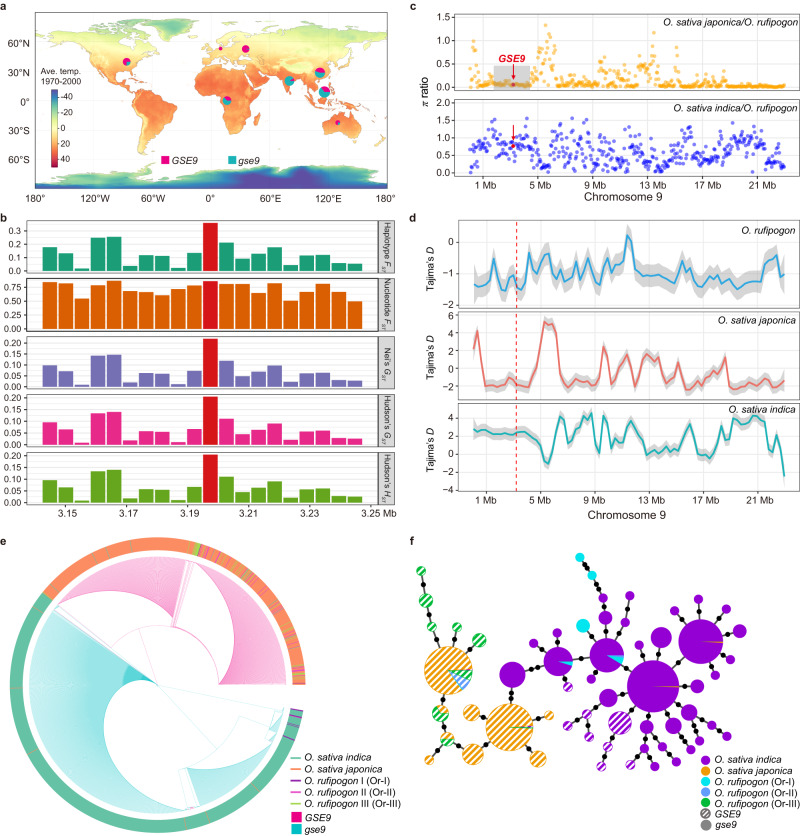
The role of de novo evolved genes from non-coding sequences in regulating morphological differentiation between species/subspecies remains largely unknown. Here, we show that a rice de novo gene GSE9 contributes to grain shape difference between indica/xian and japonica/geng varieties. GSE9 evolves from a previous non-coding region of wild rice Oryza rufipogon through the acquisition of start codon. This gene is inherited by most japonica varieties, while the original sequence (absence of start codon, gse9) is present in majority of indica varieties. Knockout of GSE9 in japonica varieties leads to slender grains, whereas introgression to indica background results in round grains. Population evolutionary analyses reveal that gse9 and GSE9 are derived from wild rice Or-I and Or-III groups, respectively. Our findings uncover that the de novo GSE9 gene contributes to the genetic and morphological divergence between indica and japonica subspecies, and provide a target for precise manipulation of rice grain shape.


Conflict of interest statement

The authors declare no competing interests.

Figures

Fig. 1
Fig. 1. Identification of the GSE9 locus for grain shape by GWAS.
a, b Genome-wide association study of grain shape. Manhattan plots for grain length (GL) (a) and grain width (GW) (b). Dashed line represents the significance threshold (P = 1 × 10-7), which is determined by the Bonferroni correction method. Well-known loci for grain shape including GS3, GIF1 and GSE5/GW5 are indicated by red arrows. c LD heatmap of the region of GSE9 locus and the genomic location of 15 predicted genes. Pairwise LD was determined by calculation of r2 (the square of the correlation coefficient between SNPs). The 15 candidate genes are indicated by I to XV. d The expression levels of 15 candidate genes in the panicle of round-grain varieties and slender-grain varieties. OsActin was used as a control. Data show means ± SD (n = 4 biological replicates). e Expression analysis of the candidate gene XII (GSE9) in panicles from the selected varieties. Data show means ± SD (n = 3 biological replicates). Scale bar, 1 cm. Source data are provided as a Source Data file.
Fig. 2
Fig. 2. Functional validation of the candidate gene GSE9 in regulating grain shape.
ah Identification of GSE9 knockout mutants generated by the CRISPR/Cas9 system in Zhonghua11 (ZH11) background. a Targeted mutagenesis of GSE9. The target mutated sites are indicated on the gene structure of GSE9. Gray box indicates the single exon of GSE9 gene. b Mutation events were confirmed by sequencing. The target mutated sites are marked with red box. c Comparisons of amino acid sequence encoded by GSE9 gene in the wild-type ZH11 and the truncated sequence of GSE9 protein in GSE9 knockout mutants. Red asterisk indicates the termination codon. df Phenotypic identification of GSE9 knockout mutants in ZH11 background. d Plant morphology of ZH11 and GSE9 knockout mutants at the mature stage. Scale bar, 20 cm. e Comparisons of grain shape between ZH11 and GSE9 knockout mutants. Scale bar, 1 cm. f Statistical analysis of grain length, grain width, and grain length/width ratio between ZH11 and GSE9 knockout mutants. Data show means ± SD (n = 19/18/16, 19/18/16, 19/18/16 biological replicates). Statistical analysis was performed by two-tailed Student’s t-test (**p < 0.01). g, h In situ expression analysis of GSE9 gene in spikelet hulls of the japonica variety. g Negative-control hybridization with GSE9 sense probe. h In situ hybridization of GSE9 in spikelet hulls. Scale bars, 50 μm. ik GSE9 expression activity was monitored using GSE9pro::GUS transgenic plants. Histochemical GUS staining in spikelet hulls (i), panicle of length 2 cm (j), and panicles of length 7, 14 and 22 cm (k). Scale bar, 2 mm in (ik), 2 cm in (k). At least three independent replicates were performed and a representative result is shown. l qRT-PCR analysis of GSE9 expression in various rice tissues. Stem, root, leaf, sheath, and node were harvested from ZH11 at the mature stage. Young panicles (YP) of different lengths (indicated as numbers, cm) were included for the analysis. OsActin was used as a control. Data shown are means ± SD of three biological replicates. Source data are provided as a Source Data file.
Fig. 3
Fig. 3. GSE9 controls grain shape by regulating cell number and cell size of the spikelet hull.
a Morphology of spikelet hulls of WT and GSE9 transgenic lines before anthesis. The white dashed line indicates the localization of the cross-sections in (b). Scale bar, 5 mm. b Cross-sections of spikelet hulls for ZH11 and GSE9 transgenic plants. Scale bar, 200 μm. The below-hand images show magnified views of the red boxed region. Scale bar, 20 μm. c Scanning electron microscopy analysis of spikelet hull outer surfaces of ZH11 and GSE9 transgenic lines. Micrograph images provided were observed from at least three biological replicates and a representative result is shown. Scale bar, 100 μm. df Comparisons of spikelet perimeter (d), cell number (e), and cell area (f) of lemma and palea between ZH11 and GSE9 transgenic plants. gk Comparisons of cell length (g), cell width (h), cell number at the longitudinal direction (i), transverse direction (j) and per square millimeter (k) of the spikelet hull outer surface of ZH11 and GSE9 transgenic lines. The ZH11-Cas9-1 mutant showed larger cell size and fewer cells than ZH11, whereas the ZH11-OE-1 displayed the opposite phenotypes. ln Differentially expressed genes related to cell cycle and cell expansion in ZH11-Cas9-1 mutant and ZH11-OE-1 line for GSE9 in rice. l Transcriptional profile from RNA-seq data for a subset of genes related to cell cycle and cell expansion in ZH11-Cas9-1 mutant and ZH11-OE-1 plant. m, n Transcript levels of the selected genes were confirmed through qRT-PCR analysis with three biological replicates. OsActin was used as a control. Data show means ± SD (n = 5/5/6, 5/5/6, 5/5/6 cells in d and e; n = 22/22/24, 22/22/24 cells in f; n = 21/20/27 cells in g and i; n = 21/20/26 cells in h, j and k). Statistical analysis was performed by two-tailed Student’s t-test (**p < 0.01; *p < 0.05; NS, not significant). Source data are provided as a Source Data file.
Fig. 4
Fig. 4. The GSE9 is a protein-coding gene through de novo origination from a previous non-coding region.
a Sequence alignment of DNA sequence of GSE9 gene and its homologous non-coding sequences in various Oryza populations. The nucleotides in the alignment of GSE9 coding region are labeled by boxes of color. Red empty box indicates the start codon site of GSE9 gene. Capital letters above the nucleotide sequences indicate the amino acids encoded by GSE9 gene in O. sativa japonica (Nipponbare), and those labeled by red bold fonts indicate the specific peptides of GSE9 protein in ProteomeXchange (PXD001046). b Comparison of GSE9 locus and its flanking sequences in O. sativa japonica and indica. c The transcript level of GSE9 in the panicles of various Oryza species determined by RT-PCR. d qRT-PCR analyses of the GSE9 transcripts in different tissues of selected Oryza species. Purple, orange and blue dots indicate the expression levels of GSE9 in leaf, stem and panicle, respectively. OsActin was used as a control. Data shown are means ± SD (n = 3 biological replicates). e Predicted 3D structures for the translation product of GSE9 using QUARK. GSE9 is predicted to encode a protein with an alpha-helix at the C-terminus. f Predicted sequence properties of GSE9 protein. Blue line plot showing the likelihood of disorder (IUPred score). Transmembrane domains and predicted secondary structures (H: alpha-helix) are also shown. g Western blot analysis of His-GSE9 protein by anti-His antibody. L1: molecular protein standard; L2: purified His-GSE9 proteins. At least three independent replicates were performed and a representative result is shown. h, i Subcellular localization of japonica GSE9 protein in tobacco leaf cells (h) and root tissues of the transgenic plants (i). Micrograph images provided were observed from at least three biological replicates and a representative result is shown. Scale bar, 10 μm. Source data are provided as a Source Data file.
Fig. 5
Fig. 5. Natural variation in GSE9 contributes to the genetic divergence between japonica and indica subspecies.
a Geographic distributions of 1697 cultivated rice varieties. Red and blue circles indicate the GSE9 and gse9 type, respectively. b The estimated parameters of genetic differentiation between japonica and indica for GSE9 locus and its flanking genomic regions. c, d The relative ratio of nucleotide diversity (c) and Tajima’s D (d) analyses in the whole chromosome 9 of cultivated and common wild rice. Red arrows and dots indicate the GSE9 locus. Gray shading in c indicates a selective sweep of ~1.2 Mb (2.95-4.15 Mb) region surrounding GSE9 locus in japonica. Line in (d) represents the linear fitting, while gray shading indicates the 95% confidence interval. e, f Phylogeny (e) and haplotype networks (f) generated from the full-length cDNA sequence of GSE9 in both cultivated rice and various groups of common wild rice varieties. Outer circle of the tree indicates various rice populations. Circle size of the network is proportional to the number of samples for each haplotype. Black spots on the lines indicate mutational steps between two haplotypes. Source data are provided as a Source Data file.
Fig. 6
Fig. 6. De novo origination of GSE9 contributes grain shape difference between indica and japonica subspecies.
The phylogenic tree indicates the origination process for the de novo evolved gene GSE9. The orthologous non-coding sequence of GSE9 was present in O. longistaminata, O. glumaepatula, O. rufipogon I, and O. sativa indica (9311). A single nucleotide G to A substitution at the start codon site in the orthologous non-coding sequence of GSE9 created the de novo ORF of this gene in O. rufipogon III that was then inherited by O. sativa japonica (NIP). The orange box indicates orthologous sequences of GSE9 gene. The solid arrow indicates the strong transcriptional signal of GSE9 gene in japonica. The dotted arrow indicates the relatively low transcriptional level of this gene in O. rufipogon Or-III. The green bar shows the start codon acquisition of GSE9, while the purple bar indicates the premature stop codon in ORF of GSE9. Typical indica varieties exhibit slender grains, while typical japonica varieties show ovate grains. Knockout of GSE9 led to slender grains in japonica, whereas introgression of this gene resulted in round grains in indica background. In the indica natural populations, the selected varieties with the gse9 type exhibited slender grains than those with the GSE9 type. All these observations revealed the role of GSE9 gene in grain shape difference between indica and japonica subspecies.

References

    1. Long M, Betran E, Thornton K, Wang W. The origin of new genes: glimpses from the young and old. Nat. Rev. Genet. 2003;4:865–875. doi: 10.1038/nrg1204. - DOI - PubMed
    1. Carvunis AR, et al. Proto-genes and de novo gene birth. Nature. 2012;487:370–374. doi: 10.1038/nature11184. - DOI - PMC - PubMed
    1. Zhao L, Saelao P, Jones CD, Begun DJ. Origin and spread of de novo genes in Drosophila melanogaster populations. Science. 2014;343:769–772. doi: 10.1126/science.1248286. - DOI - PMC - PubMed
    1. Chen S, Zhang YE, Long M. New genes in Drosophila quickly become essential. Science. 2010;330:1682–1685. doi: 10.1126/science.1196380. - DOI - PMC - PubMed
    1. Zhang L, et al. Rapid evolution of protein diversity by de novo origination in Oryza. Nat. Ecol. Evol. 2019;3:679–690. doi: 10.1038/s41559-019-0822-5. - DOI - PubMed

Publication types

Substances