

TaNRAMP3 is essential for manganese transport in Triticum aestivum
- PMID: 37737507
- PMCID: PMC10516799
- DOI: 10.1007/s44154-023-00120-2
TaNRAMP3 is essential for manganese transport in Triticum aestivum
Abstract
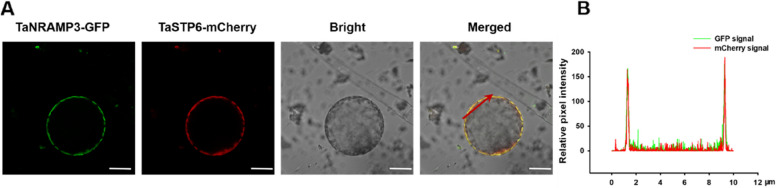
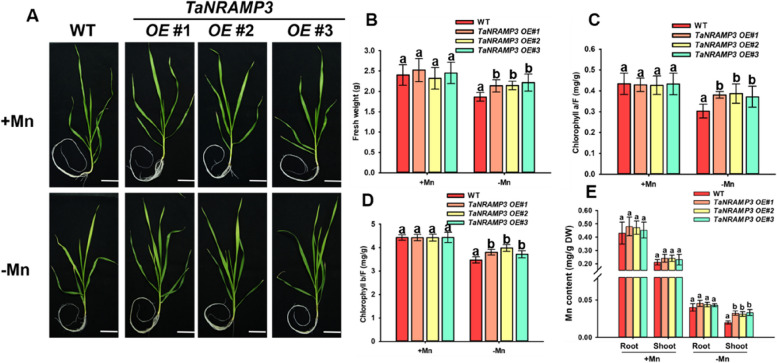
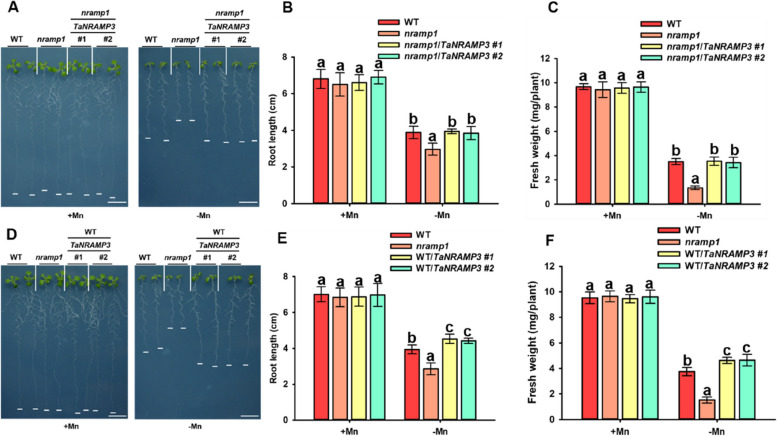
Manganese (Mn) is an essential trace element for almost all living organisms. In plants, Mn deficiency, which is occurs in calcareous soils or alkaline soils, severely limiting crop yields. However, the potential mechanism of Mn transport in Triticum aestivum is still obscure. Here, we found that TaNRAMP3, a member of the naturally resistant macrophage protein (NRAMP) family in Triticum aestivum, is located in the plasma membrane of protoplasts and functions as an influx transporter for Mn in yeast (Δsmf1). The expression of TaNRAMP3 was induced under Mn-deficiency conditions. Furthermore, TaNRAMP3-RNAi plants exhibited a sensitive phenotype, while transgenic plants overexpressing TaNRAMP3 showed a tolerant phenotype. In addition, TaNRAMP3 rescued the sensitive phenotype of Arabidopsis nramp1 mutant under Mn deficiency condition. In summary, our study reveals the key role of TaNRAMP3 in Mn transport in Triticum aestivum, allowing it to adapt to Mn-deficiency stress. These findings provide new insights for the cultivation of Mn-deficiency tolerant wheat varieties.
Keywords: Manganese; TaNRAMP3; Transporter; Triticum aestivum.
© 2023. Northwest A&F University (NWAFU).
Conflict of interest statement
The authors have no relevant financial or non-financial interests to disclose.
Figures


Similar articles
-
Ca2+-dependent phosphorylation of NRAMP1 by CPK21 and CPK23 facilitates manganese uptake and homeostasis in Arabidopsis.Proc Natl Acad Sci U S A. 2022 Oct 4;119(40):e2204574119. doi: 10.1073/pnas.2204574119. Epub 2022 Sep 26. Proc Natl Acad Sci U S A. 2022. PMID: 36161952 Free PMC article.
-
MTP8 from Triticum urartu Is Primarily Responsible for Manganese Tolerance.Int J Mol Sci. 2022 May 19;23(10):5683. doi: 10.3390/ijms23105683. Int J Mol Sci. 2022. PMID: 35628492 Free PMC article.
-
Toxic levels of manganese in an acidic Cambisol alters antioxidant enzymes activity, element uptake and subcellular distribution in Triticum aestivum.Ecotoxicol Environ Saf. 2020 Apr 15;193:110355. doi: 10.1016/j.ecoenv.2020.110355. Epub 2020 Feb 29. Ecotoxicol Environ Saf. 2020. PMID: 32120164
-
Mn-euvering manganese: the role of transporter gene family members in manganese uptake and mobilization in plants.Front Plant Sci. 2014 Apr 1;5:106. doi: 10.3389/fpls.2014.00106. eCollection 2014. Front Plant Sci. 2014. PMID: 24744764 Free PMC article. Review.
-
[Manganese uptake and transportation as well as antioxidant response to excess manganese in plants].Zhi Wu Sheng Li Yu Fen Zi Sheng Wu Xue Xue Bao. 2007 Dec;33(6):480-8. Zhi Wu Sheng Li Yu Fen Zi Sheng Wu Xue Xue Bao. 2007. PMID: 18349501 Review. Chinese.
Cited by
-
Arabidopsis calcium-dependent protein kinases 4/5/6/11 negatively regulate hydrotropism via phosphorylation of MIZU-KUSSEI1.Plant Cell. 2024 Dec 23;37(1):koae279. doi: 10.1093/plcell/koae279. Plant Cell. 2024. PMID: 39405435
-
The Manganese-Bone Connection: Investigating the Role of Manganese in Bone Health.J Clin Med. 2024 Aug 9;13(16):4679. doi: 10.3390/jcm13164679. J Clin Med. 2024. PMID: 39200820 Free PMC article. Review.
References
-
- Alejandro S, Cailliatte R, Alcon C, Dirick L, Domergue F, Correia D, Castaings L, Briat JF, Mari S, Curie C (2017) Intracellular distribution of manganese by the Trans-Golgi network transporter NRAMP2 is critical for photosynthesis and cellular redox homeostasis. Plant Cell 29:3068–3084. 10.1105/tpc.17.00578 - PMC - PubMed
-
- Alscher RG, Erturk N, Heath LS (2002) Role of superoxide dismutases (SODs) in controlling oxidative stress in plants. J Exp Bot 53:1331–1341. 10.1093/jexbot/53.372.1331 - PubMed
-
- Andresen E, Peiter E, Küpper H (2018) Trace metal metabolism in plants. J Exp Bot 69:909–954. 10.1093/jxb/erx465 - PubMed
-
- Cailliatte R, Lapeyre B, Briat JF, Mari S, Curie C (2009) The NRAMP6 metal transporter contributes to cadmium toxicity. Biochem J 422:217–228. 10.1042/bj20090655 - PubMed
Grants and funding
LinkOut - more resources
Full Text Sources
