

BCL11B and the NuRD complex cooperatively guard T-cell fate and inhibit OPA1-mediated mitochondrial fusion in T cells
- PMID: 37737560
- PMCID: PMC10620766
- DOI: 10.15252/embj.2023113448
BCL11B and the NuRD complex cooperatively guard T-cell fate and inhibit OPA1-mediated mitochondrial fusion in T cells
Abstract
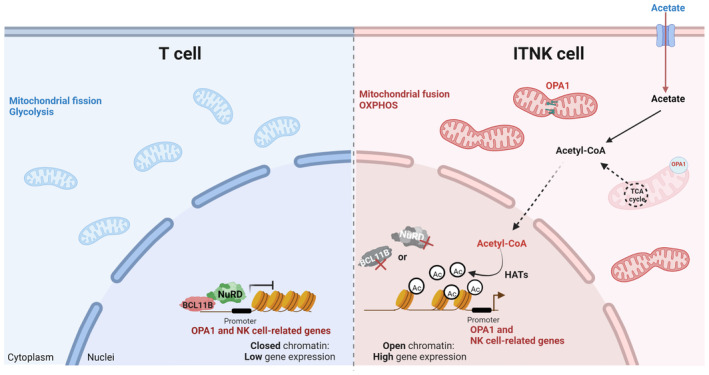
The nucleosome remodeling and histone deacetylase (NuRD) complex physically associates with BCL11B to regulate murine T-cell development. However, the function of NuRD complex in mature T cells remains unclear. Here, we characterize the fate and metabolism of human T cells in which key subunits of the NuRD complex or BCL11B are ablated. BCL11B and the NuRD complex bind to each other and repress natural killer (NK)-cell fate in T cells. In addition, T cells upregulate the NK cell-associated receptors and transcription factors, lyse NK-cell targets, and are reprogrammed into NK-like cells (ITNKs) upon deletion of MTA2, MBD2, CHD4, or BCL11B. ITNKs increase OPA1 expression and exhibit characteristically elongated mitochondria with augmented oxidative phosphorylation (OXPHOS) activity. OPA1-mediated elevated OXPHOS enhances cellular acetyl-CoA levels, thereby promoting the reprogramming efficiency and antitumor effects of ITNKs via regulating H3K27 acetylation at specific targets. In conclusion, our findings demonstrate that the NuRD complex and BCL11B cooperatively maintain T-cell fate directly by repressing NK cell-associated transcription and indirectly through a metabolic-epigenetic axis, providing strategies to improve the reprogramming efficiency and antitumor effects of ITNKs.
Keywords: CHD4; MBD2; MTA2; OPA1; T-cell fate.
© 2023 The Authors.
Conflict of interest statement
The authors declare that they have no conflict of interest.
Figures
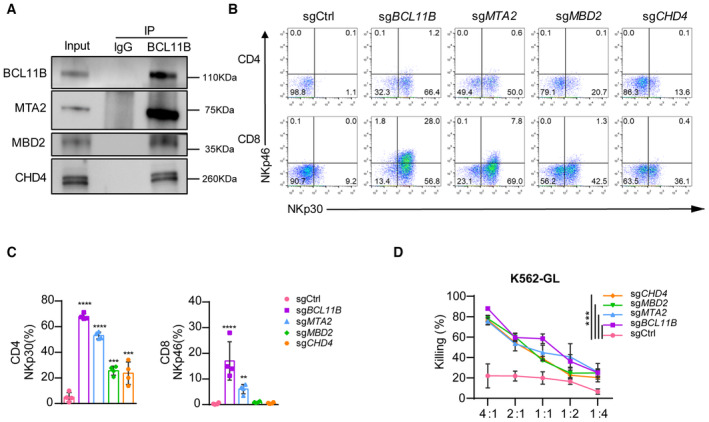
Immunoprecipitation of the nuclear extract of peripheral blood mononuclear cells (PBMC)‐derived T cells with anti‐BCL11B antibodies and western blot analysis with antibodies against the NuRD components MBD2, MTA2, and CHD4.
Human T cells from PBMC were electroporated with sgCtrl, sgBCL11B, sgMBD2, sgMTA2, or sgCHD4 and Cas9 protein after activation with CD3/CD28 antibodies for 36 h. Those T cells were cultured in T cell culture medium containing rh‐IL2 (300 U/ml) for 10 days. Representative flow cytometric detection of NKp30 and NKp46 expression in PBMC‐derived T cells transduced with sgCtrl, sgBCL11B, sgMBD2, sgMTA2, or sgCHD4. The data shown is representative of four individual healthy donors.
Graph summarizing the percentages of NKp30+ in CD4 T cells and the percentages of NKp46+ cells in CD8 T cells that were transduced with sgCtrl, sgBCL11B, sgMBD2, sgMTA2, or sgCHD4.
After culture for 10 days, T cells in (B) were incubated with the K562‐GL target cells at various E:T ratios for 24 h. Killing assays showing the percent cytotoxicity of T cells transduced with sgCtrl, sgBCL11B, sgMBD2, sgMTA2, or sgCHD4 against K562‐GL cells. The data represents killing percentage of cells from a donor.
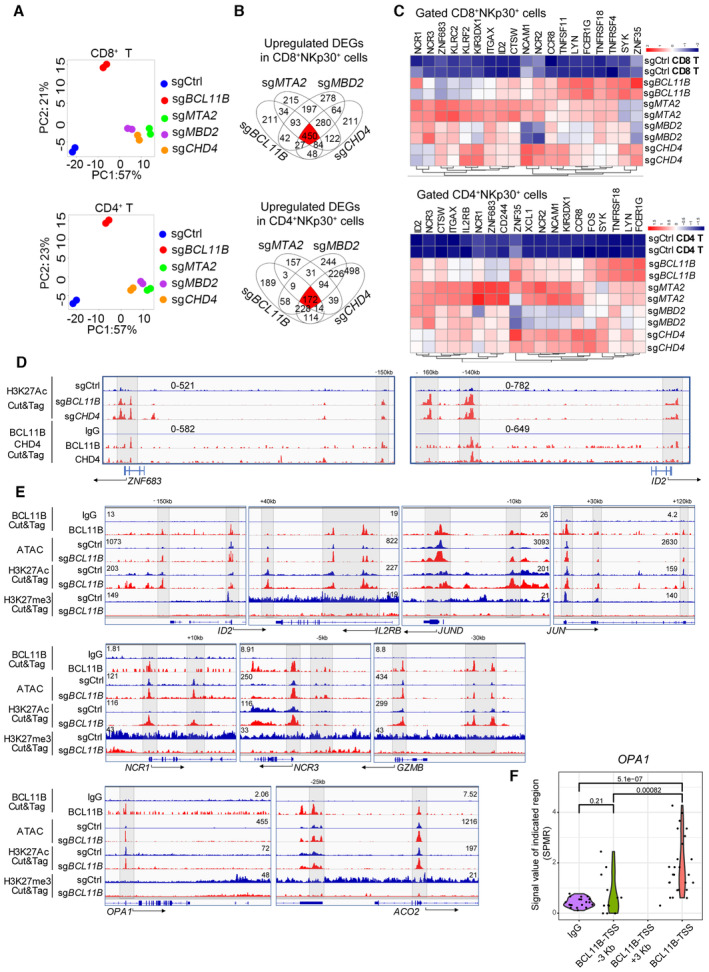
PBMC‐derived T cells from two healthy donors were transduced with sgCtrl, sgBCL11B, sgMTA2, sgMBD2, or sgCHD4 and cultured for 10 days. CD8+NKp30+ and CD4+NKp30+ cells (purity > 90%) were enriched from PBMC‐derived T cells transduced with sgBCL11B‐, sgMTA2‐, sgMBD2‐, and sgCHD4. CD4 and CD8 T cell subsets were enriched from T cells transduced with sgCtrl. Principal component analysis (PCA) was used to evaluate the similarities in the global gene expression profiles of the listed populations.
Venn diagrams for the number of upregulated differentially expressed genes (DEGs) in (A) overlapping among CD8+NKp30+ (450 genes) and CD4+NKp30+ (172 genes) subsets from sgBCL11B‐, sgMTA2‐, sgMBD2‐, and sgCHD4‐transduced T cells, compared to CD8+ and CD4+ sgCtrl‐transduced T cells.
Heatmap of the overlapping upregulated DEGs from (B).
PBMC‐derived CD8+ T cells transduced with sgCtrl, sgBCL11B‐, and sgCHD4 were cultured for 10 days in vitro before CUT&Tag experiments. Selected genome views for the H3K27Ac CUT&Tag data for sgBCL11B‐ and sgCHD4‐transduced CD8+NKp46+ cells. H3K27Ac peak data for listed NK‐cell‐associated genes in the indicated T cells. The data are representative of two individual healthy donors. CUT&Tag analysis of the binding of CHD4 to the loci of these genes in CD8+ T cells. IgG antibodies were used as a blank control.
PBMC‐derived T cells transduced with sgCtrl and sgBCL11B were cultured for 10 days in vitro. T cells were harvested and extracted DNA fragments marked by BCL11B antibody; sgCtrl‐transduced T cells and sgBCL11B‐transduced T cells (CD3+NKp46+) were harvested and extracted DNA fragments marked by H3K27Ac antibody and H3K27me3 antibody for CUT&Tag sequencing, respectively. These sgCtrl‐transduced T cells and sgBCL11B‐transduced T cells (CD3+NKp46+) were also lysed to extract nuclei for ATAC‐seq profile. Selected genome views for the BCL11B, H3K27Ac CUT&Tag, and ATAC‐seq data of T cells. CUT&Tag analysis of the binding of BCL11B to the loci of NK‐related genes, AP‐1, and metabolism‐related genes in T cells. IgG antibodies were used as a blank control. ATAC‐seq data of sgCtrl T cells and corresponding sgBCL11B T cells are shown in views of the indicated gene loci. H3K27Ac and H3K27me3 peak data of sgCtrl T cells and corresponding sgBCL11B T cells are shown in views of the indicated gene loci. The data are representative of two individual healthy donors.
Violin plot of the distribution of BCL11B binding peaks spanning 3 kb upstream to downstream of the TSS region of the OPA1 gene (BCL11B CUT&Tag data from (E)). SPMR: signal per million reads.

k‐means clustering analysis of differentially expressed genes in RNA‐seq transcriptomes revealed two distinct clusters of genes in purified CD8+NKp30+ subsets of T cells that were transduced with sgBCL11B, sgMTA2, sgMBD2, or sgCHD4 and CD8+ sgCtrl‐transduced T cells. Relative enrichment of gene sets in the k‐means cluster by hierarchical clustering heatmap analysis. Pathway enrichment (gene set and GO) was performed on cluster 1. Gene sets enriched in cluster 1 were binned into different categories and plotted.
k‐means clustering of differentially expressed genes in purified CD4+NKp30+ subsets of T cells that were transduced with sgBCL11B, sgMTA2, sgMBD2, or sgCHD4 and CD4+ sgCtrl‐transduced T cells. Gene sets enriched in cluster 2 were binned into different categories and plotted.
Representative gene sets enriched by Gene Ontology (GO) analysis of the k‐means clusters 1 from (A). GO enrichment analysis was performed by R package clusterprofile (version 4.6.2). The was visualized as heatmaps generated by customed R scripts using ggplot2 (version 3.4.0).
Representative gene sets enriched by GO term k‐means clusters 2 from (B). GO enrichment analysis was performed by R package clusterprofile (version 4.6.2). The was visualized as heatmaps generated by customed R scripts using ggplot2 (version 3.4.0).
GSEA enrichment plots for the indicated gene sets in the transcriptome of CD4+ CTL (enrichment plot: NATURAL_KILLER_CELL_MEDIATED_CYTOTOXICITY; Table EV1). The top portion of the plot shows the running enrichment score (RES) for the gene set as the analysis walks down the ranked list of genes and reflects the degree to which the gene set is overrepresented at the top or bottom of the ranked list of genes. The middle portion of the plot shows where the members of the gene set (indicated as black lines) appear in the ranked list of genes. The bottom portion of the plot shows the value of the ranking metric.
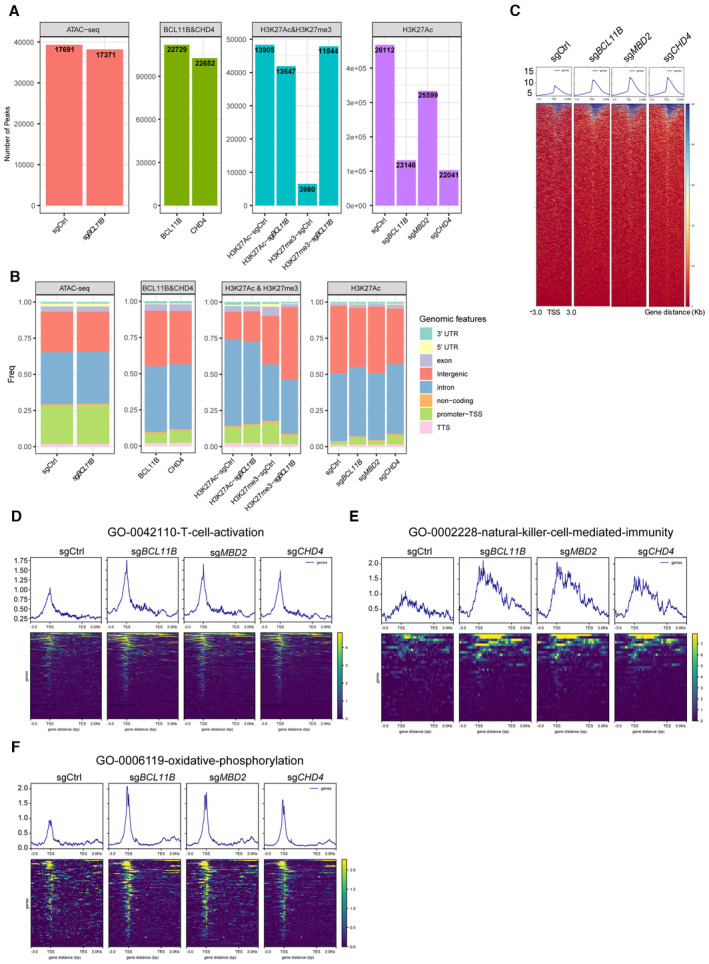
Bar chart indicating the number of peaks and the number of genes at the peak position in these omics‐seq.
Bar chart demonstrating the percentage of peaking with a TSS, TSS‐promoter, transcription end site (TES), and other sites in these omics‐seq.
Tag density pileups of H3K27Ac peaks in CD8+ T cells transduced with sgBCL11B, sgMBD2, or sgCHD4 and CD8+ sgCtrl‐transduced T cells. Two individual healthy donors were used for the CUT&Tag assay.
Tag density pileups of H3K27Ac peaks at the T‐cell‐activation gene set (see Table EV2) in CD8+ T cells transduced with sgBCL11B, sgMBD2, or sgCHD4 and CD8+ sgCtrl‐transduced T cells.
Tag density pileups of H3K27Ac peaks at the natural‐killer‐cell‐mediated‐immunity gene set (see Table EV3) in CD8+ T cells transduced with sgBCL11B, sgMBD2, or sgCHD4 and CD8+ sgCtrl‐transduced T cells.
Tag density pileups of H3K27Ac peaks at the oxidative‐phosphorylation gene set (see Table EV4) in CD8+ T cells transduced with sgBCL11B, sgMBD2, or sgCHD4 and CD8+ sgCtrl‐transduced T cells.
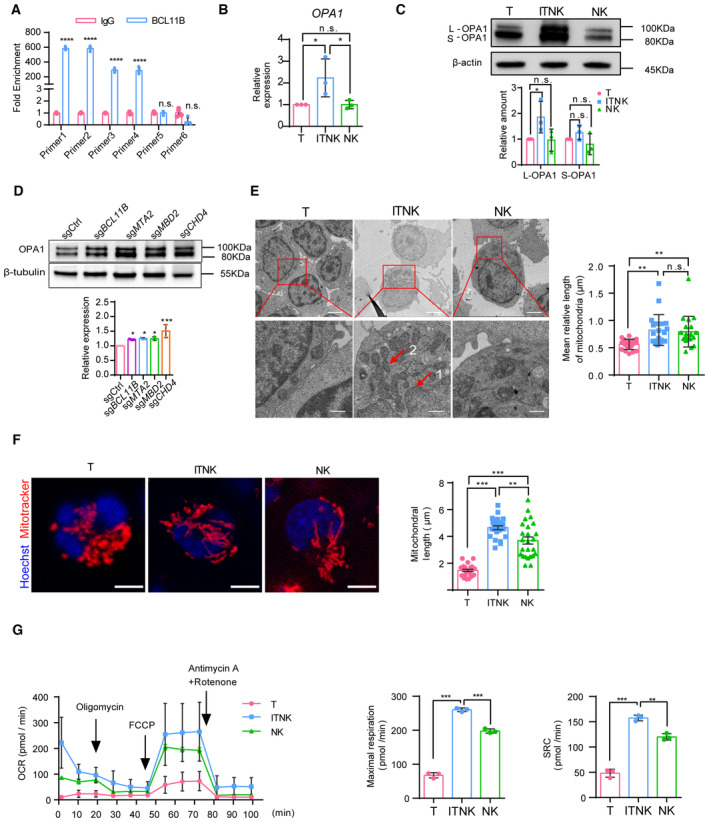
Quantifying the fold enrichment of OPA1 at different binding sites of BCL11B using CUT&Tag‐qPCR.
Relative mRNA levels of OPA1 in samples of human T cells, ITNKs (CD3+NKp46+), and NK cells (CD3−CD56+) based on quantitative RT‐PCR.
Western blot analysis of mitochondrial fusion protein OPA1 levels in samples of human T cells, ITNKs (CD3+NKp46+), and NK cells (CD3−CD56+). Graph summarizing the relative protein levels of OPA1, including the long‐form OPA1 (L‐OPA1) and the short‐form OPA1 (S‐OPA1), in ITNKs compared to T cells.
Western blot analysis of OPA1 protein levels in ITNKs that were derived from T cells transduced with sgBCL11B, sgMTA2, sgMBD2, or sgCHD4 and sgCtrl‐transduced T cells.
Transmission electron micrograph of purified T, ITNK, and NK cells from Appendix Fig S3C. ITNKs had a low nucleocytoplasmic ratio compared to T cells. 1, nucleus; 2, mitochondria. Scale bar, 2 μm (top) and 500 nm (bottom).
Confocal microscopy images showing purified T cells, ITNKs, and NK cells in which the mitochondria (MitoTracker; red) and nuclei (Hoechst; blue) are stained. Scale bars: 5 μm. Each dot represents the mean relative length of the mitochondria in a sample.
ITNKs, T cells, and NK cells derived from the same donors who provided PBMCs were cultured for 10 days without activation or priming before assaying, and cell metabolism was analyzed. OXPHOS (OCR: O2 consumption rate) assays were performed in real‐time after injection of oligomycin (2 μM), FCCP (1 μM), and antimycin A (1 μM) plus rotenone (1 μM) as indicated.
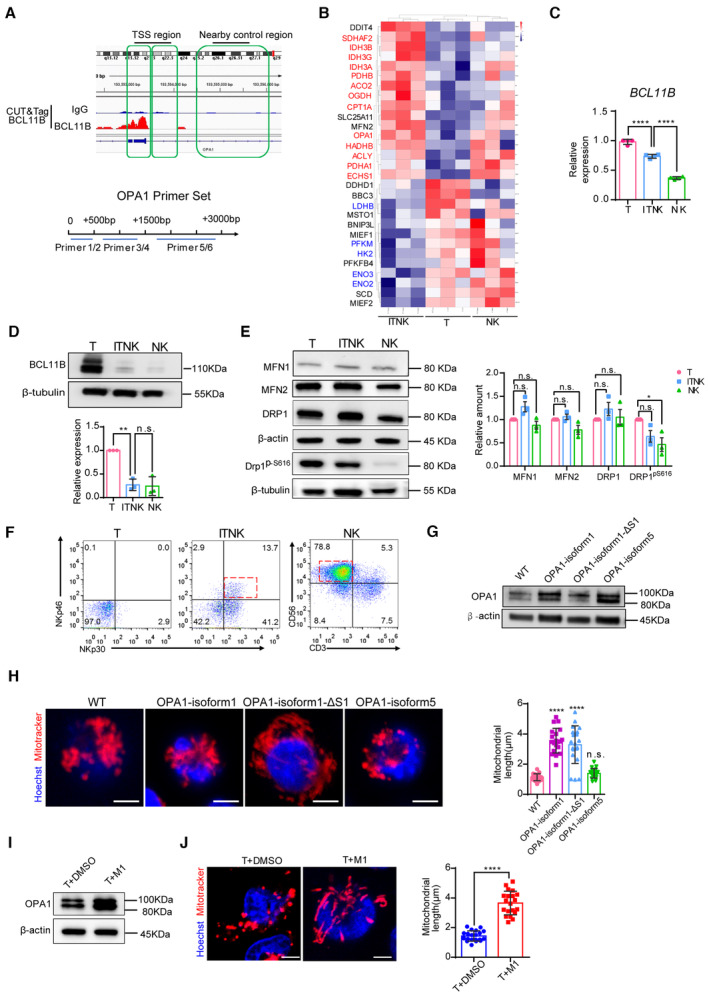
Schematic diagram of BCL11B binding sits in the TSS region of OPA1 and OPA1 qPCR primer design strategies. OPA1 qPCR Primers 1 and 2 were designed in the range of 500 bp downstream of the OPA1 TSS; primers 3 and 4 were designed in the range of 500–1,500 bp; and primers 5 and 6 were designed in the nearby control region from 1,500 to 3,000 bp.
The heatmap shows the upregulation of OPA1 and transcripts associated with TCA (tricarboxylic acid) and FAO (fatty acid oxidation) processes in ITNKs (N = 3 individual donors). Cutoff: absolute log2 (fold change) ≥ 1; adjusted P value ≤ 0.05.
Relative mRNA levels of BCL11B in samples of human T cells, ITNKs (CD3+NKp46+), and NK cells (CD3−CD56+) based on quantitative RT‐PCR.
Western blot analysis of BCL11B levels in samples of human T cells, ITNKs (CD3+NKp46+), and NK cells (CD3−CD56+). Graph summarizing the relative protein levels of BCL11B is shown in the right panel.
Western blot analysis of mitochondrial fusion (MFN1, MFN2) and fission (DRP1, DRP1pS616) protein levels in samples of PBMC‐derived T cells, ITNKs (CD3+NKp46+), and NK cells (CD3−CD56+). A graph summarizing the relative protein levels of MFN1, MFN2, DRP1, and DRP1pS616 in ITNKs compared to T cells is shown in the right panel.
T cells transduced with sgCtrl and sgBCL11B and NK cells enriched from PBMC from the same donor were cultured for 10 days in vitro and collected for FACS sorting. Representative flow cytometry analysis of purified T cells (CD3+NKp30−), ITNKs (CD3+NKp46+), and NK cells (CD3−CD56+).
Representative western blot of OPA1 in T cells with different OPA1 isoforms overexpression. β‐actin was used as a control. Isoform 1 is the long form and its mutant S1 only produces a single long form OPA1. Isoform 5 is the short form of OPA1.
Mitochondrial morphology of T cells with different OPA1 isoform overexpression in which the mitochondria (MitoTracker; red) and nuclei (Hoechst; blue) are stained. Scale bars: 5 μm. Each dot represents the mean relative length of the 20 mitochondria per replicate.
Representative western blot of OPA1 in T cells with M1 treatment. β‐actin was used as a control.
Mitochondrial morphology of T cells with M1 treatment in which the mitochondria (MitoTracker; red) and nuclei (Hoechst; blue) are stained. Each dot represents the mean relative length of the 20 mitochondria per replicate. Scale bars: 5 μm.
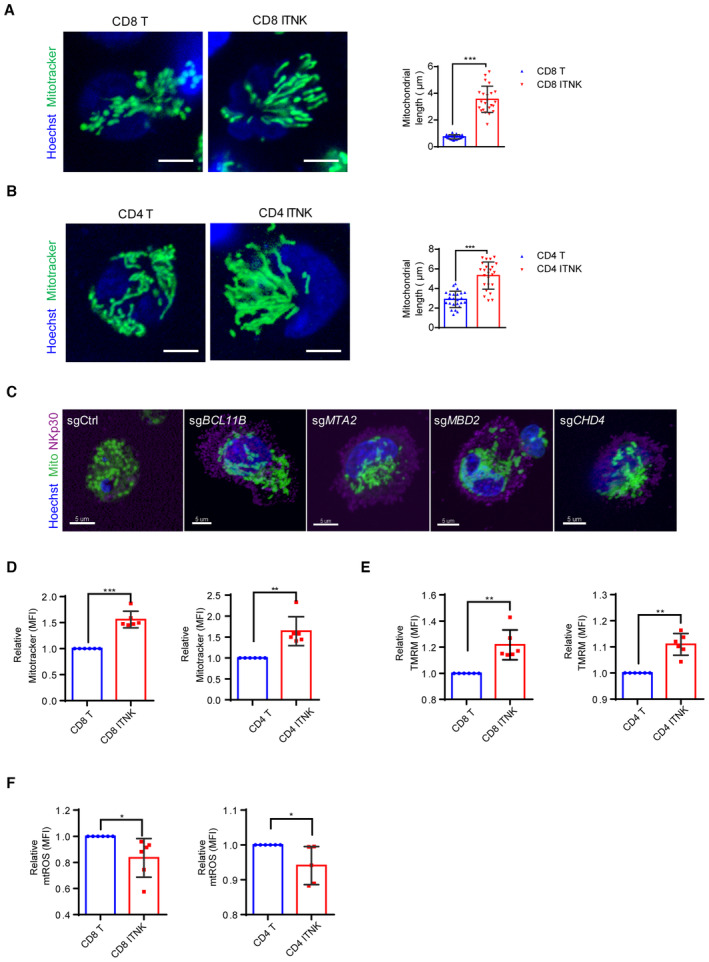
Confocal microscopy images showing purified CD8+ T cells and CD8+NKp30+ ITNKs in which the mitochondria (MitoTracker; green) and nuclei (Hoechst; blue) are stained. Each dot represents the mean relative length of the 24 mitochondria per replicate. Scale bars: 5 μm.
Confocal microscopy images showing purified CD4+ T cells and CD4+NKp30+ ITNKs in which the mitochondria (MitoTracker; green) and nuclei (Hoechst; blue) are stained. Each dot represents the mean relative length of the 24 mitochondria per replicate. Scale bars: 5 μm.
ITNKs that were derived from T cells transduced with sgBCL11B, sgMTA2, sgMBD2, or sgCHD4 or sgCtrl‐transduced T cells were cultured for 10 days for observation of mitochondrial morphology. Confocal microscopy images are shown; mitochondria (MitoTracker; green); nuclei (Hoechst; blue), and NKp30 (purple) are stained. Scale bars: 5 μm.
CD4+NKp30+ and CD8+NKp30+ ITNKs derived from sgBCL11B‐transduced T cells were purified and assessed the mitochondrial functions by FACS. CD8+ T cells and CD8+NKp30+ ITNKs (left) and CD4+ T cells and CD4+NKp30+ ITNKs (right) were stained with MitoTracker green and analyzed by flow cytometry.
CD8+ T cells and CD8+NKp30+ ITNKs (left) and CD4+ T cells and CD4+NKp30+ ITNKs (right) were stained with TMRM and analyzed by flow cytometry.
CD8+ T cells and CD8+NKp30+ ITNKs (left) and CD4+ T cells and CD4+NKp30+ ITNKs (right) were stained with MitoSOX and analyzed by flow cytometry.
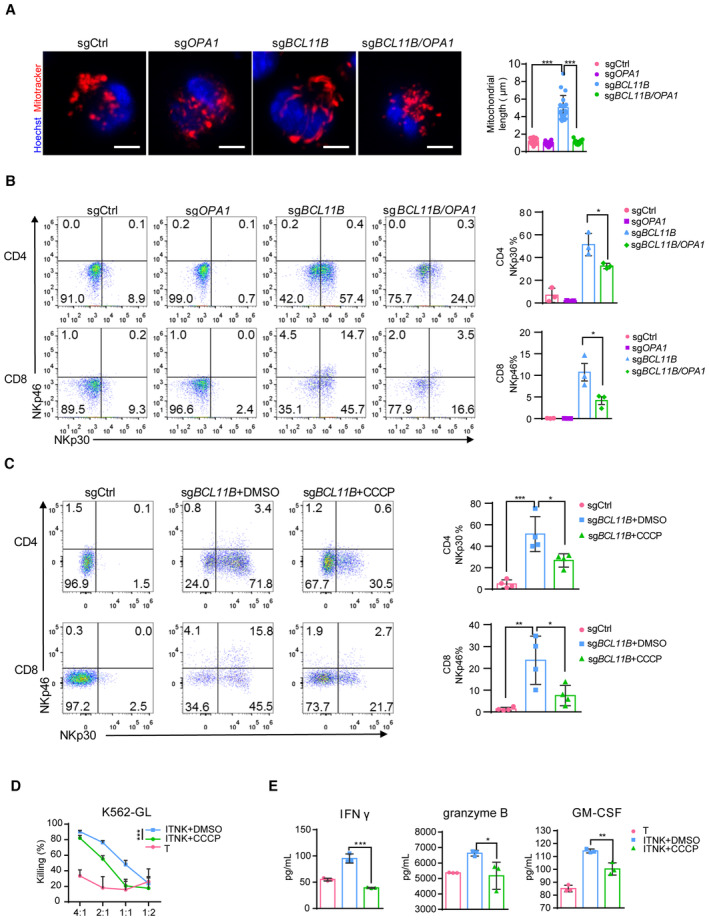
Confocal microscopy images showing T cells transduced with sgCtrl, sgOPA1, sgBCL11B, or sgBCL11B/OPA1 in which the mitochondria (MitoTracker, red) and nuclei (Hoechst; blue) are stained. Scale bars: 5 μm. Mean lengths of the 20 mitochondria per replicate, as analyzed by confocal microscopy, are shown.
Representative flow cytometric analysis of NKp30 and NKp46 expression in T cells transduced with sgCtrl, sgOPA1, sgBCL11B, or the combination of sgBCL11B and sgOPA1. A graph summarizing the percentages of NKp30+ cells in CD4+ T cells and percentages of NKp46+ cells in CD8+ T cells transduced with sgCtrl, sgOPA1, sgBCL11B, or the combination of sgBCL11B and sgOPA1 is in the right panel.
CCCP (5 μM, mitochondrial fission inducer) was added to a culture of sgBCL11B‐transduced human T cells derived from PBMCs 24 h after electroporation. Ten days later, the T cells were subjected to FACS analysis. A graph summarizing the percentages of NKp30+ and NKp46+ cells in CD4+ and CD8+ T cells transduced with sgCtrl, sgBCL11B, or sgBCL11B and treated with CCCP is shown in the right panel.
Killing assays showing the percent cytotoxicity of T cells, ITNKs, and ITNKs treated with CCCP from (C) against K562 cells. The data represents killing percentage of cells from a donor.
Cytokine secretion profiles of T cells, ITNKs, and ITNKs treated with CCCP and cocultured with K562 cells. T cells, ITNKs, and ITNKs treated with CCCP from (C) were incubated with K562 cells at an E:T ratio of 1:1 for 24 h. The supernatants were then harvested, and the concentrations of the indicated cytokines were measured by a multiplex immunoassay. The data represents the concentrations of the indicated cytokines from (D).
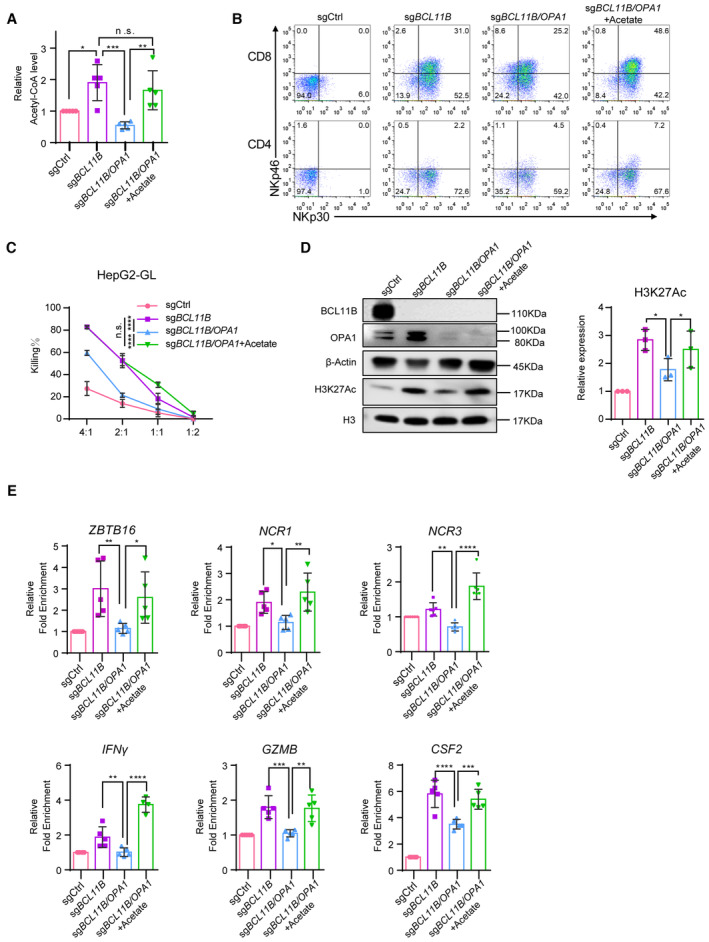
T cells transduced with sgCtrl and ITNKs that were reprogrammed from T cells transduced with sgBC11B or the combination of sgBCL11B and sgOPA1 and were treated with or without acetate (20 mM) 24 h after electroporation. Relative acetyl‐CoA levels of those T cells were measured on Day 10 of the cell culture.
Representative flow cytometry detection of NKp30 and NKp46 expression in T cells and ITNKs from (A).
Killing assays showing the percent cytotoxicity of T cells and ITNKs from (A) against HepG2 cells. The data represents killing percentage of cells from a donor.
Western blot analysis of H3K27Ac in samples of T cells and ITNKs from (A).
ChIP‐qPCR analysis of H3K27Ac in the loci of indicated genes in T cells and ITNKs from (A).
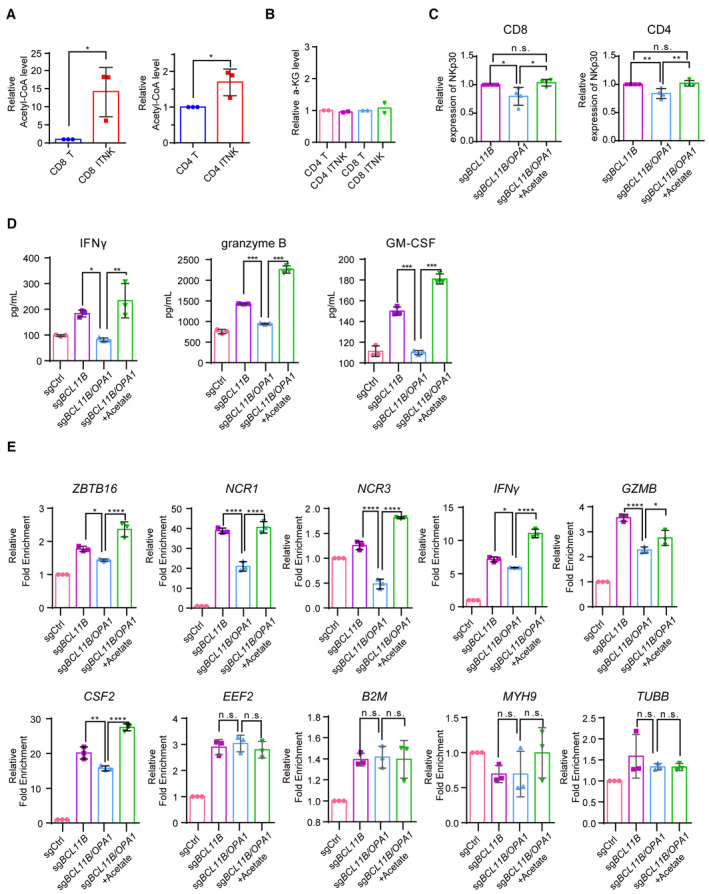
Relative acetyl‐CoA levels in CD8+ (left) and CD4+ (right) ITNKs on Day 10 that were reprogrammed from T cells transduced with sgBCL11B and sgCtrl‐transduced T cells.
Relative α‐KG levels in CD4+ (left) and CD8+ (right) ITNKs on Day 10 that were reprogrammed from T cells transduced with sgBCL11B and sgCtrl‐transduced T cells.
Graph summarizing the percentages of NKp30+ in CD4 T cells and CD8 T cells transduced with sgBC11B or the combination of sgBCL11B and sgOPA1 and treated with or without acetate (from Fig 5B).
Cytokine secretion profiles of T cells and ITNKs from Fig 5C that were incubated with HepG2 cells at an E:T ratio of 1:1 for 24 h. The supernatants were then harvested, and the concentrations of the indicated cytokines were measured by a multiplex immunoassay.
Relative mRNA levels of ZBTB16, NCR1, NCR2, NCR3, IFNγ, CSF2, and GZMB in T cells and ITNKs from Fig 5A, housekeeping genes (EEF2, B2M, MYH9, and TUBB) as negative controls, measured by quantitative RT‐PCR.
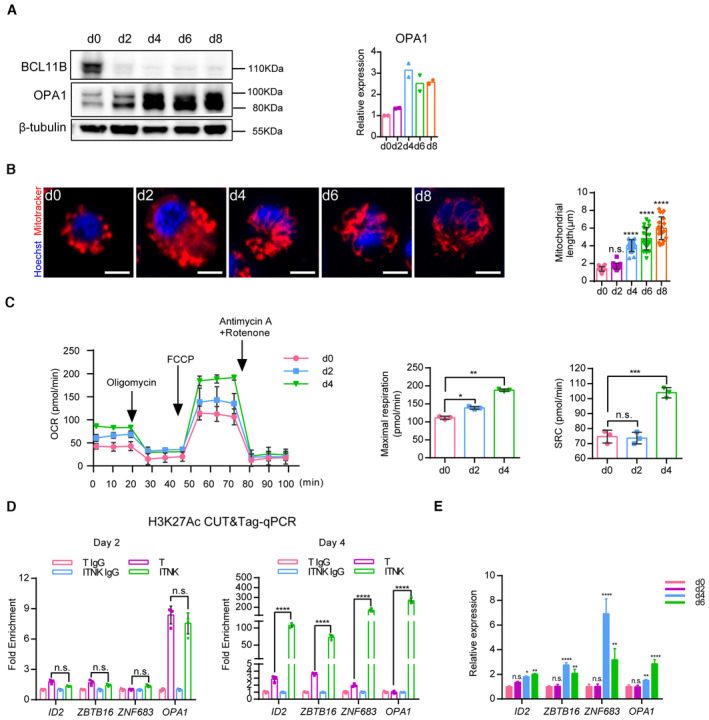
Representative western blot analysis of BCL11B and OPA1 protein levels in ITNKs from Days 0 to 8.
Representative confocal microscopy images showing ITNKs from Days 0 to 8 in the reprogramming process in which the mitochondria (MitoTracker; Red) and nuclei (Hoechst; blue) are stained. Scale bars: 5 μm. Each dot represents the mean length of the 20 mitochondria per replicate.
Mitochondrial‐stress test on Days 2 and 4 of ITNKs.
CUT&Tag‐qPCR analysis of H3K27Ac enrichment in the promoter regions of indicated genes on Days 2 and 4 of ITNKs.
Time‐course analysis of NK‐related transcription factors and OPA1 expression by RT‐qPCR.
References
Publication types
MeSH terms
Substances
LinkOut - more resources
Full Text Sources
Molecular Biology Databases
Miscellaneous
