IκB kinase-α coordinates BRD4 and JAK/STAT signaling to subvert DNA damage-based anticancer therapy
- PMID: 37737566
- PMCID: PMC10620764
- DOI: 10.15252/embj.2023114719
IκB kinase-α coordinates BRD4 and JAK/STAT signaling to subvert DNA damage-based anticancer therapy
Abstract
Activation of the IκB kinase (IKK) complex has recurrently been linked to colorectal cancer (CRC) initiation and progression. However, identification of downstream effectors other than NF-κB has remained elusive. Here, analysis of IKK-dependent substrates in CRC cells after UV treatment revealed that phosphorylation of BRD4 by IKK-α is required for its chromatin-binding at target genes upon DNA damage. Moreover, IKK-α induces the NF-κB-dependent transcription of the cytokine LIF, leading to STAT3 activation, association with BRD4 and recruitment to specific target genes. IKK-α abrogation results in defective BRD4 and STAT3 functions and consequently irreparable DNA damage and apoptotic cell death upon different stimuli. Simultaneous inhibition of BRAF-dependent IKK-α activity, BRD4, and the JAK/STAT pathway enhanced the therapeutic potential of 5-fluorouracil combined with irinotecan in CRC cells and is curative in a chemotherapy-resistant xenograft model. Finally, coordinated expression of LIF and IKK-α is a poor prognosis marker for CRC patients. Our data uncover a functional link between IKK-α, BRD4, and JAK/STAT signaling with clinical relevance.
Keywords: BRD4; IKK-α; LIF; STAT3; colorectal cancer.
© 2023 The Authors.
Conflict of interest statement
The authors declare that they have no conflict of interest.
Figures

- A
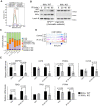
Representation of the area corresponding to the phosphor‐peptide containing S1117 of IKK‐α as determined by mass spectrometry analysis (MS) of control and IKK‐α knocked‐down HT29 cells untreated or exposed to UV light (130 mJ) for 30 min (n = 5 (untreated) and 2 (treated) biologically independent replicates).
- B, C
In vitro kinase assay with recombinant IKK‐α and purified glutathione S‐transferase (GST), GST‐BRD4 (amino acids [aa] 1,037–1,201) (B) or the same GST‐BRD4 fragment including a S > A mutation at residue 1117 (C) (from one out of three independent experiments).
- D
Representation of the area corresponding to the phosphor‐peptide including S601 from BRD4 as determined by mass spectrometry (MS) analysis of control and IKKα‐knock‐down HT29 cells untreated or exposed to UV light (130 mJ) for 30 min (n = 3 biologically independent replicates).
- E
In vitro kinase assay with recombinant IKK‐α and purified GST, two different GST‐BRD4 fragments including S601 of BRD4 or GST‐ BRD4 S1117 [aa1037‐1201] as positive control (from one out of three independent experiments).

Immunoprecipitation assay (IP) with anti‐IKKα (p45) antibody from CRC HT29 cells exposed to UV light (130 mJ) and collected at the indicated time points (from one out of three independent experiments).
Cells lysates from HCT116 cells expressing a fusion BioID‐IKK‐α protein were precipitated using streptavidin‐coated beads and then analyzed by western blot with the indicated antibodies (from one out of three independent experiments).
IP assay with anti‐BRD4 antibody from HT29 cell line untreated or collected 15 min after UV light exposure (130 mJ) (from one out of three independent experiments).
Pull‐down assay (PD) of cell lysates from HT29 cell line untreated or collected 15 min after UV light exposure (130 mJ) using GST fused to the indicated fragments of BRD4 as bait. Schematic representation of the fragments used for mapping the domains of BRD4 involved in IKKα binding (IKK‐α Binding Domains 1 and 2) (from one out of three independent experiments).


WB analysis of chromatin extracts from HT29 cell line treated with BRAF inhibitor (AZ628, 10 nM) for 16 h before UV light exposure (130 mJ) and collected as indicated time points (from one out of three independent experiments).
HCT116 BRD4 WT and HCT116 BRD4S1117A knock‐in cells exposed to UV light (130 mJ) at the indicated time points followed by subcellular fractionation (cytoplasm, nucleus and chromatin) and WB analysis (from one out of three independent experiments).
Western blot analysis of HCT116 BRD4 WT and HCT116 BRD4S1117A knock‐in cells treated as indicated (from one out of three independent experiments).
Expression analysis by qPCR of the indicated DDR‐related genes from WT and BRD4S1117A knock‐in HCT116 cells. Bars represent mean values and standard error of the mean (s.e.m.) from six independent replicates; P‐values were derived from two‐sided unpaired t‐test. ****P‐value < 0.0001, **P‐value < 0.01.

- A, B
Western blot analysis (WB) of chromatin extracts from MEFs (A) and Caco2 (B) IKK‐α WT and IKK‐α KO exposed to UV light (130 mJ) and collected at the indicated time points (from one out of three independent experiments).
- C, D
WB analysis of cytoplasmic, nuclear, and chromatin extract from HT29 cell line collected at different time points after UV treatment (130 mJ) (A) or treated with 5 FU + Irinotecan (5FU = 5 μg/ml, Irinotecan = 2 μg/ml) at the indicated time points (B) (from one out of three independent experiments).
- E
WB analysis of chromatin extract from HT29 cells collected at different time points after IR exposure (10Gy) (from one out of three independent experiments).
- F
Densitometric analysis of the ratio of acetylated K5 of histone H4 and total H4 from Figs 3A (upper graph), 3B (medium graph), and 3C (lower graph). Since the sum of relative acK5 in WT and KO (or AZ628‐treated) cells was adjusted a 100 in the graphs, the confluence of orange and blue bars at 50 (dotted line) indicates identical acetylation levels in both systems.
- G
WB analysis of HCT116 cells untreated or pretreated with the BRD4 inhibitor JQ1 for 16 h and the exposed to UV as indicated (from one out of three independent experiments).

- A–D
Correlation of ChIP‐seq depth across the genome of untreated or IR‐treated WT and IKK‐α KO APCMin/+ organoid samples. Untreated IKK‐α WT and KO (A), IR‐treated and untreated IKK‐α WT (B), IR‐treated and untreated IKK‐α KO (C) and IR‐treated IKK‐α WT and KO (D). In all the plots dots correspond to 1 kb non‐overlapping genome windows. Dots in blue represent genomic regions that show a higher coverage in untreated WT compared with IR‐treated WT, according to a linear model. In red are regions that show a higher coverage in IR‐treated WT compared with untreated WT. In purple, regions with a higher coverage in IR‐treated KO compared to untreated KO; and in yellow, regions with a higher coverage in IR‐treated IKK‐α KO compared to IR‐treated WT.
- E
Enrichment analysis of different TFs targets from ENCODE and CHEA databases within each group of BRD4‐bound regions (CWT, regions specifically detected in the WT untreated; CKO, regions detected in untreated IKK‐α KO; “random” refers to randomly selected regions of the genome; WTIR, regions exclusively detected in IR‐treated IKK‐α WT; and KOIR regions exclusively found in IR‐treated IKK‐α KO cells).
- F, G
Venn diagrams representing the number of BRD4‐bound genes upon IR treatment that are IKK‐α dependent (F) and those who have been previously identified as STAT3 targets (G).
- H–K
qPCR gene expression analysis of the double BRD4 and STAT3 target gene Bcl3 in APCMin/+ organoids (H, J and K) or MEFs (I) treated as indicated (IR; 10 Gy). Reduced levels of MYC (J) and p‐STAT3 (K) indicated the efficacy of the treatments. Bars in (H–K) represent mean values from two independent replicates; P‐values were derived from two‐sided unpaired t‐test in (H), (I) and (K) and from one‐way ANOVA in (J). **P‐value < 0.01, *P‐value < 0.05; n.s.: no significant.
- L, M
IP with anti‐BRD4 antibody from untreated or UV‐treated IKK‐α WT and KO APCMin/+ organoids (L) or IKK‐α WT MEFs untreated or treated with 10 μM ruxolitinib (Rux) for 16 h and then exposed to UV light (130 mJ) for 15 min (M). (one out of three independent experiments is shown).
- N
IP with anti‐BRD4 antibody from parental and HCT116 S1117A knock‐in HCT116 cells collected 15 min. after UV exposure (one out of three independent experiments performed id shown).

Graphical representation of the area corresponding to the BRD4 peptide including the phosphorylated S1117 present in the lysates from APCMin/+‐derived organoids.
WB analysis of chromatin lysates from APCMin/+‐derived organoids exposed to IR and recovered at the indicated time points (from one out of three independent experiments).
Genomic distribution of the different BRD4‐enriched regions. Random: randomly selected regions of the genome; BRD4_all: BRD4‐bound regions regardless IKK‐α genotype and treatment conditions; CWT: BRD4‐bound regions in untreated WT cells, WTIR_KOIR: BRD4‐bound upon treatment independent of IKK‐α genotype; WTIR: BRD4‐bound regions upon IR in WT and, KOIR: BRD4‐bound upon IR in IKK‐α KO.
Representation of BRD4 distribution (from ChIP sequencing) in the BCL3 gene promoter in untreated or IR‐treated WT and IKKα KO APCMin/+ organoids. The promoter region that is specifically bound by BRD4 in IR‐treated IKK‐α WT cells is outlined in the figure.
qPCR analysis of the indicated genes in WT and IKK‐α KO APCMin/+ organoids treated with IR for 30 min. Bars represent mean values and standard error of the mean (s.e.m.) from two independent replicates; P‐values were derived from two‐sided unpaired t‐test.

WB analysis of protein extracts from WT and IKK‐α KO APCMin/+ organoids exposed to ionizing radiation (IR) (10 Gy) and collected at the indicated time points (one out of three independent experiments is shown).
qPCR analysis of the indicated genes in MEFs IKK‐α WT and IKK‐α KO.
WB analysis of extracts from MEFs IKK‐α WT and KO pretreated with IL‐6 (50 ng/ml), IL‐3 (100 μg/ml), LIF (10 ng/ml) (Leukemia inhibitory factor) or ruxolitinib (Rux, 2.5 μM) for 16 h, or conditioned media (C.M.) from UV‐treated (30 min.) WT MEFs (one out of two independent experiments performed is shown).
qPCR analysis of WT and IKK‐α KO cells untreated or treated with IL‐6 (50 ng/ml) or LIF (10 ng/ml) for 16 h.

- A–E
WB analysis of WT and IKKα KO MEFs (A), Caco2 (B), Hela (C, D), and PDO5 cells (E) treated as indicated (one out of three independent experiments is shown).
- F
WB analysis of HT29 CRC cells untreated or pretreated with the BRAF inhibitor AZ628 for 16 h and then exposed to IR as indicated (from one out of three independent experiments).

- A
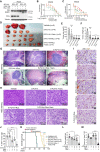
WB analysis of IKK‐α WT and KO PDO5 cells treated with IC20 5‐FU + Iri for 72 h and ruxolitinib (Rux, 40 μM) for 16 h (from one out of two independent experiments).
- B, C
Dose–response curves of PDO5 cells treated with 5‐FU + Iri alone or in combination with ruxolitinib [40 μM] (B) or 5‐FU + Iri and AZ628 [25 μM] with or without ruxolitinib (C) for 72 h (one out of three biologically replicates performed is shown). 5‐FU, 5‐fluorouracil: Iri, irinotecan.
- D–F
Photograph of tumors recovered from mice with xenografts in the indicated groups of treatment (D) and quantification of the size (E) and weight (F) of tumors. Of note that two of the tumors in the vehicle group were sacrificed during the weekend and processed by the personal in the animal facility, consequently they were not photographed and only one was measured.
- G, H
Representative microscopic images of tumors recovered from mice in the indicated groups of treatment showing the areas containing alive tumor cells labeled as T and delimited by dashed lines (G). Detail of the residual tumor areas (H). Notice the presence of massive fibrotic and necrotic areas surrounding the tumor areas. Number of tumors displaying the exposed phenotype (X) from the total of animals in each group (N) is indicated in the upper‐right corner of the images (X/N).
- I, J
IHC analysis of the proliferation marker ki67 in the remaining tumor areas of the different groups of treatment (I) and quantification (J) of 10 areas per group (40X), when possible.
- K
Kaplan–Meier curves for mice bearing a metastatic human tumor treated as indicated. Overall survival is indicated for the different treatments and statistical significance was determined using the Mantel‐Cox log‐rank test. In the legends Vem, vemurafenib; 5‐FU, 5‐fluorouracil; Rux, ruxolitinib and Iri, irinotecan.
- L, M
Total weight (L) and volume (M) of tumors recovered at humanitarian endpoint for each mouse or at the end of the experiment in the case of quadruple combination treatment group.

- A
WB analysis of IKK‐α WT and KO PDO8 cells treated with IC20 5‐FU + Iri for 72 h and with ruxolitinib for 16 h (from one out of two independent experiments).
- B, C
Dose–response assay of PDO4 (G) and PDO5 cells (H) treated as indicated. In all the experiments, the vehicle of the inhibitors was added to the 5‐FU + Iri only treatment (n = 3 replicates examined, from one out of two biologically independent experiments). 5‐FU, 5‐fluorouracil: Iri, irinotecan.
- D
Representative image of ki67 staining in the normal colonic mucosa adjacent to the tumors treated with the triple combination 5‐FU + Iri., vemurafenib and ruxolitinib.
- E–H
Photograph of tumors recovered from mice in the indicated groups of treatment (E) and quantification of the size (F), weight (G), and percent of proliferating (ki67+) cells (H) in the different tumors. Bars in (F–H) represent mean values and standard deviation. Statistical significance was determined by one‐way ANOVA test and the Tukey's multiple comparison analysis. *P‐value < 0.05, **P‐value < 0.01, ***P‐value < 0.001, ****P‐value < 0.0001; n.s.; no significant.
- I
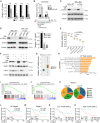
qPCR analysis of LIF, LIFR, and GP130 levels in the indicated cellular models (n = 2 (HT29, Caco2, HeLa, PDO8, MEFs), 3 (HCT116, PDO5), and 4 (APCmin) biologically independent experiments).
- J
Graphical representation of LIF mRNA levels in the CRC tumors deposited at the TCGA dataset.
- K
Violin plots showing LIF mRNA levels in the CRC tumors classified as CHUK high and CHUK low in the TCGA dataset. Boxes represent the central 50% of the data (from the lower 25th percentile to the upper 75th percentile), lines inside boxes represent the median (50th percentile), and whiskers are extended to the most extreme data point. Statistical P‐value from Wilcoxon two‐sided test is shown.
- L, M
Spearman's rank correlation analysis of LIF and CHUK levels in human CRC tumors from the TCGA dataset including all stages (E) (n = 329) or considering stage II tumors only (F) (n = 106).

- A
qPCR analysis of LIF levels in the indicated IKK‐α WT and KO cells (n = 2 independent replicates for APCMin and n = 3 for MEFs, PDO5 and Caco2).
- B
ChIP‐qPCR analysis of p65/NF‐κB binding to the promoter region of the murine LIF gene in MEFs IKK‐α WT and KO (n = 3 biologically replicates performed).
- C
WB analysis of untreated and anti‐LIF‐treated (100 μg/ml for 2 h) IKK‐α WT MEFs and IKK‐α KO MEFs incubated for 2 h with control or anti‐LIF‐treated IKK‐α WT conditioned media (C.M.) (one out of two independent experiments is shown).
- D
WB analysis (left panel) of control and LIF shRNA‐transduced IKKα WT MEFs and IKK‐α KO incubated with control medium or conditioned media from the indicated cells treated with IR for 30 min (from one out of two independent experiments). qPCR analysis of LIF levels (right panel) of control and LIF shRNA‐transduced IKK‐α WT and IKKα KO MEFs (n = 2 independent experiments performed).
- E, F
Survival assay in HCT116 CRC cells treated as indicated (E) and WB analysis of the same cells with the indicated antibodies (F) to evaluate the effects of the α‐LIF antibody and JQ1 on p‐STAT3 and MYC levels, respectively (n = 3 biologically replicated performed).
- G
Box plots of LIF mRNA levels in tumors samples (n = 566) compared with normal samples (n = 19) from the Marisa dataset. Boxes represent the central 50% of the data (from the lower 25th percentile to the upper 75th percentile), lines inside boxes represent the median (50th percentile), and whiskers are extended to the most extreme data point. Statistical P‐value from Wilcoxon two‐sided test is shown.
- H
Barplot depicting the normalized enrichment score of statistically significant enriched pathways obtained by GSEA analysis with the Hallmark gene set for patients with high‐LIF expression (NOM P‐value < 0.05).
- I, J
GSEA of the TNFα via NF‐κB (B) and JAK/STAT (C) pathway in high‐LIF (n = 159) versus low LIF (n = 170) tumors in TCGA patients. P‐value is nominal P‐value given by the GSEA program in (J) and (K).
- K
Pie charts showing the molecular subtype distribution according to Guinney et al (Guinney et al, 2015) in patients carrying LIF high (n = 55) and LIF low (n = 51) tumors from the stage II TCGA cohort. From 55 high‐LIF tumors, 41 with CMS information: CMS1 n = 16, CMS2 n = 12, CMS3 n = 4 and CMS4 n = 9. From 51 low LIF tumors, 41 with CMS information: CMS1 n = 4, CMS2 n = 13, CMS3 n = 9 and CMS4 n = 15.
- L, M
Kaplan–Meier representation of disease‐free survival (DFS) over time for all patients in the TCGA CRC cohort (E) (LIF high n = 222 and LIF low n = 107) and selected stage II patients (F) (LIG high n = 37 and LIF low n = 37) according to LIF mRNA levels (optimized cutoff of 8.94 and 9.89, respectively).
- N, O
Kaplan–Meier representation of disease‐free survival (DFS) over time for stage II patients in the indicated groups according to CHUK and LIF levels.

References
-
- Amado RG, Wolf M, Peeters M, Van Cutsem E, Siena S, Freeman DJ, Juan T, Sikorski R, Suggs S, Radinsky R et al (2008) Wild‐type KRAS is required for panitumumab efficacy in patients with metastatic colorectal cancer. J Clin Oncol 26: 1626–1634 - PubMed
Publication types
MeSH terms
Substances
Associated data
- Actions
LinkOut - more resources
Full Text Sources
Molecular Biology Databases
Research Materials
Miscellaneous

