. 2023 Nov 1;211(9):1298-1307.
doi: 10.4049/jimmunol.2300232.

Mass Spectrometric Profiling of HLA-B44 Peptidomes Provides Evidence for Tapasin-Mediated Tryptophan Editing

Affiliations

Mass Spectrometric Profiling of HLA-B44 Peptidomes Provides Evidence for Tapasin-Mediated Tryptophan Editing

Amanpreet Kaur et al. J Immunol. .

Abstract

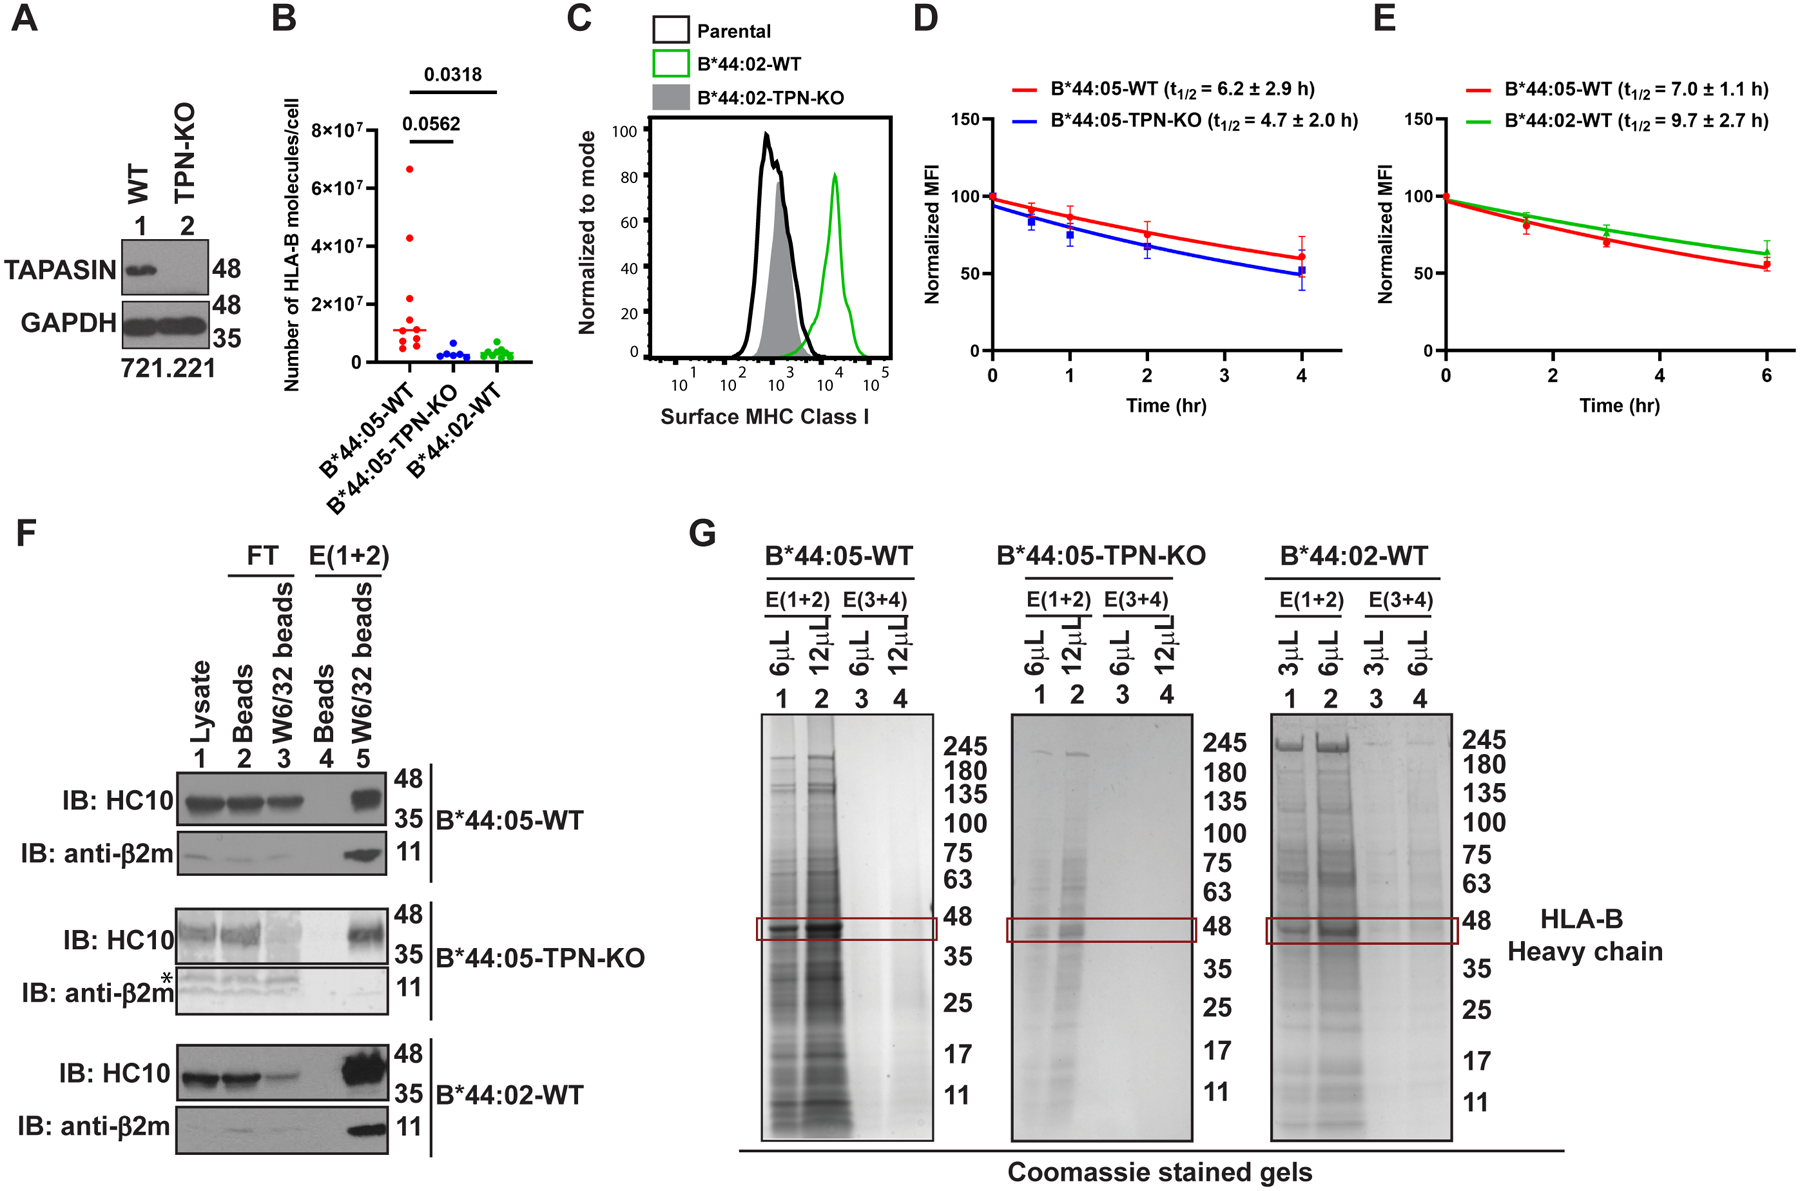
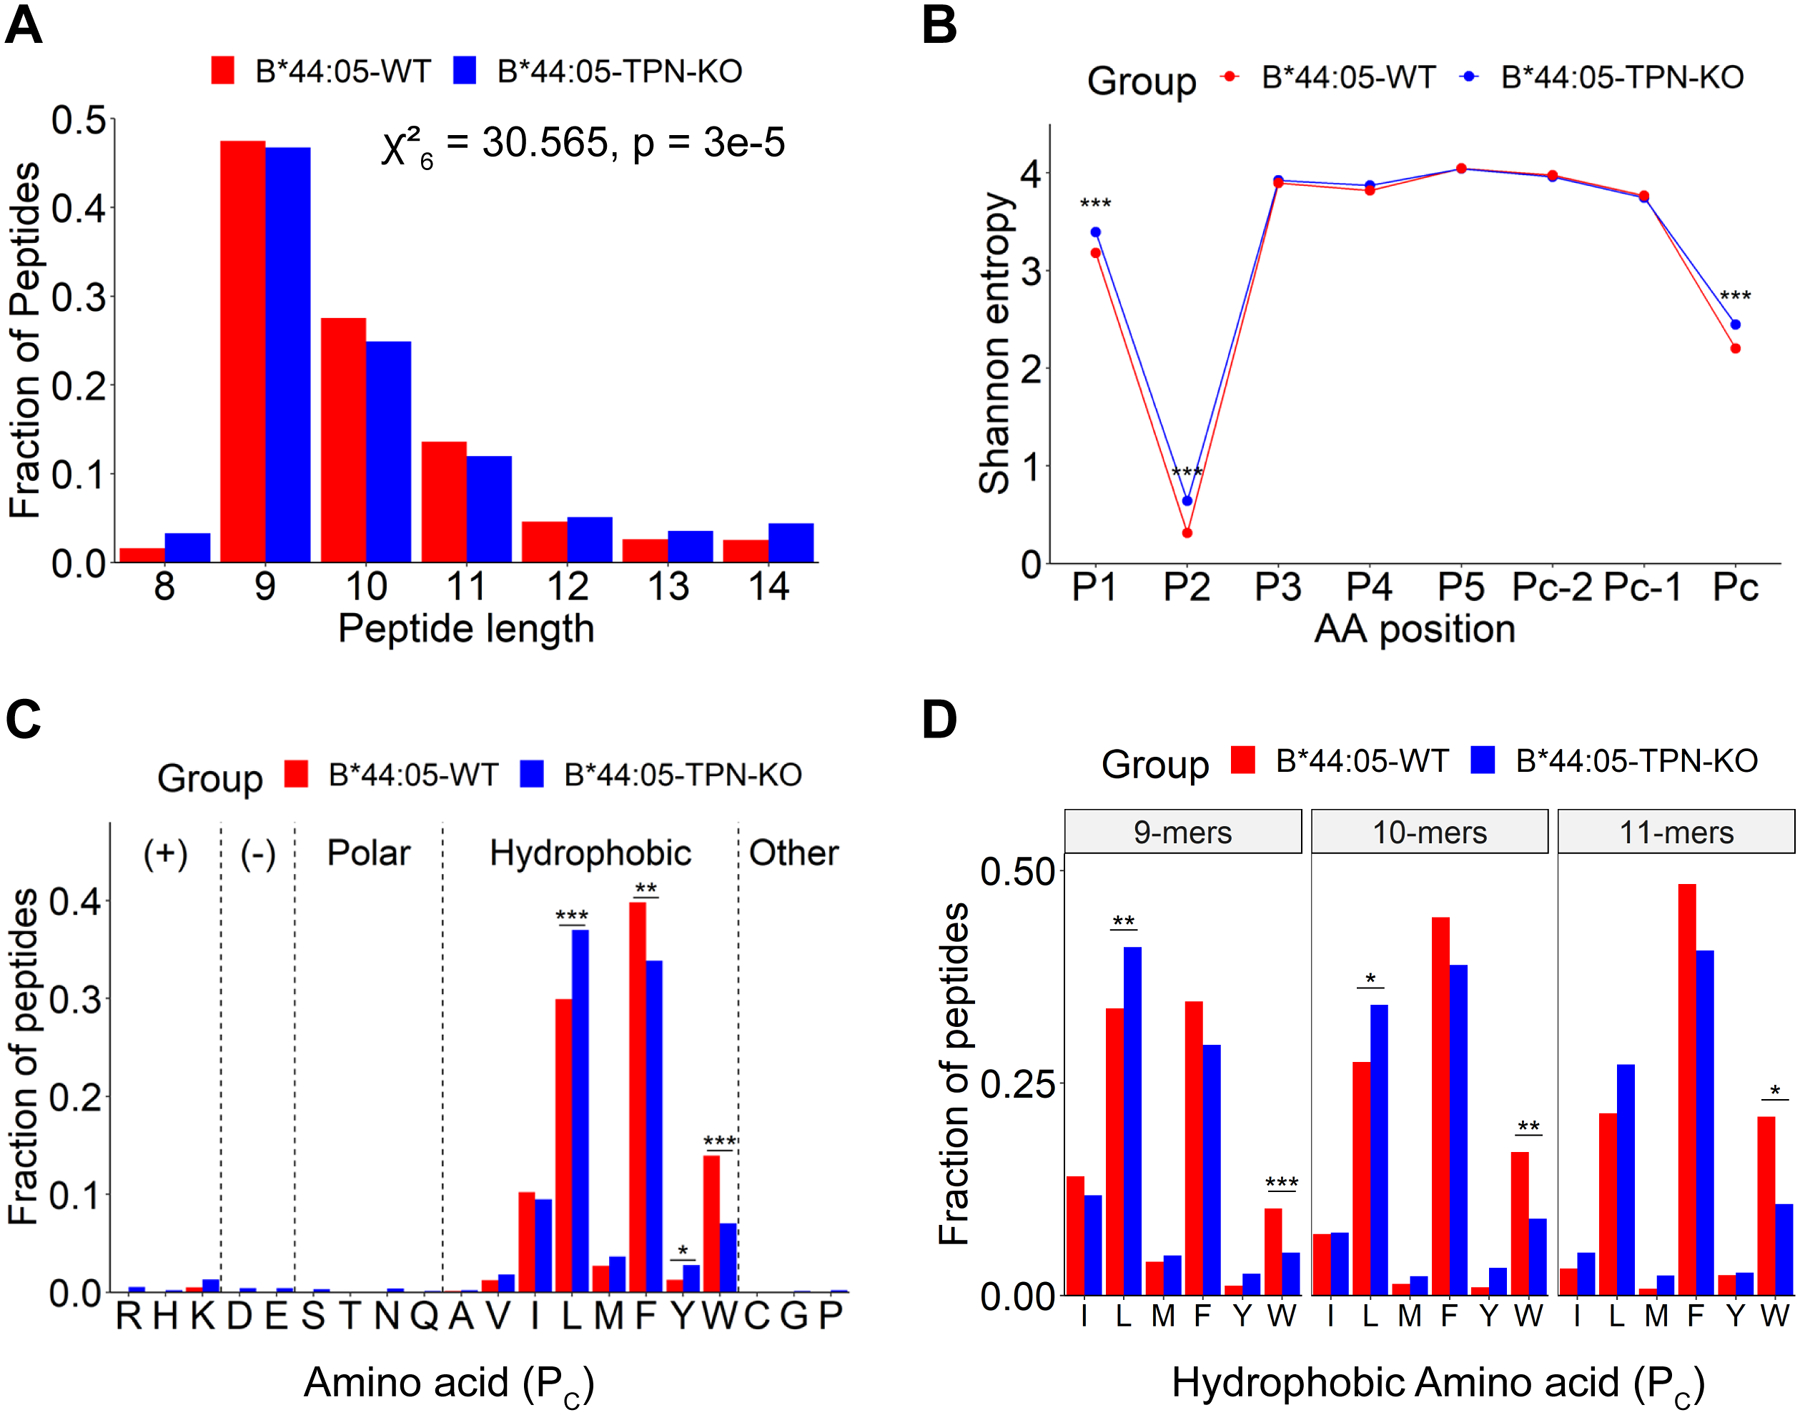
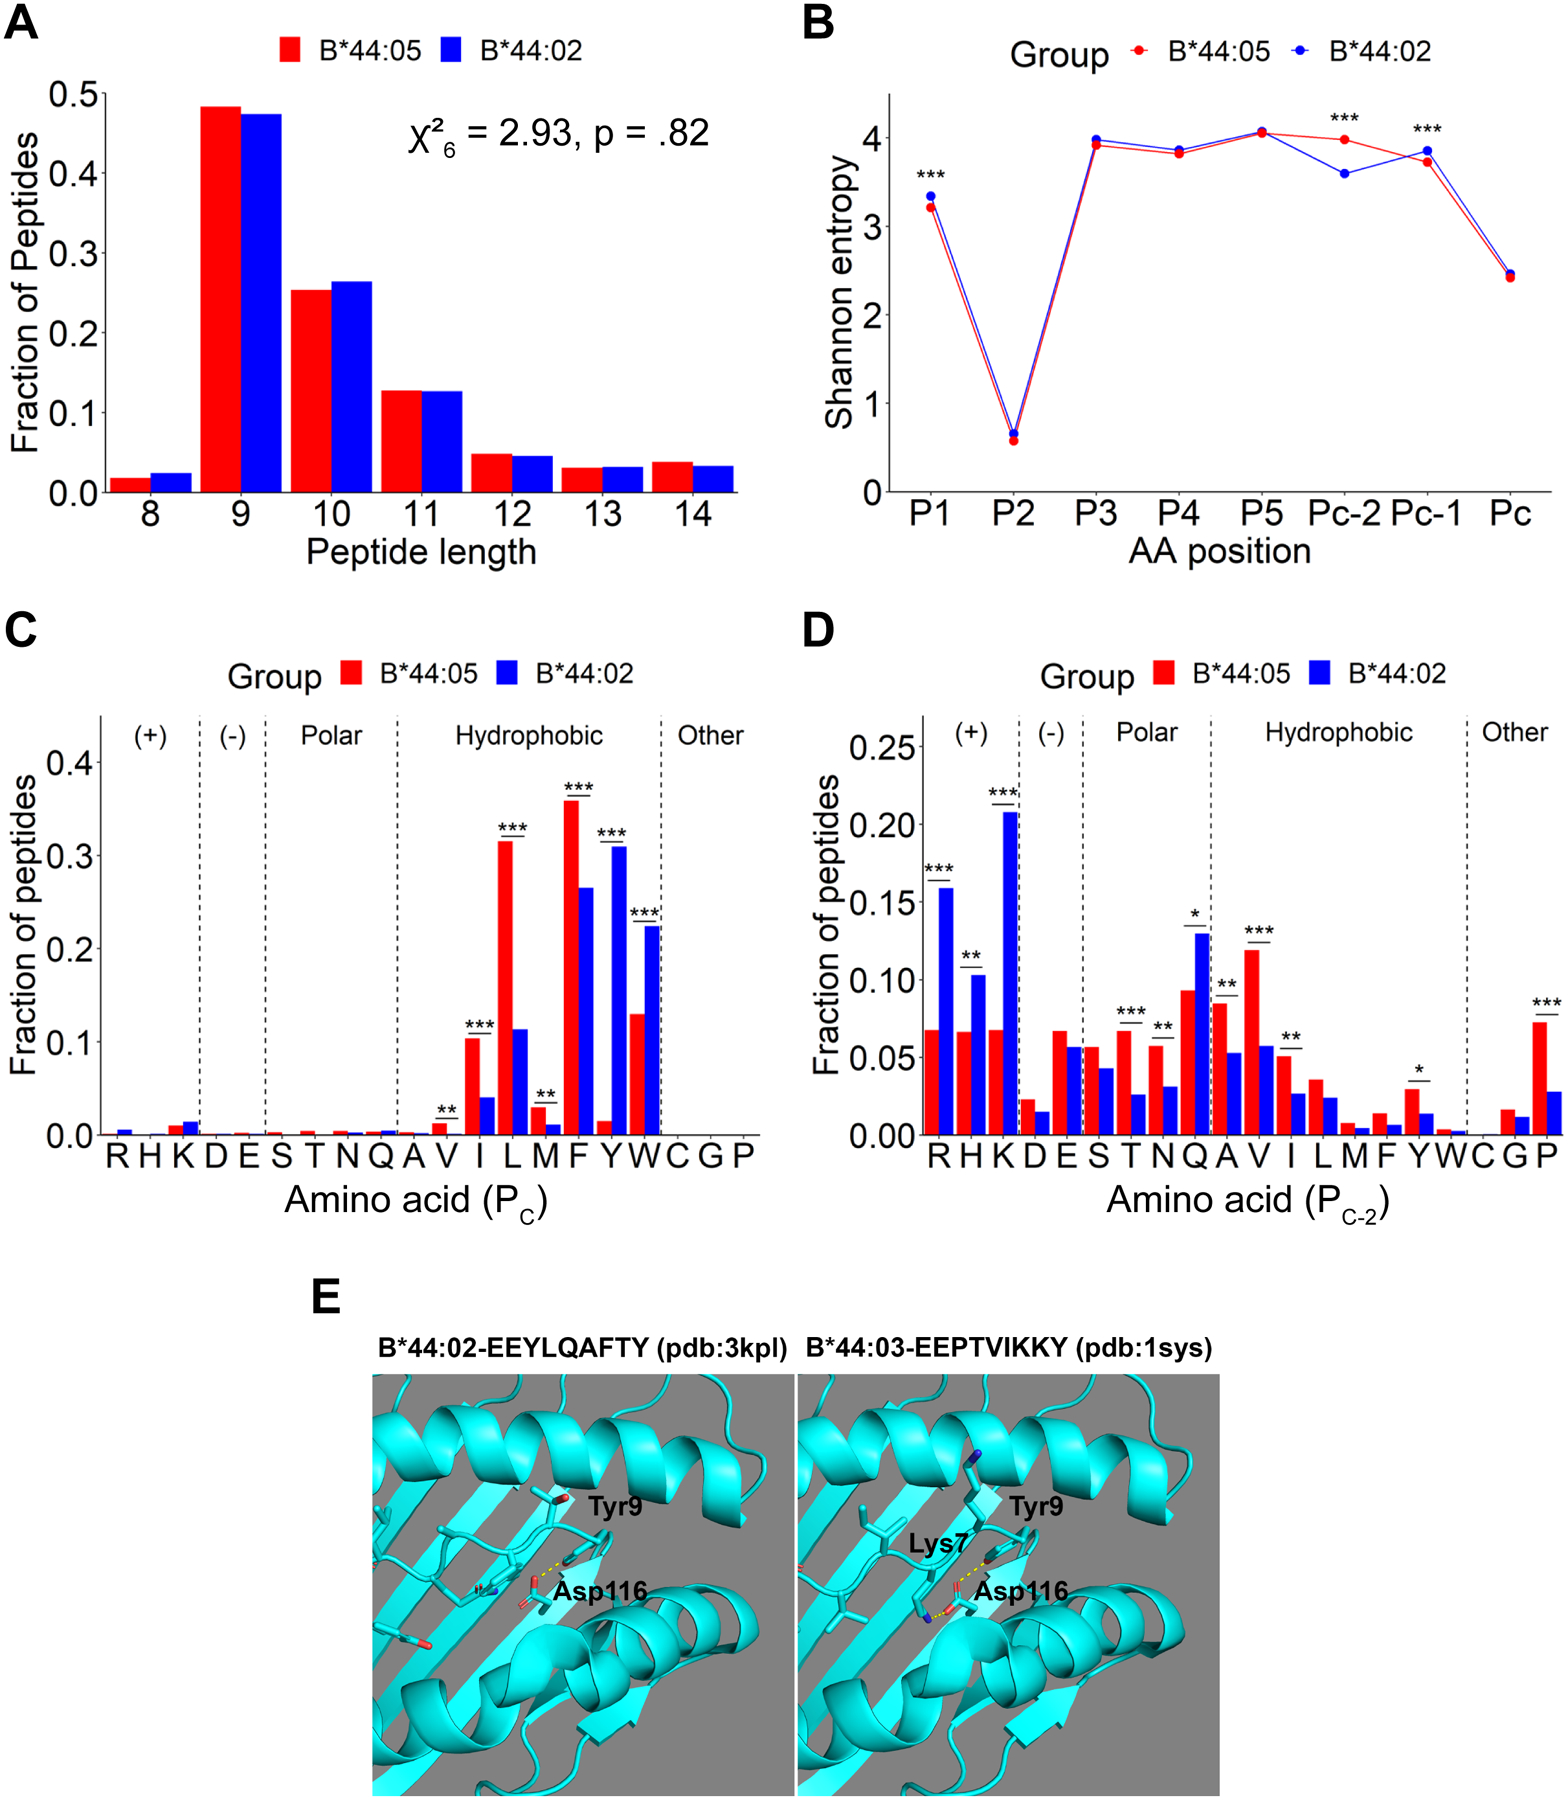
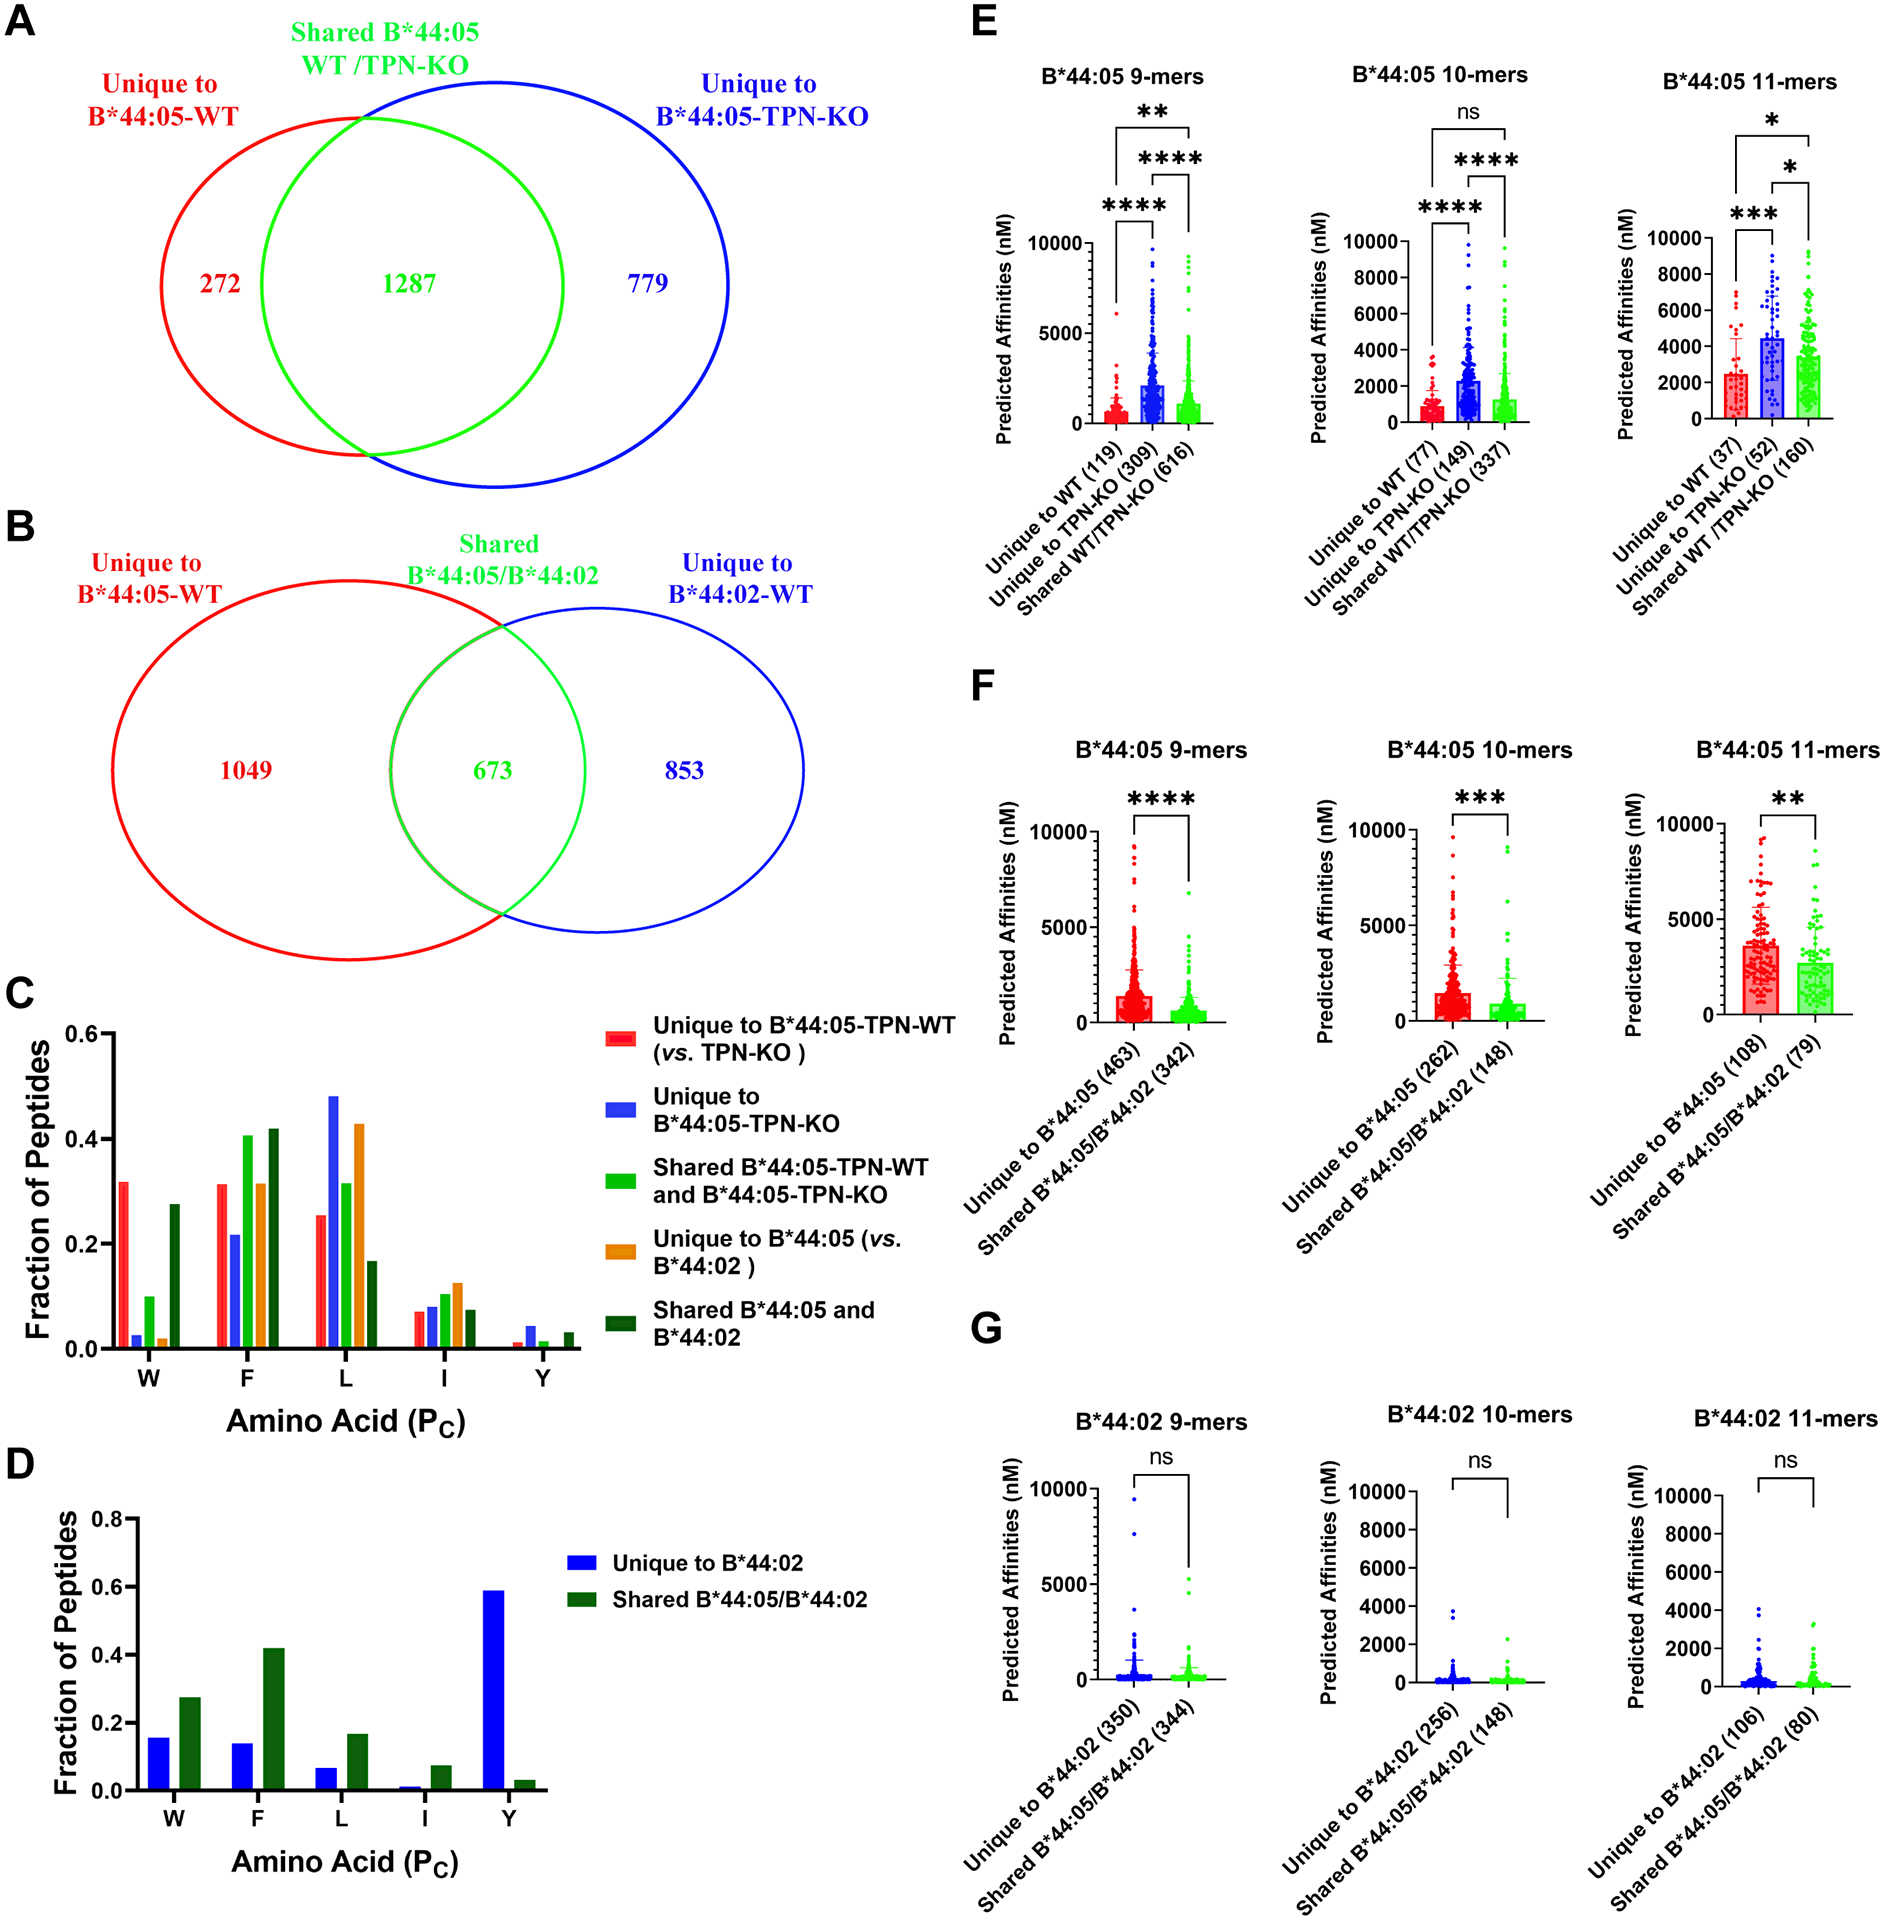
The extreme polymorphisms of HLA class I proteins result in structural variations in their peptide binding sites to achieve diversity in Ag presentation. External factors could independently constrict or alter HLA class I peptide repertoires. Such effects of the assembly factor tapasin were assessed for HLA-B*44:05 (Y116) and a close variant, HLA-B*44:02 (D116), which have low and high tapasin dependence, respectively, for their cell surface expression. Analyses of the HLA-B*44:05 peptidomes in the presence and absence of tapasin reveal that peptides with C-terminal tryptophans and higher predicted affinities are preferentially selected by tapasin, coincident with reduced frequencies of peptides with other C-terminal amino acids, including leucine. Comparisons of the HLA-B*44:05 and HLA-B*44:02 peptidomes indicate the expected structure-based alterations near the peptide C termini, but also C-terminal amino acid frequency and predicted affinity changes among the unique and shared peptide groups for B*44:02 and B*44:05. Overall, these findings indicate that the presence of tapasin and the tapasin dependence of assembly alter HLA class I peptide-binding preferences at the peptide C terminus. The particular C-terminal amino acid preferences that are altered by tapasin are expected to be determined by the intrinsic peptide-binding specificities of HLA class I allotypes. Additionally, the findings suggest that tapasin deficiency and reduced tapasin dependence expand the permissive affinities of HLA class I-bound peptides, consistent with prior findings that HLA class I allotypes with low tapasin dependence have increased breadth of CD8+ T cell epitope presentation and are more protective in HIV infections.


Conflict of interest statement

Conflicts of Interest

All the authors have no conflicts of interest to declare.

Figures

Figure 1:
Figure 1:. Influences of tapasin deficiency and tapasin dependence upon HLA-B44 expression and stability:
A) Representative blots showing tapasin (TPN) expression in the lysates of 721.221-B*44:05 WT (lane 1) and tapasin knockout (lane 2) cells. The sgRNA sequence is given in the materials and methods. B) The graph shows number of HLA-B molecules expressed on the surface of WT (n=10), TPN-KO (n=6) 721.221-B*44:05 cells and 721.221-B*44:02 cells (n=9) measured by quantitative flow cytometry following staining with W6/32-FITC antibody. Statistical significance was calculated using an ordinary one-way ANOVA with Tukey’s correction for multiple comparisons. C) Representative histograms show HLA-B*44:02 expression on WT or TPN-KO cells measured by flow cytometry following staining with W6/32-FITC antibody. A representative histogram for surface MHC Class I levels on 721.221-parental cells is shown as a control. D and E) Plots show averaged changes in the expression (normalized relative to the 0 h condition) of HLA class I on the surface of B*44:05-WT vs B*44:05-TPN-KO 721.221cells (C, n=4), and B*44:05-WT vs B*44:02-WT cells (D, n=5) assessed using the W6/32 antibody, at different time points following brefeldin A treatment. For each condition, calculated half-lives are indicated as t1/2. F) Representative blots of HLA-B*44 purifications from B*44:05-WT, B*44:05-TPN-KO and B*44:02-WT 721.221 cells. “Beads” indicates protein A beads used for pre-clearing of lysates and “W6/32 beads” indicates protein A beads crosslinked to W6/32 antibody. HLA-B heavy chain and β2m are probed using HC10 and anti-β2m antibodies, respectively. The low signal for β2m in the B*44:05-TPN-KO eluates from W6/32 beads is likely due to the short exposure of the representative blot. Follow up experiments verified that heavy chain: β2m ratios are similar in the eluates from B*44:05-WT and B*44:05-TPN-KO cells. G) Representative Coomassie brilliant blue stained gels of HLA-B*44 purifications from B*44:05-WT, B*44:05-TPN-KO and B*44:02-WT 721.221 cells. The red outlined box marks the HLA-B heavy chain bands in the eluates from W6/32 beads. E, Elution; FT, Flow through; IB, Immunoblot.
Figure 2:
Figure 2:. Characteristics of HLA-B*44:05 peptides purified from wild type or tapasin-KO cells:
A) Length distributions of peptides identified for the B*44:05-WT and B*44:05-TPN-KO conditions, indicated as a fraction of total number of peptides. Significant differences in distribution were determined using the Chi-squared test of independence. B) Shannon Entropy (SE) plots for indicated positions within the 9-mer, 10-mer, and 11-mer peptides from (A). The PC, PC-1 and PC-2 represent the C-terminal, and the −1 and −2 positions relative to the C-terminus, respectively. Significant differences in SE at each position were determined using a bootstrap hypothesis test with Bonferroni corrected p-values. C and D) The fractional distribution of indicated amino acids at the PC position of combined 9–11-mer peptides (C) or 9-mer, 10-mer and 11-mer peptides as indicated (D), grouped according to the side chain properties of individual amino acids (C) or length (D). Significant differences in the amino acid distributions were determined using the Chi-squared test of independence, with standardized residual post-hoc tests using Benjamini-Hochberg corrections. *: p < 0.05; **: p < .01; ***: p < .001. Peptides that were overlapping across two or more runs for each condition (WT or TPN-KO) were included in the analyses.
Figure 3:
Figure 3:. Characteristics of peptides purified from B*44:02 compared with those from B*44:05 and the molecular basis for the specificity differences:
A) Length distributions of identified peptides, indicated as a fraction of total number of peptides. Non-significant differences in distributions were determined using the Chi-squared test of independence. B) SE plots for indicated positions within 9-mer, 10-mer, and 11-mer peptides from (A). The PC, PC-1 and PC-2 represent the C-terminal, and the −1 and −2 positions relative to the C-terminus, respectively. Significant differences in SE at each position were determined using a bootstrap hypothesis test with Bonferroni corrected p-values. C and D) The fractional distribution of all amino acids at the PC (C) and PC-2 (D) positions of 9-mer, 10-mer, and 11-mer peptides. Peptides are grouped by side chain properties. Significant differences in distributions were determined using the Chi-squared test of independence, with standardized residual post-hoc tests using Benjamini-Hochberg corrections. *: p < 0.05; **: p < .01; ***: p < .001. Peptides that were overlapping across two or more runs for each condition (B*44:05 and B*44:02) were included in the analyses. E) Structure of B*44:02 and B*44:03 with indicated peptides to depict the molecular basis for the tyrosine at PC and basic residue at PC-2 specificities. The Figure was prepared using the PyMOL Molecular Graphics System (version 1.8.4.2) Schrödinger, LLC.
Figure 4.
Figure 4.. Tapasin and tapasin-dependent assembly facilitate the acquisition of B*44:05 peptides with enhanced C-terminal tryptophan content and higher affinities.
A) The Venn diagram shows the total number of peptides grouped into the unique to B*44:05-TPN-KO, unique to B*44:05-WT, or shared categories, as described in Supplemental Figure 2A. B) The Venn diagram shows the total number of peptides grouped into those unique to B*44:02-WT, unique to B*44:05-WT, or shared between the two categories, as described in Supplemental Figure 2B. C and D) Fraction of 9–11-mer peptides with indicated C-terminal amino acids for the different groups of B*44:05 peptides (C) and B*44:02 peptides (D). E-G) The predicted binding affinities (nM) of B*44:05 (E and F) or B*44:02 (G) peptides were calculated for the indicated peptide groups and plotted separately for the 9-mer, 10-mer, and 11-mer peptides. Peptides with predicted affinities >10,000 nM are excluded in all cases. Statistical analyses are based on one-way Anova analyses (E) or unpaired t-tests (F and G). *p < 0.05, **p < 0.01, ***p < 0.001, ****p < 0.0001. ns, non significant.

Update of

References

    1. Jiang J, Natarajan K, and Margulies DH. 2019. MHC Molecules, T cell Receptors, Natural Killer Cell Receptors, and Viral Immunoevasins-Key Elements of Adaptive and Innate Immunity. Adv Exp Med Biol 1172: 21–62. - PubMed
    1. Robinson J, Barker DJ, Georgiou X, Cooper MA, Flicek P, and Marsh SGE. 2020. IPD-IMGT/HLA Database. Nucleic Acids Res 48: D948–D955. - PMC - PubMed
    1. Zaitoua AJ, Kaur A, and Raghavan M. 2020. Variations in MHC class I antigen presentation and immunopeptidome selection pathways. F1000Res 9. - PMC - PubMed
    1. Blum JS, Wearsch PA, and Cresswell P. 2013. Pathways of antigen processing. Annu Rev Immunol 31: 443–473. - PMC - PubMed
    1. Blees A, Januliene D, Hofmann T, Koller N, Schmidt C, Trowitzsch S, Moeller A, and Tampe R. 2017. Structure of the human MHC-I peptide-loading complex. Nature 551: 525–528. - PubMed

Publication types

MeSH terms