. 2023 Nov 1;211(9):1348-1358.
doi: 10.4049/jimmunol.2300406.

The Lysosomal Calcium Channel TRPML1 Maintains Mitochondrial Fitness in NK Cells through Interorganelle Cross-Talk

Affiliations

The Lysosomal Calcium Channel TRPML1 Maintains Mitochondrial Fitness in NK Cells through Interorganelle Cross-Talk

Dennis Clement et al. J Immunol. .

Abstract

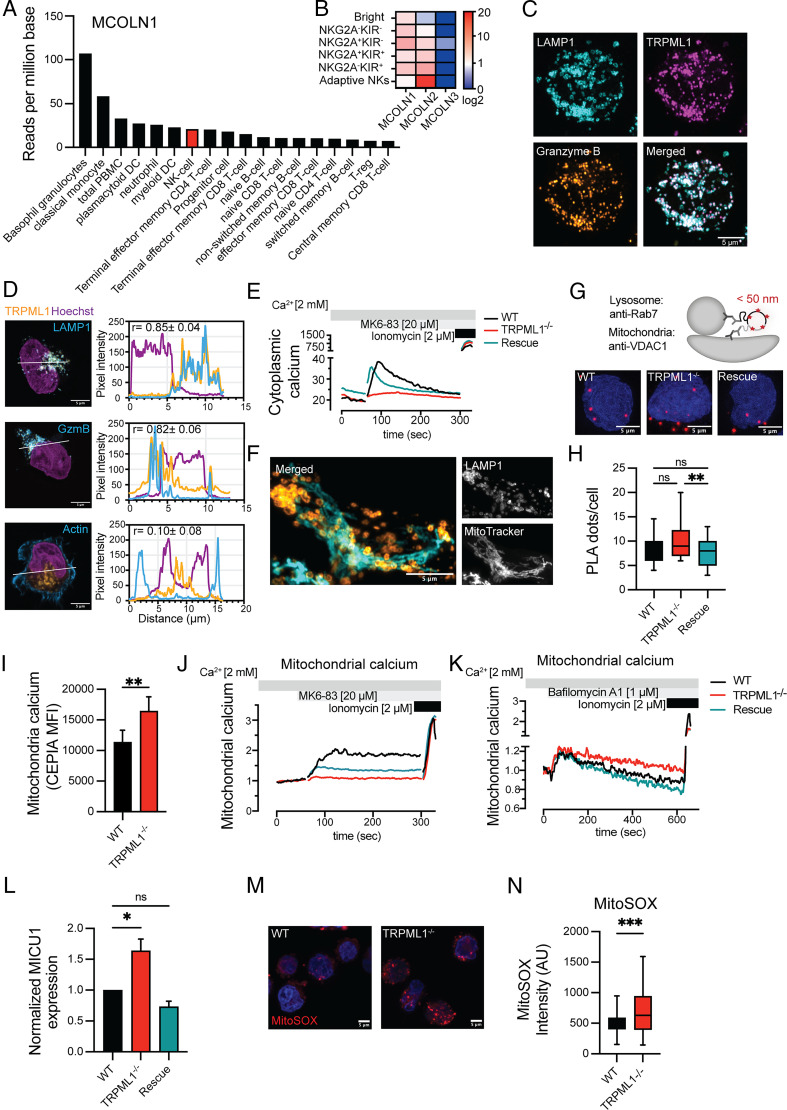
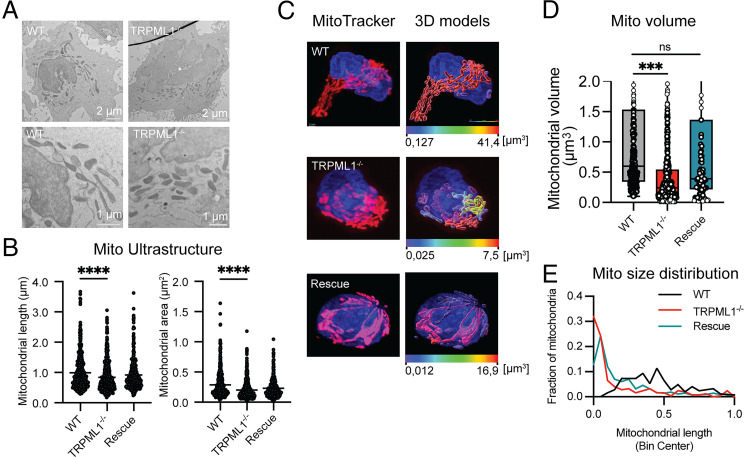
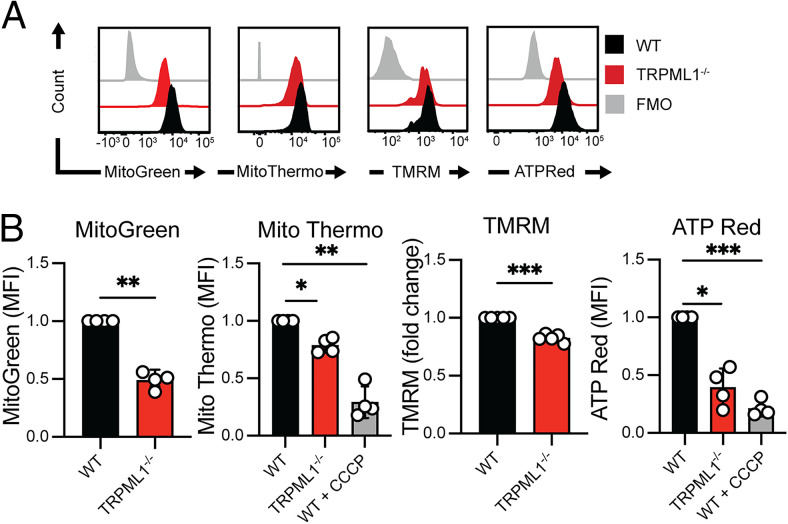
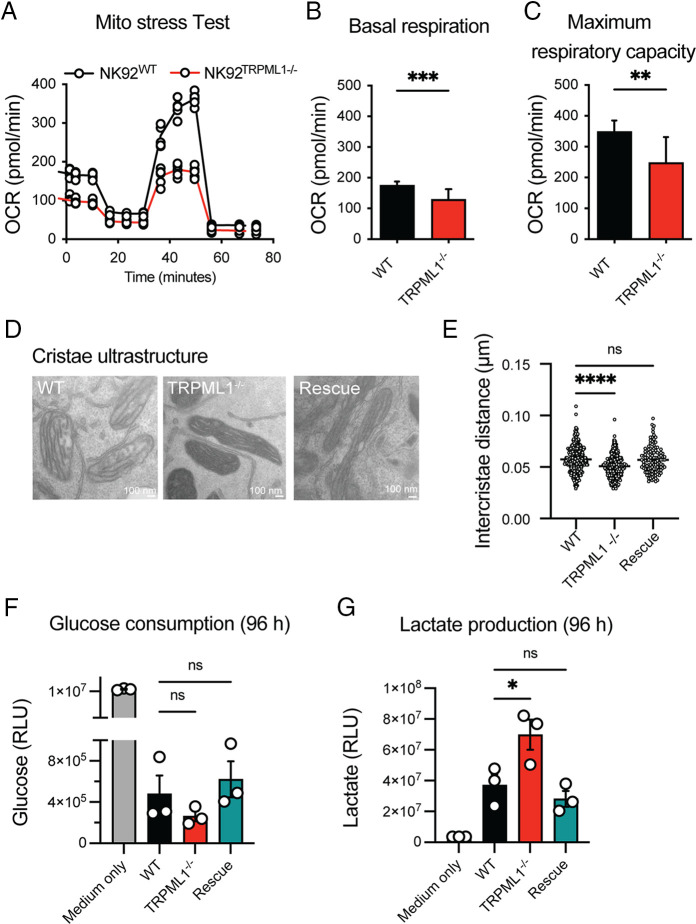
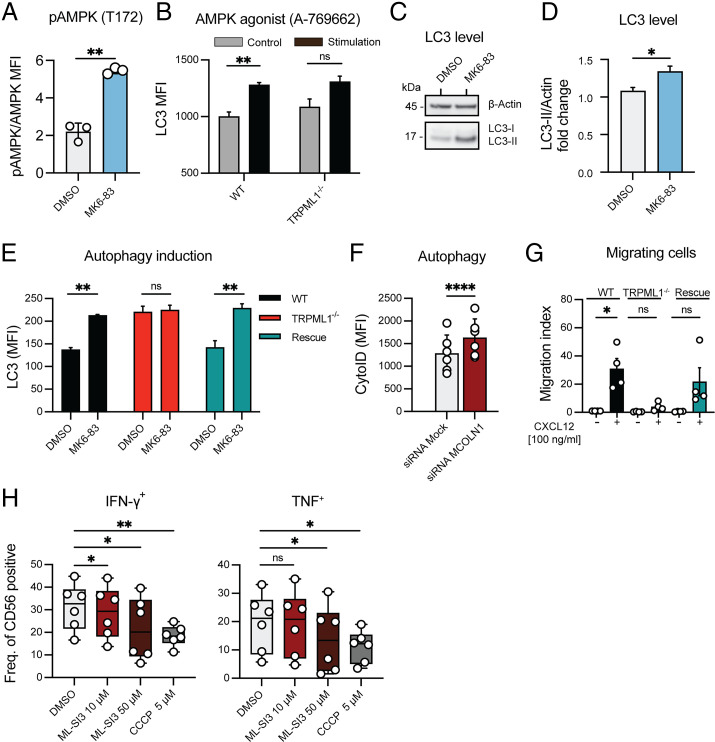
Cytotoxic lymphocytes eliminate cancer cells through the release of lytic granules, a specialized form of secretory lysosomes. This compartment is part of the pleomorphic endolysosomal system and is distinguished by its highly dynamic Ca2+ signaling machinery. Several transient receptor potential (TRP) calcium channels play essential roles in endolysosomal Ca2+ signaling and ensure the proper function of these organelles. In this study, we examined the role of TRPML1 (TRP cation channel, mucolipin subfamily, member 1) in regulating the homeostasis of secretory lysosomes and their cross-talk with mitochondria in human NK cells. We found that genetic deletion of TRPML1, which localizes to lysosomes in NK cells, led to mitochondrial fragmentation with evidence of collapsed mitochondrial cristae. Consequently, TRPML1-/- NK92 (NK92ML1-/-) displayed loss of mitochondrial membrane potential, increased reactive oxygen species stress, reduced ATP production, and compromised respiratory capacity. Using sensitive organelle-specific probes, we observed that mitochondria in NK92ML1-/- cells exhibited evidence of Ca2+ overload. Moreover, pharmacological activation of the TRPML1 channel in primary NK cells resulted in upregulation of LC3-II, whereas genetic deletion impeded autophagic flux and increased accumulation of dysfunctional mitochondria. Thus, TRPML1 impacts autophagy and clearance of damaged mitochondria. Taken together, these results suggest that an intimate interorganelle communication in NK cells is orchestrated by the lysosomal Ca2+ channel TRPML1.


Conflict of interest statement

K.-J.M. is a consultant and has stock interests at Fate Therapeutics and Vycellix, is a member of the Scientific Advisory Board at Vycellix, and receives research support from Fate Therapeutics and Oncopeptides. The other authors have no financial conflicts of interest.

Figures

FIGURE 1.
FIGURE 1.
Disruption of TRPML1 leads to calcium overload and mitochondrial stress. (A) Normalized transcripts per million expression values of MCOLN1 gene expression across immune cells isolated from total PBMCs of healthy donors (from Human Protein Atlas) (68, 69). (B) Heatmap comparing TRPML channels (MCOLN1–3) mRNA expression levels from PBMCs of healthy blood donors (n = 10). Indicated NK cell subsets were sorted according to their maturation levels and sequenced using single-cell–tagged reverse transcription (https://rnaseq.malmberglab.com/) (26). (C) Subcellular localization of mCherry-tagged TRPML1 in NK92WT cells. Lysosomes were stained with anti-LAMP1 and anti-granzyme B Abs. White appearance reflects maximum overlap between the three proteins. Scale bar, 5 μm. (D) Representative deconvolved images with line profiles depicting the extent of colocalization of mCherry-TRPML1 (orange) with lysosomal markers LAMP1 and granzyme B or peripheral F-actin (cyan) in NK92WT cells quantified from 8 to 10 cells each from three independent sets (n = 24–30). Median value of Pearson coefficients with SD is displayed. Hoechst staining (purple) depicts the nucleus. Scale bars, 5 μm. (E) Representative line graph depicting calcium mobilization in NK92WT, NK92ML1−/−, and NK92rescue cells upon treatment with the TRPML1 agonist MK6-83 (20 µM), as measured by Indo-1 intensity via flow cytometry. Ionomycin was added at the last 30 s to quantify the maximal Ca2+ flux. (F) AiryScan super-resolution imaging of NK92WT cells stained with mitochondrial marker MitoTracker Orange and anti-LAMP1 (lysosomal marker) depict physical association of most lysosomes with mitochondria. Scale bar, 5 μm. (G) Model and representative images of NK92WT, NK92ML1−/−, and NK92rescue cells depicting proximity ligation assay (PLA) to visualize the mitochondria–lysosome membrane contact sites (red) between lysosomes (Rab7) and mitochondria (VDAC1). DAPI (blue) served as a nuclear counterstain. Scale bars, 5 μm. (H) Quantitative analysis of PLA signals from the indicated cell lines analyzed from 38 to 47 cells of each cell line from two independent experiments. Whiskers show 5th to 95th percentile. Bars show the median values of PLA signals. (I) Flow cytometry–based quantification of the mitochondrial calcium sensor CEPIAmt fluorescence intensity in NK92WT and NK92TRPML1−/− cells at resting stage; n = 7 independent experiments. (J) Mitochondrial calcium flux in NK92 cells expressing the mitochondrial targeted calcium sensor CEPIAmt, triggered by the TRPML1-agonist MK6-83 (20 μM). Ionomycin (2 μM) was added as positive control during the last 30 s of recording to show maximum calcium response. Baseline was recorded for 60 s. Data are shown as fold change of fluorescence intensity at indicated time points normalized to corresponding intensity at the initial time point (Fx/F0). (K) Lysosomal calcium release was triggered by the TRPML1-independent vacuolar-type ATPase inhibitor bafilomycin A1 (1 μM) in NK92 cells. Mitochondrial calcium flux was recorded as in (J). Ionomycin acts as positive control at the end of the recording. (L) Western blot analysis of mitochondrial calcium uniporter 1 (MICU1) expression in NK92WT, NK92TRPML1−/−, and NK92rescue cells, normalized to β-actin levels. n = 3. (M) Representative confocal microscopy images of live cell imaging depicting NK92 cells stained with a mitochondrial ROS indicator (MitoSOX). DAPI (blue) was used as a nuclear counterstain. Scale bars, 5 μm. (N) Quantification of MitoSOX pixel intensity values (in arbitrary units [AU]) depicting mitochondrial ROS levels in NK92 cells, from 14 to 16 cells of each condition; n = 3 independent experiments. Data are presented as mean ± SEM. One-way ANOVA followed by a Welch multiple comparison test was performed in (H). An ordinary one-way ANOVA multi comparison test was performed in (K). A paired t test (J) and an unpaired t test with a Welch correction was used to compare the groups in graph (N). *p < 0.05, **p < 0.01, ***p < 0.001. ns, not significant.
FIGURE 2.
FIGURE 2.
CRISPR-mediated deletion of TRPML1 leads to mitochondrial fragmentation. (A) Representative electron micrographs depicting mitochondrial morphology of NK92WT, NK92ML1−/−, and NK92rescue cells. Scale bars, 2 μm for whole-cell images (top row) and 1 μm for magnified images (bottom row). (B) Quantification of mitochondrial length and area by the image analysis software Fiji; n = 319–544 cells. (C) Representative AiryScan super-resolution microscopy images of MitoTracker-stained NK92 cells depicting detailed mitochondrial morphology. Scale bar, 2 μm. Three-dimensional remodeling and volume rendering of the mitochondrial network was performed with the help of Imaris software (Bitplane). Mitochondrial volume statistics (μm3) are color encoded. (D) Quantitative analysis of the segmented mitochondrial volume (μm3) as determined by Imaris software from high-magnification, super-resolution single-cell images. Compiled data from at least 20 cells per condition from two independent experiments are shown. (E) Histogram showing the mitochondrial volume distribution across the dataset. Binned data are shown with relative frequency distribution. Compiled data from at least 20 cells per condition from two independent experiments are shown. Statistical analyses were performed using a Kruskal–Wallis test with a Dunn multiple comparison test (B) or one-way ANOVA for multiple comparisons (D). ***p < 0.001, ****p < 0.0001. ns, not significant.
FIGURE 3.
FIGURE 3.
TRPML1 deficiency affects mitochondrial fitness. (A and B) Fluorescence intensity histograms (A) and corresponding bar graphs (B) depicting fluorescence intensities of the mitochondrial mass–sensitive MitoTracker Green, mitochondrial temperature probe MitoThermo, mitochondrial membrane potential–sensitive MitoProbe TMRM, and mitochondrial ATP-sensitive dye ATP-Red in NK92WT (black), NK92TRPML1−/− (red), and fluorescence minus one (FMO, gray) control are shown. The mitochondrial decoupler CCCP (1 μM) was used as a negative control for ATP-Red and as a positive control for MitoThermo, whose fluorescence intensity correlates inversely with mitochondrial temperature; n = 3–4 independent experiments. Unpaired t tests were used to compare between NK92WT and NK92ML1−/− cells, and a one-way ANOVA was used to statistically compare the groups. *p < 0.05, **p < 0.01, ***p < 0.001.
FIGURE 4.
FIGURE 4.
Ultrastructural changes in mitochondria impact cellular metabolism of NK cells. (A) Oxygen consumption rate (OCR) during the mitochondrial stress test, depicting the basal respiration and maximal respiratory capacity of NK92WT and NK92ML1−/− cells. A pooled analysis of two independent experiments performed as three replicates in each experiment is shown. (B and C) Quantification of basal respiration rate and maximum respiratory capacity of NK92WT and NK92ML1−/− cells observed from their oxygen consumption rates as described in (A). (D) Representative electron micrographs of mitochondrial ultrastructure from NK92WT and NK92ML1−/−, NK92rescue cells. Scale bars, 100 nm. (E) Quantification of the mitochondrial cristae density in resting NK92 cells as depicted in (D). Pooled analysis of 117–442 mitochondria from 18–22 cells from two independent experiments were analyzed. (F and G) Glucose consumption and lactate production of respective NK92 cell lines measured in the cell culture supernatants after 96 h of cell growth. Bioluminescence values (relative light unites [RLU]) corresponding to the glucose (D) or lactate concentrations (E) are shown in the graphs. Data were derived from three independent experiments. Cell culture medium without cells was used as the baseline in the assay. Statistical analysis was performed using a Welch t test (B and C) and Kruskal–Wallis test with a Dunn multiple comparison test (E) and one-way ANOVA to compare the groups (F and G). *p < 0.05, **p < 0.01, ***p < 0.001, ****p < 0.0001. ns, not significant.
FIGURE 5.
FIGURE 5.
TRPML1 deficiency impairs autophagy, lysosomal arming, and migration of NK cells. (A) Relative AMPK phosphorylation of primary NK cells following 5-min stimulation with the TRPML1 agonist MK6-83 (20 μM). Data are shown as the p-AMPK (mean fluorescence intensity [MFI])/AMPK (MFI) ratio. Pooled analysis of is from n = 3 donors. (B) Autophagy induction measured by flow cytometry–based evaluation of membrane-bound LC3 in NK92 cells following treatment with the AMPK agonist A-769662 (300 μM). Data represent three independent biological replicates. (C) Representative immunoblot of the autophagy markers LC3-I and LC3-II in NK92WT cells. Actin was used as a loading control. (D) Immunoblot quantification of LC3 levels (fold change) following stimulation with DMSO or MK6-83 (10 μM) for 3 h in NK92 cells. Three independent experiments were analyzed. (E) Autophagy induction measured by flow cytometry–based evaluation of membrane-bound LC3 in NK92 cells following treatment with the TRPML1 agonist MK6-83. Data represent three independent biological replicates. (F) Comparative analysis of baseline levels of autophagic vacuoles, as determined by flow cytometry of CYTO-ID autophagy detection kit–stained primary NK cells transfected with mock small interfering RNA (siRNA) as control or siRNA targeting MCOLN1. Data are shown from six donors. (G) Transwell migration assay of NK92 cells. Cells were either left unstimulated or migrated toward a gradient of the chemokine CXCL12 (100 ng/ml) for 1 h. Each dot represents an independent experiment. Data are presented as mean ± SEM of quadruplicates. (H) Intracellular cytokine responses of primary NK cells challenged with K562 cells (6-h coculture) in the presence of a TRPML1 antagonist (ML-SI3) in the indicated concentrations. CCCP was used to compromise mitochondrial function. Data are shown from six donors. Paired t tests were performed in graphs (A–G) and a one-way ANOVA followed by a Dunnett post hoc test was used for (H). *p < 0.05, **p < 0.01, ****p < 0.0001. ns, not significant.

Similar articles

Cited by

References

    1. Gallo, E. M., Canté-Barrett K., Crabtree G. R.. 2006. Lymphocyte calcium signaling from membrane to nucleus. Nat. Immunol. 7: 25–32. - PubMed
    1. Berridge, M. J., Lipp P., Bootman M. D.. 2000. The versatility and universality of calcium signalling. Nat. Rev. Mol. Cell Biol. 1: 11–21. - PubMed
    1. Raffaello, A., Mammucari C., Gherardi G., Rizzuto R.. 2016. Calcium at the center of cell signaling: interplay between endoplasmic reticulum, mitochondria, and lysosomes. Trends Biochem. Sci. 41: 1035–1049. - PMC - PubMed
    1. Davis, L. C., Morgan A. J., Galione A.. 2022. Acidic Ca2+ stores and immune-cell function. Cell Calcium 101: 102516. - PubMed
    1. López-Sanjurjo, C. I., Tovey S. C., Prole D. L., Taylor C. W.. 2013. Lysosomes shape Ins(1,4,5)P3-evoked Ca2+ signals by selectively sequestering Ca2+ released from the endoplasmic reticulum. J. Cell Sci. 126: 289–300. - PMC - PubMed

Publication types

MeSH terms