. 2023 Nov 30;35(12):4383-4404.
doi: 10.1093/plcell/koad244.

Gibberellin signaling regulates lignin biosynthesis to modulate rice seed shattering

Affiliations

Gibberellin signaling regulates lignin biosynthesis to modulate rice seed shattering

Hao Wu et al. Plant Cell. .

Abstract

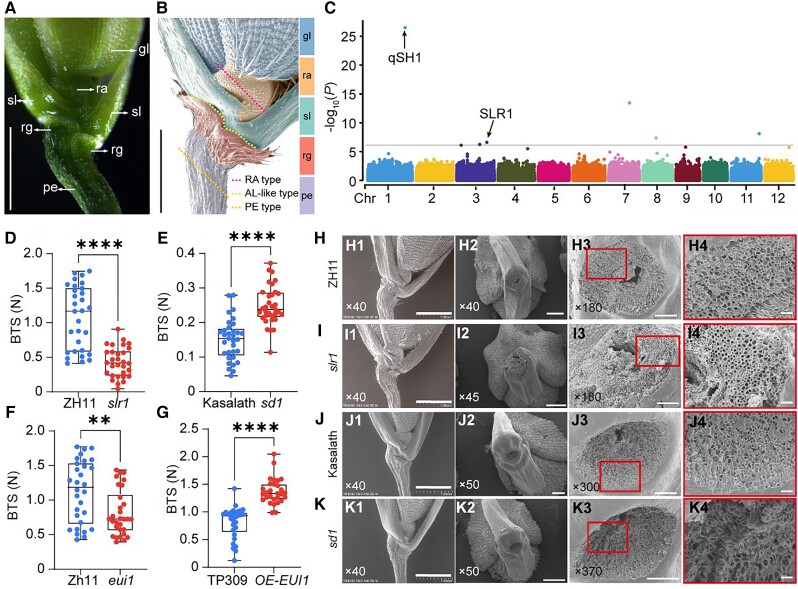
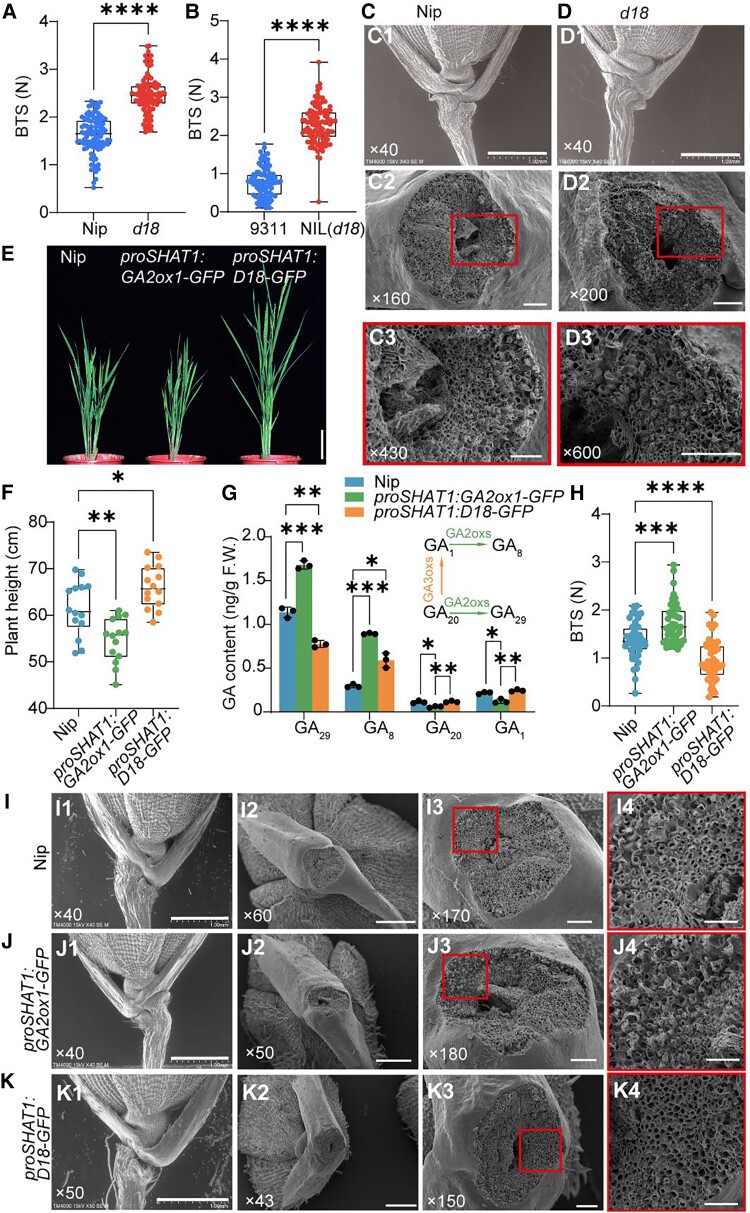
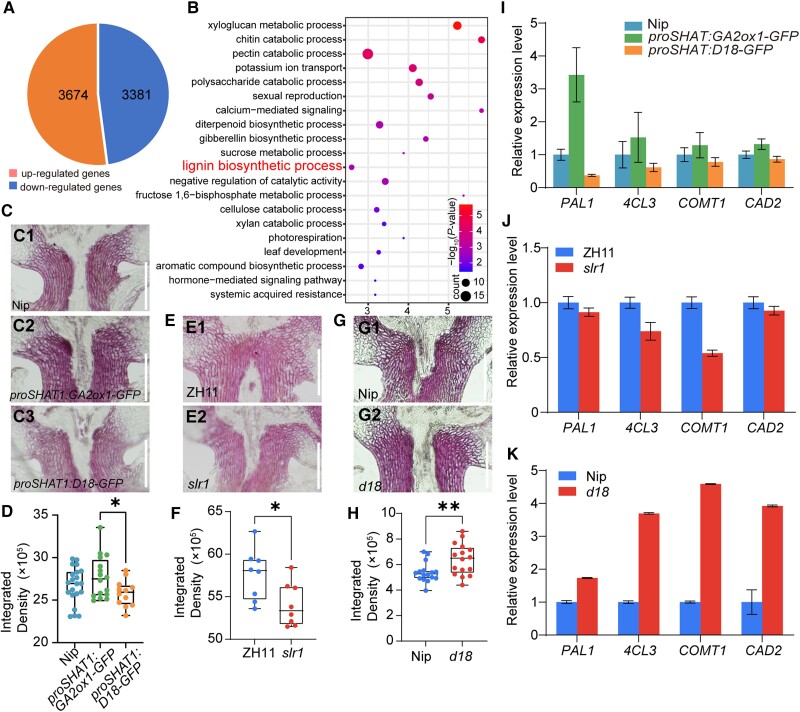
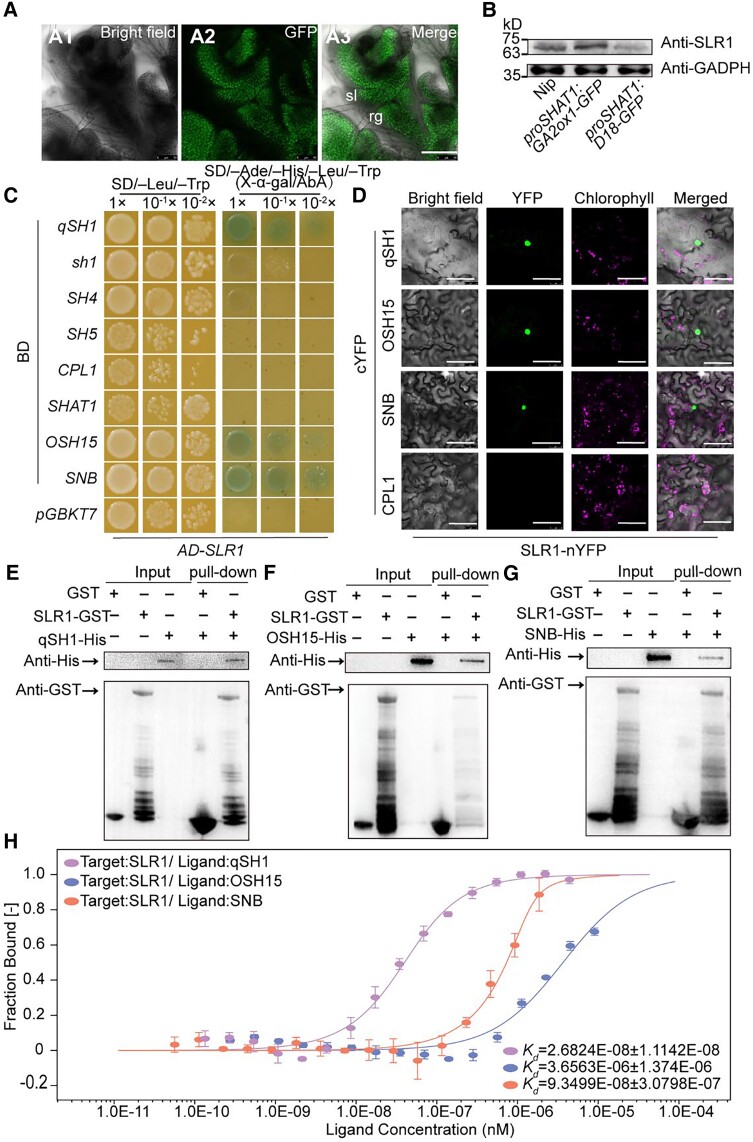
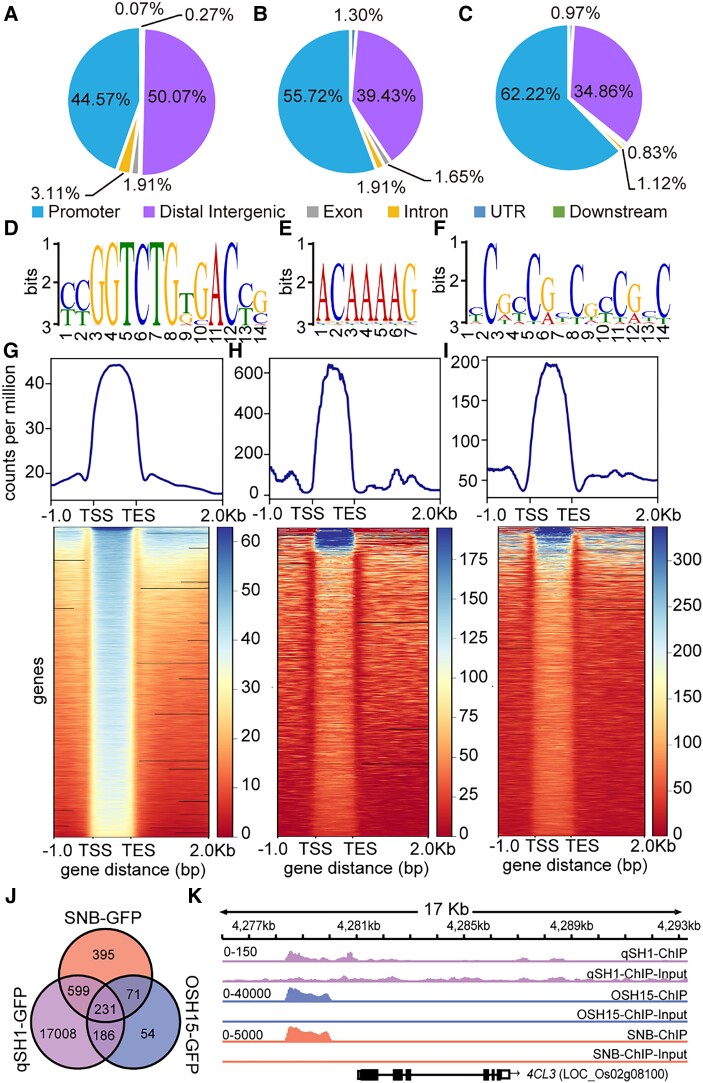
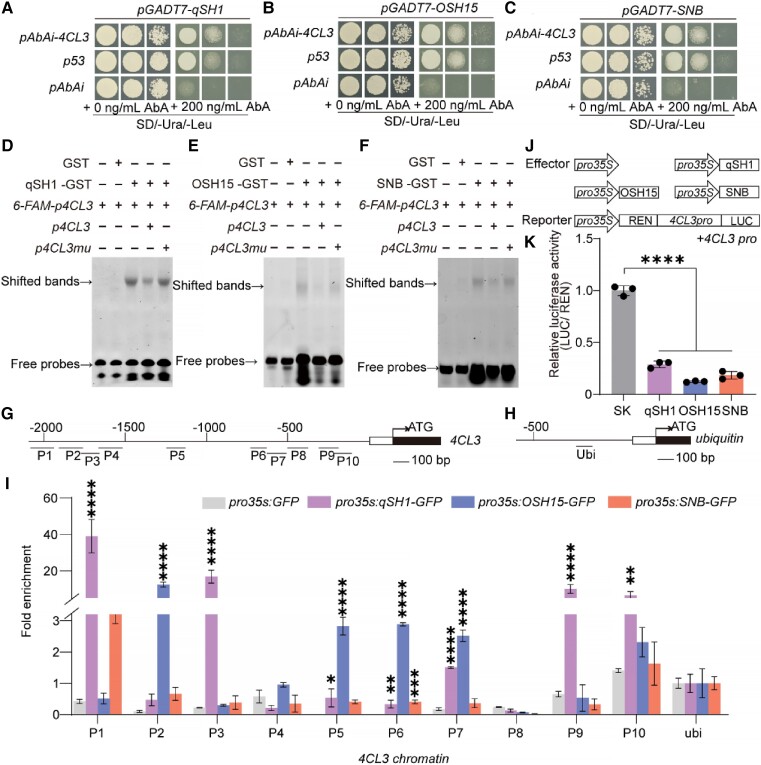
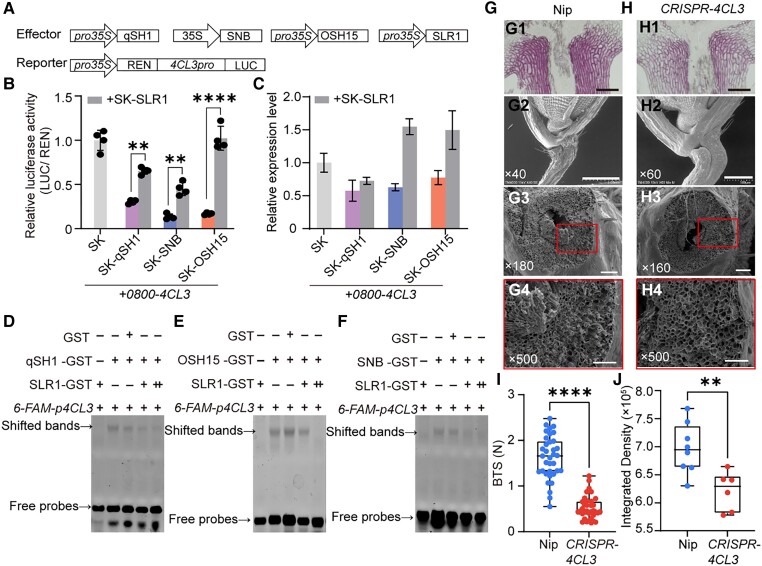
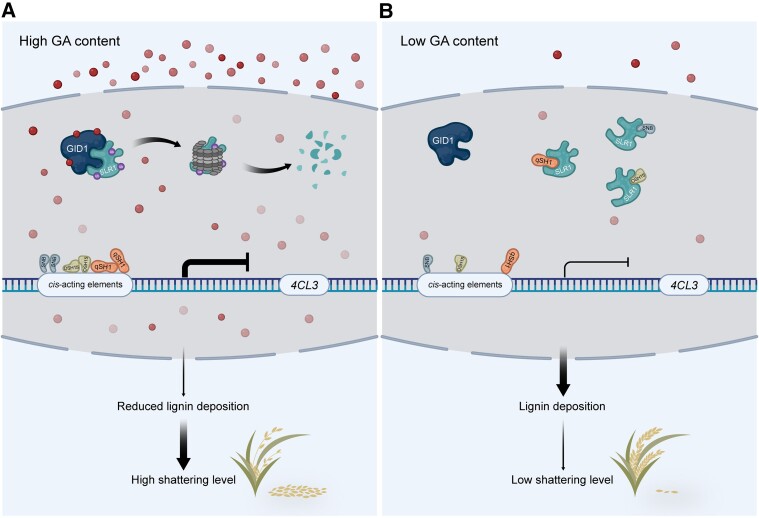
The elimination of seed shattering was a key step in rice (Oryza sativa) domestication. In this paper, we show that increasing the gibberellic acid (GA) content or response in the abscission region enhanced seed shattering in rice. We demonstrate that SLENDER RICE1 (SLR1), the key repressor of GA signaling, could physically interact with the rice seed shattering-related transcription factors quantitative trait locus of seed shattering on chromosome 1 (qSH1), O. sativa HOMEOBOX 15 (OSH15), and SUPERNUMERARY BRACT (SNB). Importantly, these physical interactions interfered with the direct binding of these three regulators to the lignin biosynthesis gene 4-COUMARATE: COENZYME A LIGASE 3 (4CL3), thereby derepressing its expression. Derepression of 4CL3 led to increased lignin deposition in the abscission region, causing reduced rice seed shattering. Importantly, we also show that modulating GA content could alter the degree of seed shattering to increase harvest efficiency. Our results reveal that the "Green Revolution" phytohormone GA is important for regulating rice seed shattering, and we provide an applicable breeding strategy for high-efficiency rice harvesting.


Conflict of interest statement

Conflict of interest statement. The authors declare no competing interests.

Figures

Figure 1.
Figure 1.
Gibberellin contributed to rice seed-shattering regulation. A) and B) Structure diagram of rice spikelet base. Photographs A) and B) were taken by stereo microscope and SEM separately. The dashed line in B) represents three types of breaks positions in Nip. Bars = 1 mm. C) Manhattan plot demonstrating −log10 (P-values) from a genome-wide scan plotted against the position on each of the 12 chromosomes (Chr). Known genes within the 200 kb regions flanked with the associated SNPs are indicated by arrows. D to G) BTS of gibberellin (GA)-related mutants and an overexpression line. Boxplots of BTS comparing ZH11 and slr1D), Kasalath and sd1E), ZH11 and eui1F), and TP309 and EUI1 overexpression line G). Data are displayed as box and whisker plots with individual data points. Horizontal bars represent the maximum, third quantile, median, first quantile, and minimum values, respectively. **P-value ≤0.01 and ****P-value ≤0.0001 calculated from a two-tailed t-test. H to K) Characterization of rice spikelet in slr1I), sd1K), and the corresponding wild-type ZH11 H) and Kasalath J). H1) to K1) The SEM photographs of the spikelet basal part. H2) to K2) The SEM photographs of the broken area on mature seeds. H3) to K3) Close-up SEM photographs of the fracture surface corresponding to H2) to K2) separately. H4) to K4) are magnifications of the red boxes in H3) to K3), respectively. The numbers in the bottom left corner of the photos indicated the magnification. Bars = 1 mm in panels (1), 500 μm in panels (2), 100 μm in panel (3), and 20 μm in panel (4). gl, glume (blue); ra, rachillag (orange); sl, sterile lemma (green); rg, rudimentary glume (red); pe, pedicel (purple).
Figure 2.
Figure 2.
GA content alteration in abscission region influenced seed-shattering degree in Nipponbare. A) and B) Boxplots of BTS comparing Nipponbare (Nip) and d18 mutant in Nip A) and 9311 background B). C) and D) Characterization of rice spikelet in Nip C) and d18D). C1) to D1) The SEM photographs of the spikelet basal part. C2) to D2) The SEM photographs of the fracture surface. C3) to D3) are magnifications of the red boxes in C2) to D2), respectively. Bars = 1 mm in panels (1), 100 μm in panels (2), 50 μm in panel (3). The numbers in the bottom left corner of the photos indicated the magnification. E) Appearance of the proSHAT1:GA2ox1-GFP, proSHAT1:D18-GFP transgenic lines, and the wild-type Nip plants. Bar = 10 cm. F) The plant height of wild-type and transgenic lines. G) Endogenous GA levels in young fluorescence as described above. The upper right corner diagram indicated the partial gibberellin metabolism pathway involved in GA3oxs and GA2oxs. The data are the mean ± Sd of 3 biological repeats. H) Boxplots of BTS comparing Nip, proSHAT1:D18-GFP, and proSHAT1:GA2ox1-GFP. Data in A), B), F), and H) are displayed as box and whisker plots with individual data points. Horizontal bars represent the maximum, third quantile, median, first quantile, and minimum values respectively. *P-value ≤0.05, **P-value ≤0.01,***P-value ≤0.001, and ****P-value ≤0.0001 calculated from two-tailed t-test A) and B) and one-way ANOVA test F) to H). The data are the mean ± Sd. I) to K) Morphological characteristics of abscission regions. The 3 rows from top to bottom represent morphological analyses of the Nip I), proSHAT1:GA2ox1-GFPJ), and proSHAT1:D18-GFPK), respectively. I1) to K1) The SEM photographs of the spikelet basal part. I2) to K2) The SEM photographs of the broken area on mature seeds. I3) to K3) Close-up SEM photographs of the fracture surface corresponding to I2) to K2). I4) to K4) are magnifications of the red boxes in I3) to K3), respectively. The numbers in the bottom left corner of the photos indicated the magnification. Bars = 1 mm in panels (1), 500 μm in panels (2), 100 μm in panel (3), and 50 μm in panel (4). F.W., fresh weight.
Figure 3.
Figure 3.
GA affects seed shattering by altering the lignin content in the abscission region. A) DEGs detected by RNA-seq in inflorescence meristem of proSHAT1:D18-GFP lines with 3 biological replicates (P < 0.05). B) BP enrichment analysis of DEGs. The letters in red indicate lignin biosynthetic progress. The X-axis represents the enrichment factor −log10 (P-value) ranging is from 1.45 to 5.70. The color and size of the dots represent the range of the P-value and the number of genes. C) to H) Analysis of lignin deposition. Longitudinal sections across the abscission region of Nip C1), proSHAT1:GA2ox1-GFPC2), proSHAT1:D18-GFPC3); ZH11 E1) and slr1E2); Nip G1) and d18G2). Sections were stained with phloroglucinol-HCl. Scale bars = 100 μm. D), F), and H) Quantitative results of lignin stained with phloroglucinol-HCl according to C), E), and G). Different sections were used to estimate the lignin content by Image J. Data in D), F), and H) are displayed as box and whisker plots with individual data points. Horizontal bars represent the maximum, third quantile, median, first quantile, and minimum values respectively. *P-value ≤0.05 and **P-value ≤0.01, calculated from a two-tailed t-test F) and H) and one-way ANOVA test D). I) to K) Expression analysis of lignin biosynthesis genes in transgenic lines I), slr1J), d18K), and their corresponding wild-type as revealed by RT-qPCR. Ubiquitin was used as a loading control. The data are the mean ± Sd of 4 biological repeats.
Figure 4.
Figure 4.
SLR1 interacts with qSH1, OSH15, and SNB. A) GFP signals detected in Sp8 in proSLR1:SLR1-GFP. Bar = 100 μm. B) The levels of SLR1 protein in young panicles of Nip, proSHAT1:GA2ox1-GFP, and proSHAT1:D18-GFP. Proteins extracted from young panicles were subjected to immunoblot analysis using the anti-SLR1 antibody. The anti-GADPH antibody was used as the loading control. C) Yeast two-hybrid assay revealing the interaction of SLR with qSH1, OSH15, and SNB. CPL1 was used as a negative control. The transformed yeast cells were grown on minimal, synthetically defined (SD) medium: SD-Leu/-Trp and SD-Ade/-His/-Leu/-Trp/+AbA (aureobasidin A). Yeast growth is presented at three dilutions. pGADT7 (AD), pGBKT7 (BD). D) BiFC analysis of the interaction between SLR1 and qSH1, OSH15, and SNB in N. benthamiana. Merge indicates merged images of enhanced yellow fluorescent protein. In each experiment, at least five independent N. benthamiana leaves were infiltrated and evaluated. Bars = 50 μm. E) to G) Pull-down assay demonstrating the interaction between SLR1 interacts with qSH1 E), OSH15 F), and SNB G). H) Determination of the binding affinity of SLR1 to qSH1-GST, OSH15-GST, and SNB-GST by MST. The curve is fit by the standard Kd-fit function. Kd, dissociation constant. Bars represent ± Sd (n = 3 biological replicates). sl, sterile lemma; rg, rudimentary glume.
Figure 5.
Figure 5.
Chromatin profiling analysis of qSH1, OSH15, and SNB-regulated genes. A) to C) Peak distribution of each mark surrounding various genomic features in qSH1-GFP A), OSH15-GFP B), and SNB-GFP C) target genes. D) to F) DNA-sequence of the motif enriched in their binding sites and positional distribution of the YCGGTCTGTGACYG motif in qSH1 binding peaks D), ACAAAAG motif in OSH15 binding peaks E), and YCGCCGYCGYCGYC motif in SNB binding peaks F). G) to I) Genes marked by different combinations and positions of qSH1 G), OSH15 H), and SNB I). The normalized intensity of each mark in the surrounding genes was recorded for k-means clustering. J) Venn diagram showing the number of gene regions bound by qSH1, OSH15, and SNB, as detected by ChIP-seq. K) Genome-browser view of qSH1, OSH15, and SNB binding at 4CL3 loci. The number range in the top left corner of each genome indicated the data scale. TSS, transcriptional start site; TES, transcriptional end site.
Figure 6.
Figure 6.
4CL3 was a direct cotarget of qSH1, OSH15, and SNB. A) to C) Yeast one-hybrid assays testing the binding of qSH1 A), OSH15 B), and SNB C) to the 4CL3 promoter. D) to F) Electrophoresis mobility shift assay of qSH1 D), OSH15 E), SNB F), and 6-Fam-labeled probes containing different cis-acting elements in the 4CL3 promoter region. The upper and lower arrows indicate the shift bands and free probes, respectively. G) to I) ChIP-qPCR assays of 4CL3 using ChIP-DNA complexes isolated from 0 to 4 cm young panicles of the pro35S:qSH1-GFP, pro35S:OSH15-GFP, and pro35S:SNB-GFP transgenic plants. G) and H) The genomic structures of 4CL3 and ubiquitin, respectively. The numbers (P1 to P10) and ubi indicated the tested regions. I) The enrichment of the 4CL3 chromatin. For enrichment of qSH1, OSH15, and SNB-GFP on the indicated fragments was calculated as the ratio of anti-GFP IP to control beads immunoprecipitation of each independent replicate. Ubiquitin was used as a negative control. Values are mean ± Sd (n = 3 pooled tissues, 10 plants per pool). J) Schematic diagrams of the effector and reporter plasmids used in the transient assay. K) Relative LUC activity in N. benthamiana leaves cotransformed with the indicated reporter and effector plasmids. LUC (Firefly Luciferase), REN (Rellina Luciferase), and SK (pGreenII 62-SK). The LUC activity in control was set as “1.” Error bars indicate means ± Sd of 3 biological repeats. *P-value ≤0.05, **P-value ≤0.01, ***P-value ≤0.001, and ****P-value ≤0.0001 calculated from the two-way ANOVA test I) and one-way ANOVA test K).
Figure 7.
Figure 7.
Effect of SLR1-qSH1, OSH15, and SNB interaction on the qSH1, OSH15, and SNB-4CL3 signaling cascade. A) Schematic diagrams of the effector and reporter plasmids used in the transient assay in rice protoplasts. B) Luciferase activities in protoplasts con-transfected with the reporter and different combinations of effectors. The transactivation activity was monitored by assaying the luciferase activities. **P-value ≤0.01 and ****P-value ≤0.0001 calculated from a two-way ANOVA test. Error bars indicate ± Sd (n = 4). C) RT-qPCR examination of the transcripts of 4CL3 in rice protoplasts expression of the different combinations of effectors shown in A). Actin1 was used as an internal control. Error bars indicate the SD of three biological repeats. The plasmids combination represented by purple, blue and orange columns are the same as in Fig. 6K. D) to F) EMSA showing that SLR1 attenuates or inhibits the binding of qSH1 D), OSH15 E), and SNB F) to the 4CL3 promoter. A gradient concentration of SLR1-GST was applied (+, 1.0 μg; ++, 2.0 μg). G) and H) Characterization of rice spikelet in Nip G), CRISPR-4CL3H). G1) and H1) Longitudinal sections across the abscission region of Nip G1) and CRISPR-4CL3H1). Sections were stained with phloroglucinol-HCl. G2) and H2) SEM photographs of the spikelet basal part. G3) to H3) The SEM photographs of the fracture surface. G4) to H4) are magnifications of the red boxes in G3) to H3), respectively. Bars = 100 μm in panels (1) and (3), 1 mm in (G2), 500 μm in H2) and 50 μm in panels (4). The numbers in the bottom left corner of the photos indicated the magnification. I) Boxplots of BTS comparing Nip and CRISPR-4CL3 line. J) Quantitative results of lignin stained with phloroglucinol-HCl according to G1) and H1). Data in I) and J) are displayed as box and whisker plots with individual data points. Horizontal bars represent the maximum, third quantile, median, first quantile, and minimum values, respectively. ****P-value ≤0.0001 and **P-value ≤0.01 calculated from a two-tailed t-test.
Figure 8.
Figure 8.
Proposed working model of the role of SLR1. SLR1 interacts with abscission genes qSH1, OSH15, and SNB to repress their DNA binding activity. In the presence of GA, GA triggers the degradation of SLR1 and frees the three abscission genes to deactivate the expression of common downstream lignin biosynthesis gene, 4CL3, which consequently decreases lignin content in the abscission region, leading to an easy shattering phenotype in the rice (Fig. 8A). When endogenous GA content is low, undegraded SLR1 protein interacts with qSH1, OSH15 and SNB, which prevents them from binding to the 4CL3 promoter. Lignin can be deposited on abscission region normally, exhibiting a low shattering level phenotype in rice (Fig. 8B). The red spheres represent gibberellin. The thickness of the lines with different arrow types represents the degree of effects. Flat head means inhibition and pointed head means activation.

Similar articles

Cited by

References

    1. Arnaud N, Girin T, Sorefan K, Fuentes S, Wood TA, Lawrenson T, Sablowski R, Ostergaard L. Gibberellins control fruit patterning in Arabidopsis thaliana. Genes Dev. 2010:24(19):2127–2132. 10.1101/gad.593410 - DOI - PMC - PubMed
    1. Bang SW, Choi S, Jin X, Jung SE, Choi JW, Seo JS, Kim J-K. Transcriptional activation of rice CINNAMOYL-CoA REDUCTASE 10 by OsNAC5, contributes to drought tolerance by modulating lignin accumulation in roots. Plant Biotechnol J. 2022:20(4):736–747. 10.1111/pbi.13752 - DOI - PMC - PubMed
    1. Bertolotti G, Unterholzner SJ, Scintu D, Salvi E, Svolacchia N, Di Mambro R, Ruta V, Linhares Scaglia F, Vittorioso P, Sabatini S, et al. . A PHABULOSA-controlled genetic pathway regulates ground tissue patterning in the Arabidopsis root. Curr Biol. 2021:31(2):420–426.e6. 10.1016/j.cub.2020.10.038 - DOI - PMC - PubMed
    1. Chen H, Zou Y, Shang Y, Lin H, Wang Y, Cai R, Tang X, Zhou J-M. Firefly luciferase complementation imaging assay for protein-protein interactions in plants. Plant Physiol. 2008:146(2):368–376. 10.1104/pp.107.111740 - DOI - PMC - PubMed
    1. Chen S, Zhou Y, Chen Y, Gu J. fastp: an ultra-fast all-in-one FASTQ preprocessor. Bioinformatics. 2018:34(17):i884–i890. 10.1093/bioinformatics/bty560 - DOI - PMC - PubMed