. 2023 Sep 22;9(38):eadh1655.
doi: 10.1126/sciadv.adh1655. Epub 2023 Sep 22.

Intranasal mRNA-LNP vaccination protects hamsters from SARS-CoV-2 infection

Affiliations

Intranasal mRNA-LNP vaccination protects hamsters from SARS-CoV-2 infection

Gabriela Baldeon Vaca et al. Sci Adv. .

Abstract

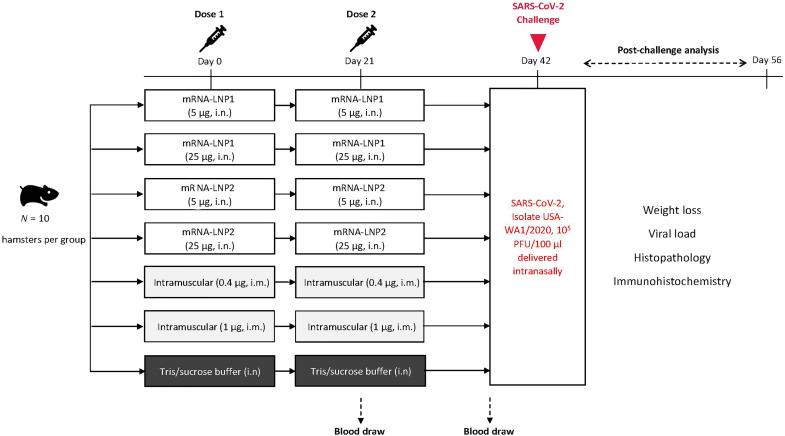
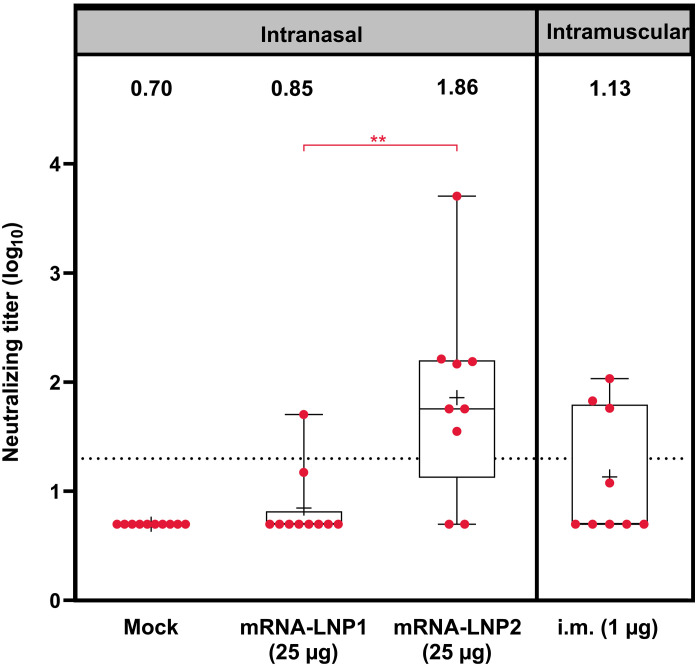
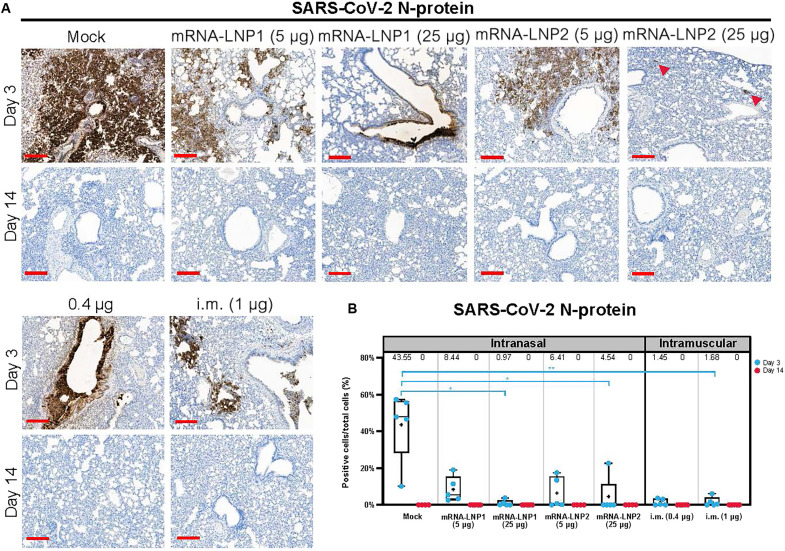
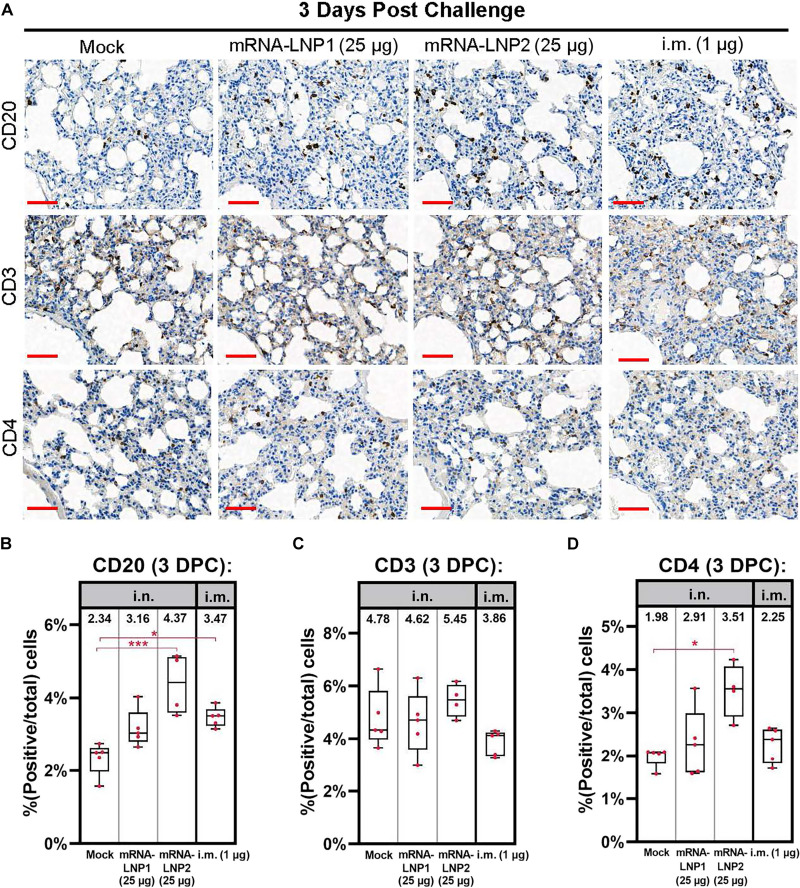
Intranasal vaccination represents a promising approach for preventing disease caused by respiratory pathogens by eliciting a mucosal immune response in the respiratory tract that may act as an early barrier to infection and transmission. This study investigated immunogenicity and protective efficacy of intranasally administered messenger RNA (mRNA)-lipid nanoparticle (LNP) encapsulated vaccines against severe acute respiratory syndrome coronavirus 2 (SARS-CoV-2) in Syrian golden hamsters. Intranasal mRNA-LNP vaccination systemically induced spike-specific binding [immunoglobulin G (IgG) and IgA] and neutralizing antibodies. Intranasally vaccinated hamsters also had decreased viral loads in the respiratory tract, reduced lung pathology, and prevented weight loss after SARS-CoV-2 challenge. Together, this study demonstrates successful immunogenicity and protection against respiratory viral infection by an intranasally administered mRNA-LNP vaccine.


Figures

Fig. 1.
Fig. 1.. Study design.
Intranasal vaccination of an mRNA-based SARS-CoV-2 vaccine was evaluated in Syrian golden hamsters. Hamsters (n = 10 per group) were intranasally immunized with two doses (days 0 and 21) of vaccines (5 or 25 μg) formulated in two different LNP compositions or were mock-vaccinated with two doses of tris/sucrose buffer administered intranasally; separate groups of animals were intramuscularly immunized with two doses of vaccine (0.4 or 1 μg). Sera were collected approximately 3 weeks after dose 1 (before dose 2 on day 21) and approximately 3 weeks after dose 2 (day 41). At day 42, hamsters were intranasally challenged with SARS-CoV-2 (2019-nCOV/USA-WA1/2020). Post-viral challenge assessments included viral load and histopathology [3 days (day 45) and 14 days (day 56) after challenge], immunohistochemistry (3 and 14 days after challenge), and body weight (daily after challenge). i.m, intramuscular; i.n, intranasal; PFU, plaque-forming units.
Fig. 2.
Fig. 2.. Serum immune responses against ancestral SARS-CoV-2 after intranasal vaccination.
(A) S-specific serum binding IgG, (B) S-specific serum binding IgA, and (C) serum neutralizing antibody reciprocal end-point titers (log scale) against ancestral SARS-CoV-2 at 3 weeks after dose 1 (day 21) or 3 weeks after dose 2 (day 41) are shown by vaccine group. Animal-level data are shown as dots (n = 9 to 10 animals per group), with boxes and horizontal bars denoting the interquartile range (IQR) and median, respectively, and whiskers representing the maximum and minimum values. Geometric mean titers for each vaccine group are indicated by the plus (+) symbol of each boxplot, with the exact values shown above each vaccine group. Horizontal dotted lines represent the lower limit of detection (LLOD). Bayesian linear mixed model was used to model IgG, IgA, and neutralization titers. Holm’s method was used to adjust P values for multiple comparisons. *P < 0.05, **P < 0.01, ***P < 0.001, and ****P < 0.0001. Results of statistical comparisons between groups are shown in tables S1 to S3. ^ denotes antibodies that were under the limit of detection for all hamsters in the mRNA-LNP1 (5 μg) group after dose 1, which had a much lower antibody level compared to other groups. S2-P, S-protein with two proline mutations.
Fig. 3.
Fig. 3.. Serum neutralizing antibody titers against SARS-CoV-2 omicron B.1.1.529 after intranasal vaccination.
Serum neutralizing antibody titers (log scale) against SARS-CoV-2 omicron B.1.1.529 at 3 weeks after dose two are shown by vaccine group. Animal-level data are shown as dots (n = 9 to 10 animals per group), with boxes and horizontal bars denoting the IQR and median, respectively, and whiskers representing the maximum and minimum values. Mean titers for each vaccine group are indicated by the plus (+) symbol, and geometric mean titers are stated above each boxplot. Horizontal dotted lines represent the LLOD. Bayesian linear mixed model was used to model neutralization titers. Holm’s method was used to adjust P values for multiple comparisons. **P < 0.01.
Fig. 4.
Fig. 4.. Viral load and weight loss characteristics after SARS-CoV-2 challenge in vaccinated hamsters.
(A) Viral load (PFU per gram of tissue) in the lungs and (B) viral load in the nasal turbinates of mock-vaccinated and vaccinated hamsters at 3 and 14 days after SARS-CoV-2 challenge. Animal-level data are shown as dots (n = 5 animals per group), with gray lines representing the geometric mean titer for each group; exact values are shown above each vaccine group. Ordinary linear regression and statistical comparisons were only performed for viral loads at day 3 after challenge, as viral loads at day 14 were zero for all hamsters. Šidák’s method was used to adjust P values for multiple comparisons. *P < 0.05, **P < 0.01, ***P < 0.001, and ****P < 0.0001. Results of statistical comparisons between groups are shown in tables S4 to S5. (C) Mean percentage of weight change (error bars represent SEM) over 14 days after SARS-CoV-2 challenge in mock-vaccinated and vaccinated hamsters. SEM, standard error of the mean.
Fig. 5.
Fig. 5.. Pulmonary histopathological characteristics at 3 days after SARS-CoV-2 challenge in vaccinated hamsters.
Lung sections from hamsters at 3 days after SARS-CoV-2 challenge were stained with hematoxylin and eosin. Representative images are shown for mock-vaccinated, intranasally vaccinated (25 μg), or intramuscularly immunized (1 μg) hamsters. (A) Pulmonary parenchyma show moderate, interstitial infiltration by mixed inflammatory cells within alveolar walls, multifocal deposits of fibrin, and alveolar hemorrhage. (B) Airways including bronchi and bronchioles were frequently obstructed by high numbers of neutrophils in mock-vaccinated hamsters. Note the lack of this suppurative inflammation in vaccinated hamsters. (C) Vascular and perivascular mixed cell infiltrates were observed in medium to large-sized blood vessels. Note the decreased severity of vascular inflammation in vaccinated hamsters. Scale bars, 100 μm.
Fig. 6.
Fig. 6.. Immunohistochemistry for SARS-CoV-2 N-protein in lung after SARS-CoV-2 challenge.
Lung sections from hamsters necropsied at 3 and 14 days after SARS-CoV-2 challenge were stained with an antibody raised against the SARS-CoV-2 N-protein. (A) Representational images of lungs from mock-vaccinated, intranasally vaccinated [mRNA-LNP1 or mRNA-LNP2 (5 and 25 μg)], or intramuscularly vaccinated (0.4 and 1 μg) hamsters. Arrowheads designate areas of positive signal within tissue. (B) Quantification of N-protein+ cells by vaccine group. Animal-level data are shown as dots (n = 4 to 5 animals per group), with boxes and horizontal bars denoting the IQR and median, respectively, and whiskers representing the maximum and minimum values. Mean values are provided above each plot. Scale bars, 200 μm. N = 5 animals per group. Kruskal-Wallis nonparametric test was implemented for statistical analysis to accommodate for small sample sizes per group and subsequent small percentage of N-protein+ cells within vaccinated animals. *P < 0.05 and **P < 0.01. N protein, nucleocapsid protein.
Fig. 7.
Fig. 7.. Immunohistochemistry of lymphocyte immune cells at 3 days after SARS-CoV-2 challenge.
Lungs sections from hamsters necropsied at 3 days after SARS-CoV-2 challenge were stained for B cell marker CD20, general T cell marker CD3, and helper T cell marker CD4. (A) Representational images of hamster lung with two doses of tris/sucrose, mRNA-LNP1 (25 μg), mRNA-LNP2 (25 μg), or intramuscular composition (1 μg). Quantification of cells positive for (B) CD20, (C) CD3, and (D) CD4 in each of the above represented groups. Scale bars, 50 μm. Animal-level data are shown as dots (n = 4 to 5 animals per group), with boxes and horizontal bars denoting the IQR and median, respectively, and whiskers representing the maximum and minimum values. Means are stated above each boxplot. Kruskal-Wallis nonparametric test was implemented for statistical analysis to accommodate for small sample sizes per group. *P < 0.05, **P < 0.01, and ***P < 0.001. DPC, days post challenge.

References

    1. World Health Organization, The top 10 causes of death (2020); www.who.int/news-room/fact-sheets/detail/the-top-10-causes-of-death.
    1. World Health Organization, COVID-19 vaccine tracker and landscape (2022); www.who.int/publications/m/item/draft-landscape-of-covid-19-candidate-va....
    1. GBD 2016 Lower Respiratory Infections Collaborators , Estimates of the global, regional, and national morbidity, mortality, and aetiologies of lower respiratory infections in 195 countries, 1990-2016: A systematic analysis for the Global Burden of Disease Study 2016. Lancet Infect. Dis. 18, 1191–1210 (2018). - PMC - PubMed
    1. McCloskey B., Dar O., Zumla A., Heymann D. L., Emerging infectious diseases and pandemic potential: Status quo and reducing risk of global spread. Lancet Infect. Dis. 14, 1001–1010 (2014). - PMC - PubMed
    1. Centers for Disease Control and Prevention (CDC) , Ten great public health achievements--worldwide, 2001–2010. MMWR Morb. Mortal. Wkly Rep. 60, 814–818 (2011). - PubMed