. 2023 Sep 22;9(38):eadh3822.
doi: 10.1126/sciadv.adh3822. Epub 2023 Sep 22.

Genome-wide variation in the Angolan Namib Desert reveals unique pre-Bantu ancestry

Affiliations

Genome-wide variation in the Angolan Namib Desert reveals unique pre-Bantu ancestry

Sandra Oliveira et al. Sci Adv. .

Abstract

Ancient DNA studies reveal the genetic structure of Africa before the expansion of Bantu-speaking agriculturalists; however, the impact of now extinct hunter-gatherer and herder societies on the genetic makeup of present-day African groups remains elusive. Here, we uncover the genetic legacy of pre-Bantu populations from the Angolan Namib Desert, where we located small-scale groups associated with enigmatic forager traditions, as well as the last speakers of the Khoe-Kwadi family's Kwadi branch. By applying an ancestry decomposition approach to genome-wide data from these and other African populations, we reconstructed the fine-scale histories of contact emerging from the migration of Khoe-Kwadi-speaking pastoralists and identified a deeply divergent ancestry, which is exclusively shared between groups from the Angolan Namib and adjacent areas of Namibia. The unique genetic heritage of the Namib peoples shows how modern DNA research targeting understudied regions of high ethnolinguistic diversity can complement ancient DNA studies in probing the deep genetic structure of the African continent.


Figures

Fig. 1.
Fig. 1.. Population structure in southern Africa.
(A) Map showing approximate sample locations. The lightest background color shows the desert and xeric shrublands biome. All samples from Angola are marked with “(A)” in the legend, while samples from the same ethnic group collected in Namibia are marked with “(N).” (B and C) PCA of the populations shown in (A). Plots of PC1 versus PC2 (B) and PC1 versus PC3 (C), with the percentage of variance explained by each component indicated in parentheses. The centroids for each group from the Angolan Namib are shown by black dots. (D) ADMIXTURE analysis for k = 6 (k with the lowest cross-validation error) of an extended dataset of 63 African populations (fig. S3 and tables S1 and S2). The horizontal color bar below the ADMIXTURE barplot indicates the language group. CAR, Central African Rainforest.
Fig. 2.
Fig. 2.. IBD sharing in southern Africa.
(A) Violin plots showing the distribution of total IBD length (in centimorgans) shared within groups. The thick and thin black lines represent the interquartile range and the upper and lower adjacent values, respectively; the central dot shows the median. (B) Mean total IBD length for different length categories.
Fig. 3.
Fig. 3.. Chromopainter profiles for southwestern Angolan and northwestern Namibian groups.
Bantu-speaking agropastoralists (Ovimbundu, Nyaneka, and Ovambo) are included as donors, together with more distantly related African groups. (A) Chromopainter coancestry matrix. The color gradient indicates the average number of DNA chunks a recipient group (y axis) copies from the donor populations [x axis in (B)]. (B) Differences between the number of DNA chunks copied by each recipient group from the donor populations in the x axis, and the number of DNA chunks copied by the Kuvale—used here as a baseline. (C) Average distance (TVDxy) between copying profiles. (D) Multidimensional scaling calculated on the TVDxy distances. The stress value (0.0073) indicates low distortion of population relationships by the two-dimensional plot (75).
Fig. 4.
Fig. 4.. Ancestry proportions estimated with qpAdm in southern African populations.
SEs (black bars) were calculated with a weighted block jackknife. BP, before the present.
Fig. 5.
Fig. 5.. Summary of the ancestry-specific IBD sharing.
The pie charts represent the proportion of autochthonous southern African-related (i.e., neither Bantu- nor East African–related) (A) and Bantu-related (B) IBD shared on average between each target group and the pools of populations identified in the figure legend. The category “Unknown” represents southern African–related IBD shared with the peripatetic groups from the Angolan Namib. The percentage of southern African (A) and Bantu (B) ancestry within each target group is represented by the total area of the pie chart. (C) and (D) show a UPGMA clustering of all target groups according to their shared southern African– and Bantu-related IBD, respectively. Detailed results for every population pair are shown in fig. S20. Population abbreviations according to (C).
Fig. 6.
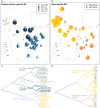
Fig. 6.. PCA of southern African–related ancestry.
(A) Map showing approximate sample locations. The lightest background color shows the desert and xeric shrublands biome. (B to D) PCA built with previously published southern African individuals (see references in table S2) that display <10% of missing data after masking the non–southern African ancestries (B), additionally including Angolan individuals (C), and other relevant modern (see references in table S2) or ancient groups (D) (16, 17). The axis labels include the eigenvalue (in parentheses) for each PC.

References

    1. A. Choudhury, D. Sengupta, M. Ramsay, C. Schlebusch, Bantu-speaker migration and admixture in southern Africa. Hum. Mol. Genet. 30, R56–R63 (2021). - PMC - PubMed
    1. J. K. Pickrell, N. Patterson, C. Barbieri, F. Berthold, L. Gerlach, T. Güldemann, B. Kure, S. W. Mpoloka, H. Nakagawa, C. Naumann, M. Lipson, P. R. Loh, J. Lachance, J. Mountain, C. D. Bustamante, B. Berger, S. A. Tishkoff, B. M. Henn, M. Stoneking, D. Reich, B. Pakendorf, The genetic prehistory of southern Africa. Nat. Commun. 3, 1143 (2012). - PMC - PubMed
    1. C. M. Schlebusch, P. Skoglund, P. Sjödin, L. M. Gattepaille, D. Hernandez, F. Jay, S. Li, M. De Jongh, A. Singleton, M. G. B. Blum, H. Soodyall, M. Jakobsson, Genomic variation in seven Khoe-San groups reveals adaptation and complex African history. Science 338, 374–379 (2012). - PMC - PubMed
    1. T. Güldemann, A linguist’s view: Khoe-Kwadi speakers as the earliest food-producers of southern Africa. Southern African Humanit. 20, 99–132 (2008).
    1. E. O. J. Westphal, The age of “Bushman” languages in southern African pre-history, in Bushman and Hottentot Linguistic Studies, J. W. Snyman, Ed. (University of South Africa, 1980), pp. 59–79.