. 2023 Sep 22;9(38):eadh1328.
doi: 10.1126/sciadv.adh1328. Epub 2023 Sep 22.

Brain-machine interface learning is facilitated by specific patterning of distributed cortical feedback

Affiliations

Brain-machine interface learning is facilitated by specific patterning of distributed cortical feedback

Aamir Abbasi et al. Sci Adv. .

Abstract

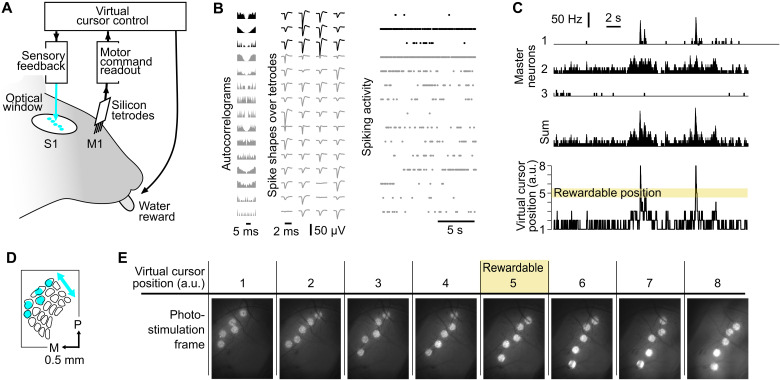
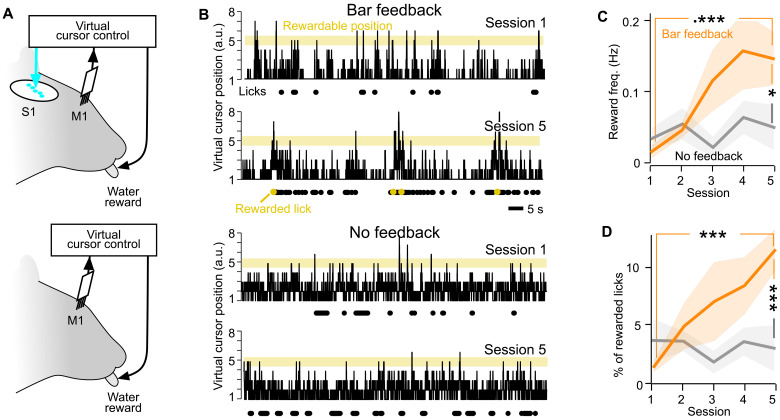
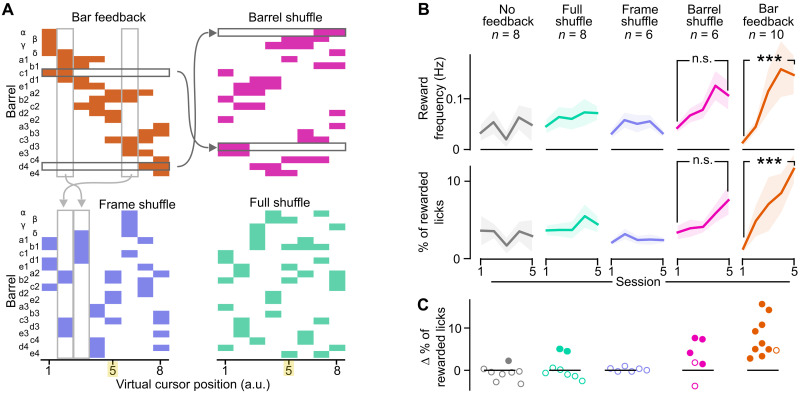
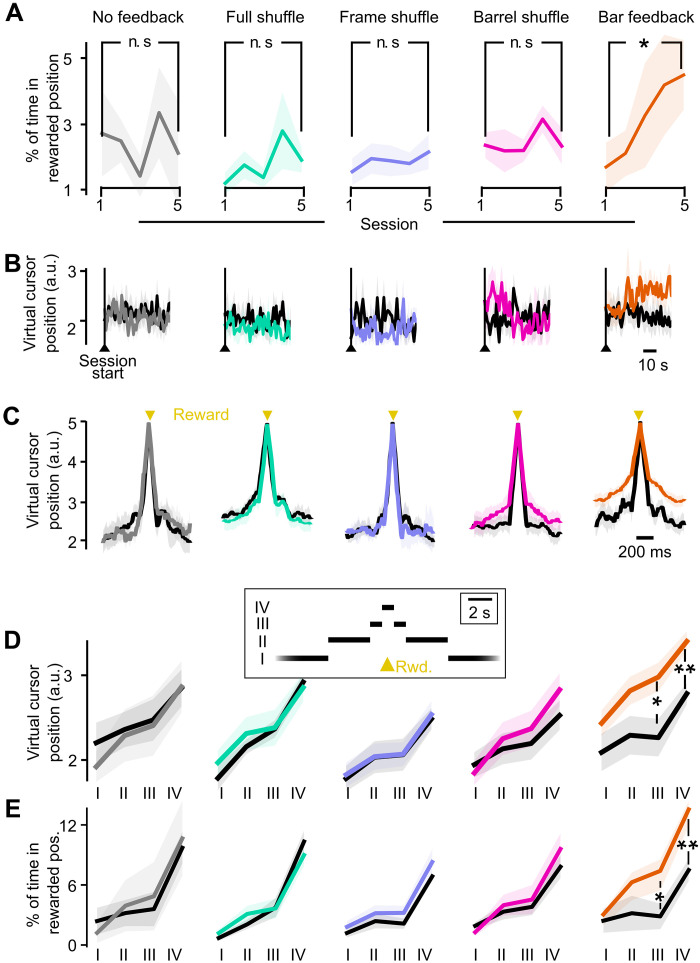
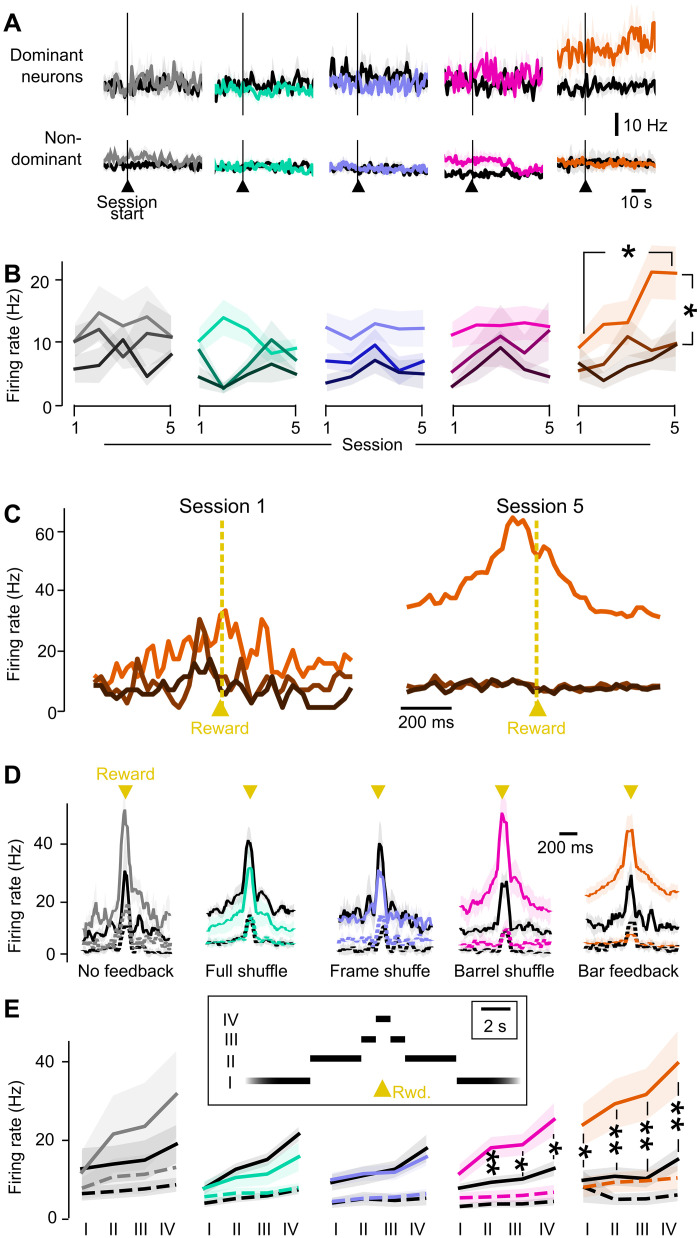
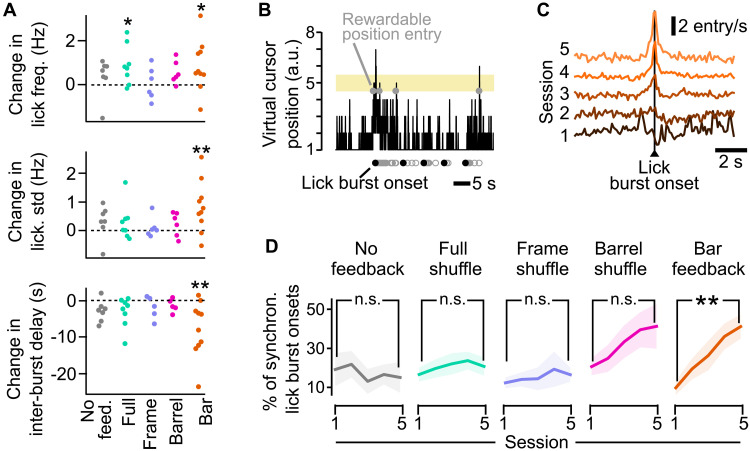
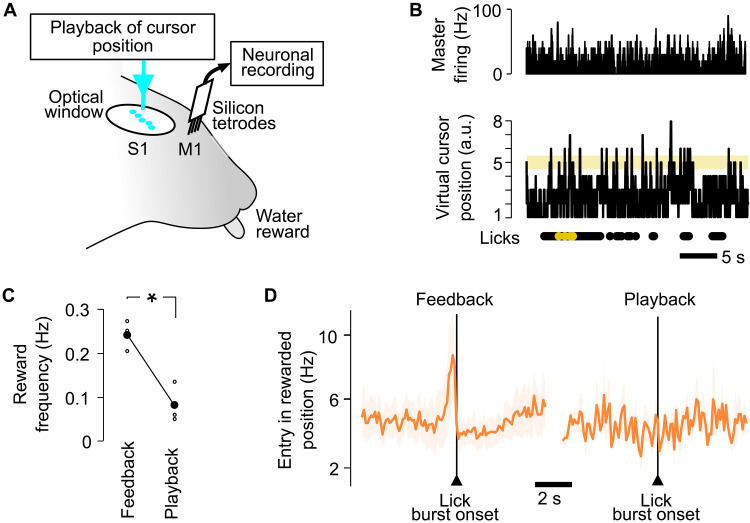
Neuroprosthetics offer great hope for motor-impaired patients. One obstacle is that fine motor control requires near-instantaneous, rich somatosensory feedback. Such distributed feedback may be recreated in a brain-machine interface using distributed artificial stimulation across the cortical surface. Here, we hypothesized that neuronal stimulation must be contiguous in its spatiotemporal dynamics to be efficiently integrated by sensorimotor circuits. Using a closed-loop brain-machine interface, we trained head-fixed mice to control a virtual cursor by modulating the activity of motor cortex neurons. We provided artificial feedback in real time with distributed optogenetic stimulation patterns in the primary somatosensory cortex. Mice developed a specific motor strategy and succeeded to learn the task only when the optogenetic feedback pattern was spatially and temporally contiguous while it moved across the topography of the somatosensory cortex. These results reveal spatiotemporal properties of the sensorimotor cortical integration that set constraints on the design of neuroprosthetics.


Figures

Fig. 1.
Fig. 1.. Mice controlled a virtual cursor using whisker M1 neuronal activity while online optogenetic feedback was delivered to whisker S1.
(A) General view of the closed-loop interface. The mice were head-fixed. A chronic silicon probe in M1 readout spiking activity and a chronic optical window over S1 allowed delivery of a photostimulation feedback. (B) Action potentials from 15 single units obtained during baseline activity in M1. The autocorrelograms (left), the spike shapes on the tetrodes (middle), and the spiking activity in time (right) are shown for each single unit. Black, Master neurons that are selected to control the virtual cursor; gray, neighboring neurons recorded simultaneously. (C) Example Master neuron activity and corresponding virtual cursor position. Top, time histograms of the three Master neuron activities; middle, sum of their activity; bottom, position of the virtual cursor computed from the summed activity of the Master neurons. The virtual cursor must be in position 5 for the mouse to obtain a reward by licking. a.u., arbitrary units. Bin size, 10 ms. (D) Schematic of the first photostimulation frame of the bar-like photoactivation on the map of S1 barrels. P, posterior; M, medial. (E) Snapshots of the cortical surface illustrating bar-like photostimulation frames for each virtual cursor position. Only when the virtual cursor was in position 5, licks were rewarded. Same scale as in (D).
Fig. 2.
Fig. 2.. Sensory feedback to the whisker part of S1 enhances task performance.
(A) Schematic of the Bar feedback and No feedback conditions. (B) Position of the virtual cursor computed from the merged activity of the Master neurons, in the first versus the fifth training session of one mouse, in the Bar feedback condition (top) and in the No feedback condition (bottom) (100 s displayed). Yellow background, rewardable position; black dots, lick times; yellow dots, rewarded lick times. (C) Performance quantified by the average frequency of rewards per session across training, comparing the Bar feedback condition (orange, 10 mice) and the No feedback condition (gray, 8 mice). Shaded backgrounds: ±SEM. *P < 0.05 and ***P < 0.001, nonparametric Mann-Whitney tests. (D) Same as (C) for the specificity of licking, quantified as the proportion of rewarded licks among all licks, across behavioral sessions.
Fig. 3.
Fig. 3.. Disrupting the spatiotemporal structure of the Bar feedback impairs learning.
(A) Spatial and temporal structure of the feedback across frames in the four tested conditions. Horizontal arrows, barrel identity permutation to generate the Barrel shuffle from the Bar feedback; vertical arrows, frame identity permutation to generate the Frame shuffle from the Bar feedback; yellow highlight, rewardable virtual cursor position. (B) Reward frequency (top) and percentage of rewarded licks (bottom) of the mice over five training sessions. ***P < 0.001, nonparametric Mann-Whitney tests. n.s., not significant. Shaded backgrounds: ±SEM. Bar feedback and No feedback data are the same as in Fig. 2. (C) Difference between the proportion of rewarded licks of the mice between the first versus fifth training session. Each point represents a mouse (arbitrary order). Filled point: bootstrap significance test, P < 0.05. Colors refer to the feedback conditions defined in (A).
Fig. 4.
Fig. 4.. Bar feedback enables the mice to actively control the virtual cursor position so that they spend more time in the rewardable position.
(A) Proportion of time spent in the rewardable virtual cursor position (position 5) over the whole session duration. (B) Average virtual cursor position at the onset of the session, in the first versus last training session. Vertical line: start of the session, which is also the start of the photostimulation. (C) Average virtual cursor trajectory, aligned to the reward times, in the five feedback conditions. Black, first session; colors, session 5. (D) Average virtual cursor position, in four time windows around reward: (I) more than 5 s away from any reward, (II) 1.5 to 5 s away, (III) 0.5 to 1.5 s away, and (IV) within 0.5 s of a reward. Mann-Whitney, *P < 0.05 and **P < 0.01. (E) Average percentage of time spent in the rewardable position, in the four time windows around reward defined in (D). For all panels: Light background: SEM across mice. Mann-Whitney, *P < 0.05 and **P < 0.01. Colors refer to the feedback conditions defined in Fig. 3.
Fig. 5.
Fig. 5.. Emergence of a dominant Master neuron in the Bar feedback condition.
(A) Firing rate at the onset of the session, for dominant (top) and nondominant (bottom) Master neurons in the first (black) versus last training session (colors). (B) Mean firing rate of the dominant and nondominant Master neurons. In (B) and (C), color saturation decreases from largest contributor to the firing rate at reward time (dominant Master neuron, bright color) to the second and third largest contributors (nondominant Master neurons, dark colors). Shaded backgrounds: ±SEM across mice. (C) Mouse case study of the time histogram of the activity of Master neurons around rewards, in the Bar feedback condition, sorted from the weakest (dark brown) to the dominant neuron (saturated orange) at the time of the reward, in the first (left) versus the fifth (right) training sessions. (D) Time histogram of the activity of Master neurons around rewards, in the five tested feedback conditions. Session 1 is shown in black, and session 5 is shown in saturated colors. Continuous line, dominant Master neuron; dashed line, average of nondominant neurons. (E) Average firing rate of dominant (continuous line) and nondominant (dashed line) Master neurons in the first (black) versus the last training session (colors), measured in the same time windows as in Fig. 5: (I) more than 5 s away from any reward, (II) 1.5 to 5 s away, (III) 0.5 to 1.5 s away, and (IV) within 0.5 s of a reward. For all panels: Shaded backgrounds: ±SEM across mice. Mann-Whitney, *P < 0.05; **P < 0.01. Colors refer to the feedback conditions defined in Fig. 3.
Fig. 6.
Fig. 6.. Evolution of licking with learning and emergence of a synchronization between licking and entries of the virtual cursor in the rewardable position.
(A) Evolution of the licking pattern between the first and fifth training session in the first 10 min of the task. On each graph, one point represents one mouse. Top, change in the licking frequency; middle, change in the SD of the licking frequency measured in 1-s bins; bottom, change in the delay between two bursts. Wilcoxon test, *P < 0.05 and **P < 0.01. (B) Example of the virtual cursor position as a function of time. Gray open circles, licks; black dots, onsets of lick bursts. Gray dots on virtual cursor position 5 indicate entries of the virtual cursor in the rewardable position. To avoid confusion, rewarded licks are not highlighted. (C) Population average time histograms of the number of entries of the virtual cursor in the rewardable position around all lick burst onsets, for the Bar feedback condition, across the five training sessions. Baseline levels were shifted upward for clarity. (D) Percentage of lick bursts that are synchronous (within ±100 ms) with entry of the virtual cursor in the rewardable position. Mann-Whitney, **P < 0.01. For all panels: Shaded backgrounds: ±SEM. Colors refer to the feedback conditions defined in Fig. 3.
Fig. 7.
Fig. 7.. Lick timing is not accurate in a playback condition.
(A) Playback configuration with chronic extracellular recording in M1 and Bar feedback optogenetic stimulation on barrels in S1. Previously acquired sequences of cursor positions are played back, independent from M1 firing rates. As in closed-loop sessions, reward delivery is contingent on synchronous (i) licking and (ii) presence of the virtual cursor in the rewardable position. (B) Top: Histogram of Master neuron activity during a playback session (30 s shown). Bottom: Time course of the virtual cursor position, disconnected from the Master firing. Below: Licks and rewarded licks during the same interval. Bin size, 10 ms. (C) Frequency of rewards during the last session with closed-loop Bar feedback (session 6 after the standard five training sessions; table S1) and the session with open-loop Bar playback that followed on the next day. Kruskal-Wallis, *P < 0.05. Gray background: SEM. n = 3 mice. (D) Histogram of lick burst onsets, with respect to the times of entry of the virtual cursor in the rewardable position around the onset of lick bursts, for the last session with closed-loop Bar feedback (left) versus the session with open-loop Bar playback (right), averaged for the three tested mice.

Similar articles

References

    1. Johansson R. S., Westling G., Roles of glabrous skin receptors and sensorimotor memory in automatic control of precision grip when lifting rougher or more slippery objects. Exp. Brain Res. 56, 550–564 (1984). - PubMed
    1. Monzée J., Lamarre Y., Smith A. M., The effects of digital anesthesia on force control using a precision grip. J. Neurophysiol. 89, 672–683 (2003). - PubMed
    1. Brochier T., Boudreau M.-J., Paré M., Smith A. M., The effects of muscimol inactivation of small regions of motor and somatosensory cortex on independent finger movements and force control in the precision grip. Exp. Brain Res. 128, 31–40 (1999). - PubMed
    1. Mathis M. W., Mathis A., Uchida N., Somatosensory cortex plays an essential role in forelimb motor adaptation in mice. Neuron 93, 1493–1503.e6 (2017). - PMC - PubMed
    1. Chesler A. T., Szczot M., Bharucha-Goebel D., Čeko M., Donkervoort S., Laubacher C., Hayes L. H., Alter K., Zampieri C., Stanley C., Innes A. M., Mah J. K., Grosmann C. M., Bradley N., Nguyen D., Foley A. R., Le Pichon C. E., Bönnemann C. G., The role of PIEZO2 in human mechanosensation. N. Engl. J. Med. 375, 1355–1364 (2016). - PMC - PubMed