

Comprehensive evaluation of methods for differential expression analysis of metatranscriptomics data
- PMID: 37738402
- PMCID: PMC10516371
- DOI: 10.1093/bib/bbad279
Comprehensive evaluation of methods for differential expression analysis of metatranscriptomics data
Abstract
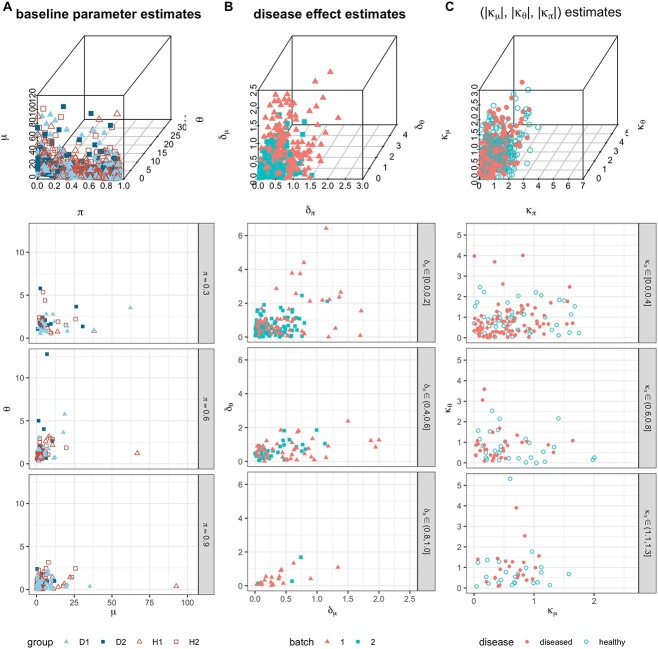
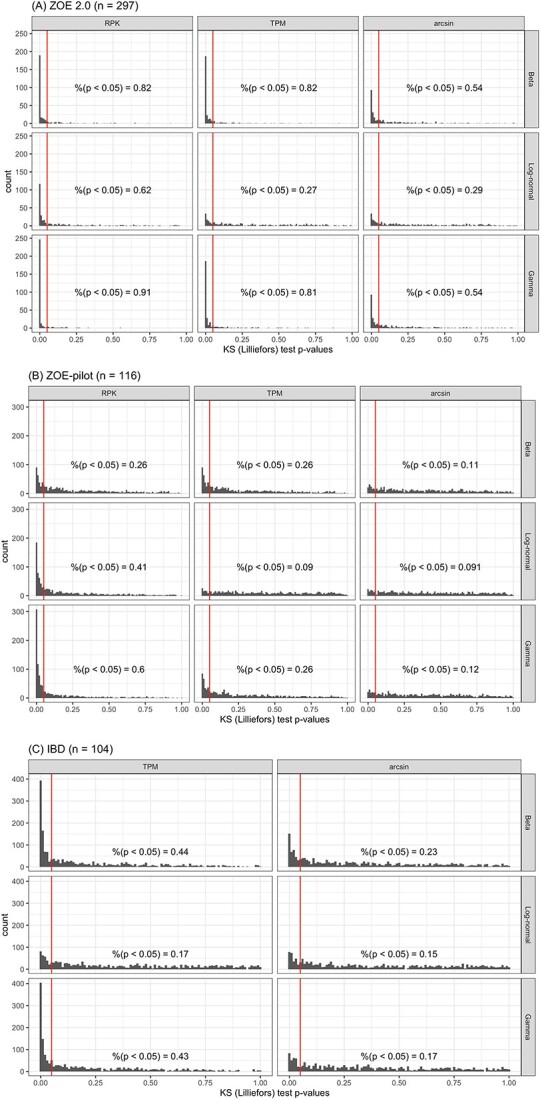
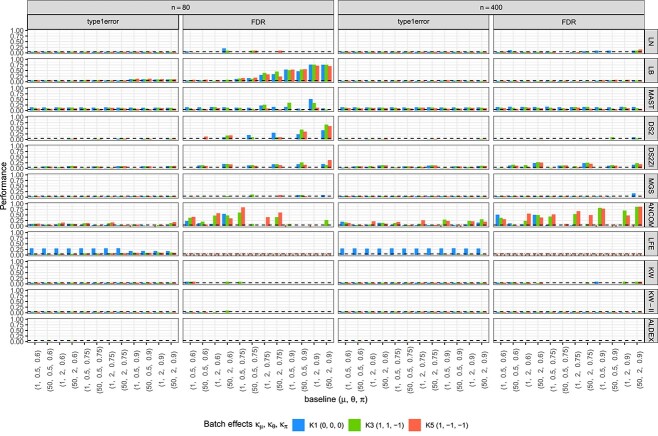
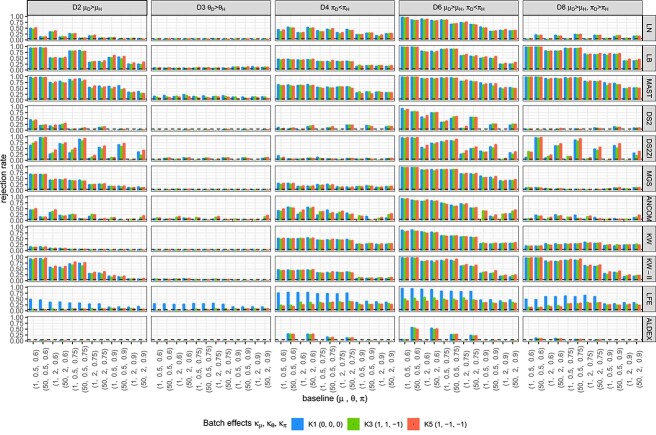
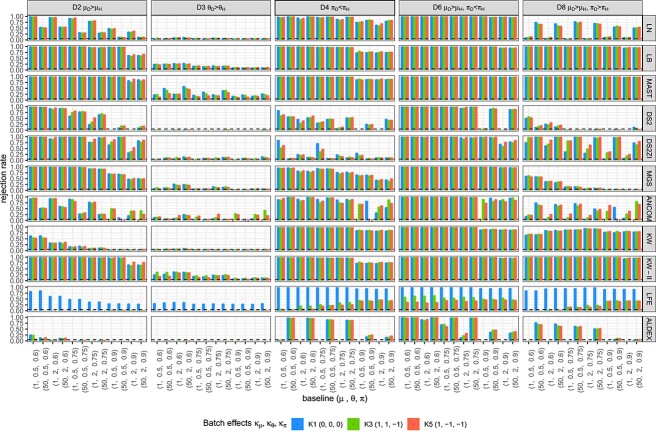
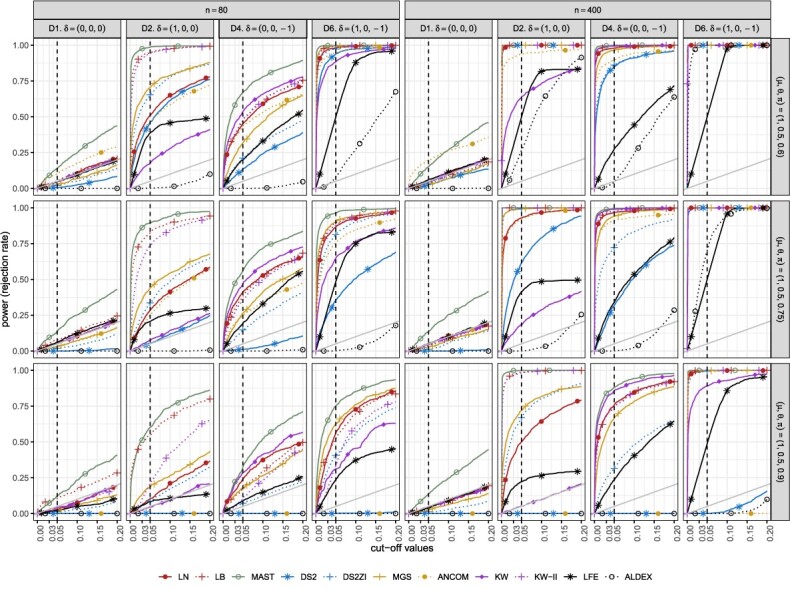
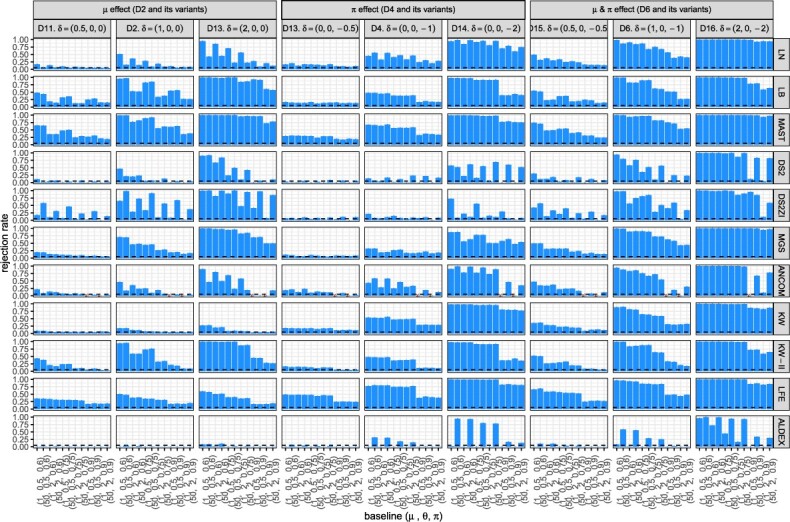
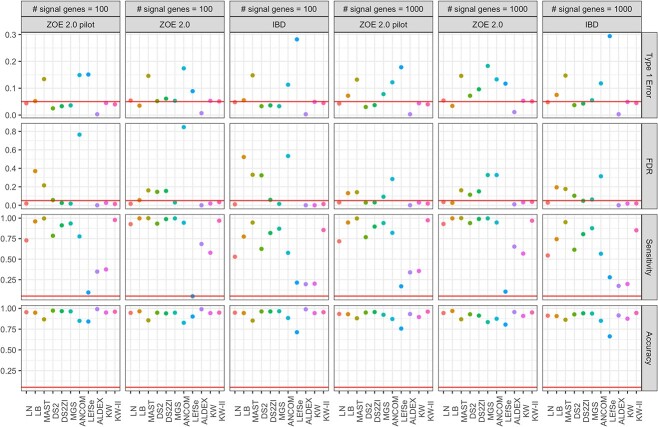
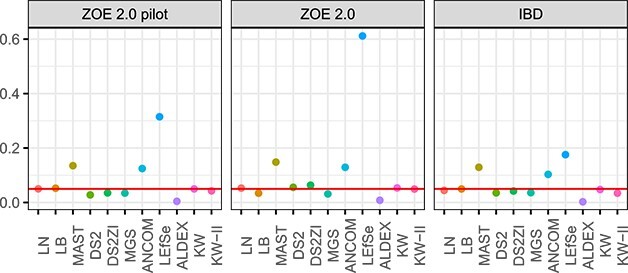
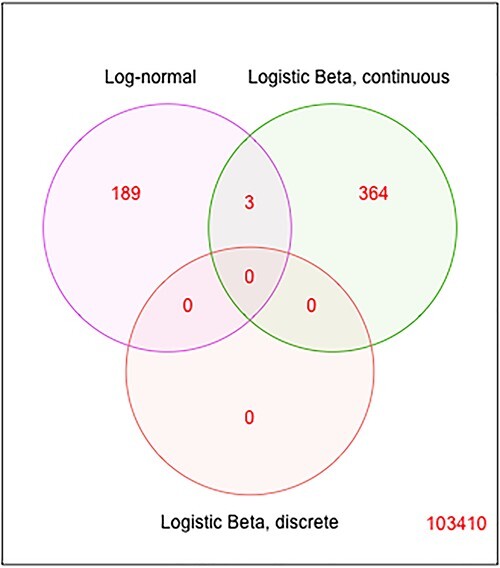
Understanding the function of the human microbiome is important but the development of statistical methods specifically for the microbial gene expression (i.e. metatranscriptomics) is in its infancy. Many currently employed differential expression analysis methods have been designed for different data types and have not been evaluated in metatranscriptomics settings. To address this gap, we undertook a comprehensive evaluation and benchmarking of 10 differential analysis methods for metatranscriptomics data. We used a combination of real and simulated data to evaluate performance (i.e. type I error, false discovery rate and sensitivity) of the following methods: log-normal (LN), logistic-beta (LB), MAST, DESeq2, metagenomeSeq, ANCOM-BC, LEfSe, ALDEx2, Kruskal-Wallis and two-part Kruskal-Wallis. The simulation was informed by supragingival biofilm microbiome data from 300 preschool-age children enrolled in a study of childhood dental disease (early childhood caries, ECC), whereas validations were sought in two additional datasets from the ECC study and an inflammatory bowel disease study. The LB test showed the highest sensitivity in both small and large samples and reasonably controlled type I error. Contrarily, MAST was hampered by inflated type I error. Upon application of the LN and LB tests in the ECC study, we found that genes C8PHV7 and C8PEV7, harbored by the lactate-producing Campylobacter gracilis, had the strongest association with childhood dental disease. This comprehensive model evaluation offers practical guidance for selection of appropriate methods for rigorous analyses of differential expression in metatranscriptomics. Selection of an optimal method increases the possibility of detecting true signals while minimizing the chance of claiming false ones.
Keywords: benchmark; differential expression; early childhood caries; logistic-beta; metagenomics; metatranscriptomics.
© The Author(s) 2023. Published by Oxford University Press.
Figures
Similar articles
-
The Supragingival Biofilm in Early Childhood Caries: Clinical and Laboratory Protocols and Bioinformatics Pipelines Supporting Metagenomics, Metatranscriptomics, and Metabolomics Studies of the Oral Microbiome.Methods Mol Biol. 2019;1922:525-548. doi: 10.1007/978-1-4939-9012-2_40. Methods Mol Biol. 2019. PMID: 30838598 Free PMC article.
-
A comprehensive evaluation of microbial differential abundance analysis methods: current status and potential solutions.Microbiome. 2022 Aug 19;10(1):130. doi: 10.1186/s40168-022-01320-0. Microbiome. 2022. PMID: 35986393 Free PMC article.
-
Metabolomics Insights in Early Childhood Caries.J Dent Res. 2021 Jun;100(6):615-622. doi: 10.1177/0022034520982963. Epub 2021 Jan 9. J Dent Res. 2021. PMID: 33423574 Free PMC article.
-
Meta-Analysis Using NGS Data: The Veillonella Species in Dental Caries.Front Oral Health. 2021 Oct 22;2:770917. doi: 10.3389/froh.2021.770917. eCollection 2021. Front Oral Health. 2021. PMID: 35048071 Free PMC article.
-
Combining metagenomics, metatranscriptomics and viromics to explore novel microbial interactions: towards a systems-level understanding of human microbiome.Comput Struct Biotechnol J. 2015 Jun 9;13:390-401. doi: 10.1016/j.csbj.2015.06.001. eCollection 2015. Comput Struct Biotechnol J. 2015. PMID: 26137199 Free PMC article. Review.
Cited by
-
Methodological Considerations in Longitudinal Analyses of Microbiome Data: A Comprehensive Review.Genes (Basel). 2023 Dec 28;15(1):0. doi: 10.3390/genes15010051. Genes (Basel). 2023. PMID: 38254941 Free PMC article. Review.
-
Differences in gut microbiota between Dutch and South-Asian Surinamese: potential implications for type 2 diabetes mellitus.Sci Rep. 2024 Feb 26;14(1):4585. doi: 10.1038/s41598-024-54769-4. Sci Rep. 2024. PMID: 38403716 Free PMC article.
-
Human gut microbiome gene co-expression network reveals a loss in taxonomic and functional diversity in Parkinson's disease.NPJ Biofilms Microbiomes. 2025 Jul 24;11(1):142. doi: 10.1038/s41522-025-00780-0. NPJ Biofilms Microbiomes. 2025. PMID: 40707492 Free PMC article.
-
Evaluation of imputation and imputation-free strategies for differential abundance analysis in metaproteomics data.Brief Bioinform. 2025 Mar 4;26(2):bbaf141. doi: 10.1093/bib/bbaf141. Brief Bioinform. 2025. PMID: 40254829 Free PMC article.
-
BZINB Model-Based Pathway Analysis and Module Identification Facilitates Integration of Microbiome and Metabolome Data.Microorganisms. 2023 Mar 16;11(3):766. doi: 10.3390/microorganisms11030766. Microorganisms. 2023. PMID: 36985339 Free PMC article.
References
-
- Mogens Kilian ILC, Chapple MH, Marsh PD, et al. The oral microbiome–an update for oral healthcare professionals. Br Dent J 2016;221(10):657–66. - PubMed
Publication types
MeSH terms
Substances
Grants and funding
LinkOut - more resources
Full Text Sources
Miscellaneous
