. 2023 Nov 15;83(22):3726-3738.
doi: 10.1158/0008-5472.CAN-23-0783.

Galectin-3 Cooperates with CD47 to Suppress Phagocytosis and T-cell Immunity in Gastric Cancer Peritoneal Metastases

Affiliations

Galectin-3 Cooperates with CD47 to Suppress Phagocytosis and T-cell Immunity in Gastric Cancer Peritoneal Metastases

Yibo Fan et al. Cancer Res. .

Abstract

The peritoneal cavity is a common site of gastric adenocarcinoma (GAC) metastasis. Peritoneal carcinomatosis (PC) is resistant to current therapies and confers poor prognosis, highlighting the need to identify new therapeutic targets. CD47 conveys a "don't eat me" signal to myeloid cells upon binding its receptor signal regulatory protein alpha (SIRPα), which helps tumor cells circumvent macrophage phagocytosis and evade innate immune responses. Previous studies demonstrated that the blockade of CD47 alone results in limited clinical benefits, suggesting that other target(s) might need to be inhibited simultaneously with CD47 to elicit a strong antitumor response. Here, we found that CD47 was highly expressed on malignant PC cells, and elevated CD47 was associated with poor prognosis. Galectin-3 (Gal3) expression correlated with CD47 expression, and coexpression of Gal3 and CD47 was significantly associated with diffuse type, poor differentiation, and tumor relapse. Depletion of Gal3 reduced expression of CD47 through inhibition of c-Myc binding to the CD47 promoter. Furthermore, injection of Gal3-deficient tumor cells into either wild-type and Lgals3-/- mice led to a reduction in M2 macrophages and increased T-cell responses compared with Gal3 wild-type tumor cells, indicating that tumor cell-derived Gal3 plays a more important role in GAC progression and phagocytosis than host-derived Gal3. Dual blockade of Gal3 and CD47 collaboratively suppressed tumor growth, increased phagocytosis, repolarized macrophages, and boosted T-cell immune responses. These data uncovered that Gal3 functions together with CD47 to suppress phagocytosis and orchestrate immunosuppression in GAC with PC, which supports exploring a novel combination therapy targeting Gal3 and CD47.

Significance: Dual inhibition of CD47 and Gal3 enhances tumor cell phagocytosis and reprograms macrophages to overcome the immunosuppressive microenvironment and suppress tumor growth in peritoneal metastasis of gastric adenocarcinoma.


Conflict of interest statement

Conflict interests:

The authors confirm that there are no conflicts of interest to disclose.

Figures

Figure 1.
Figure 1.. “Do not eat me” gene CD47 is enriched in peritoneal metastases of GAC and associated with poor survival.
A, Bulk RNA-seq analysis on PC specimen (n = 20) using a curated panel of immune checkpoint and “don’t eat me” gene. Unsupervised hierarchical clustering was performed on the normalized RNA expression data of indicated genes. B, Box plot analysis showed immune checkpoint and “don’t eat me” genes of stage IV of TCGA STAD (n=41) and GSE15459 (n=60). C, Expression profile of “don’t eat me” genes CD47, SIRPA, CD274, PDCD1, LILRB1 and LILRB2 were shown in dot-plot with normalized expression levels of indicated genes from scRNA-seq data. D, CD47 and PD-L1 were detected on 6 representative PC ascites samples, as examined by CyTOF using antibodies against notable cell type markers, and CD47 and PD-L1. E, Normalized expression levels of CD47 and SIRPA in tumor cluster and myeloid cluster between long-term survivors and short-term survivors was shown as violin plots (P<0.0001). F, “Don’t eat me” genes CD47, SIRPA, CD274, PDCD1, LILRB1 and LILRB2 were shown on the heatmap based on bulk RNA-seq analysis on PCs patients with long-term survivors (>12 month) and short-term survivors (<8 month). G, Representative contour plots (left) and quantification of CD47 expression (right) on EpCAM+ tumor cells detected on PC samples between long-term survivor (>12 month) and short-term survivor (<8 month) (n=42), as assessed by flow cytometry. H, The association of CD47 and overall survival of complete responders (CR) patients from TCGA dataset (n=136). Log rank (Mantel-Cox) test was used.
Figure 2.
Figure 2.. CD47 overexpression corelated with Gal-3 in PC specimens of GAC.
A, scRNA-seq analysis of unfractionated tumor cells from 20 PC samples. B, Normalized expression levels of LGALS3 and CD47 in tumor cell clusters between long-term survivors and short-term survivors is shown by violin plots (left). Correlation between LGALS3 and CD47 in short-term survivor tumor clusters from scRNA-seq data (P<0.0001, right). C, Scatter plot showed the correlation of LGALS3 and CD47 in epithelial cells in GEO183904 cohort. D, Representative immunofluorescence images (left) and the association analysis (right) of Gal-3 and CD47 staining on PC samples (n=51). Scale bar: 50 μm. E, Representative immunohistology staining of Gal-3 and CD47 images of intestinal and diffuse type in TMA samples (left). Scale bar: 100 μm. The association analysis of Gal-3 and CD47 staining in primary GAC of TMA (n=210; P<0.0001, right). F, The association of Gal-3 and CD47 high expression and low expression with overall survival in TMA samples. G, The association of CD47 and Gal-3 high expression with tumor grade (P<0.0001), diffuse type (P=0.0008) and tumor relapse (P=0.0435) respectively. Student’s test was used unless otherwise indicated.
Figure 3.
Figure 3.. Depletion of Gal-3 suppressed CD47 expression in GAC cells.
A, Western blot analysis of Gal-3 and CD47 expression in AGS and GT5 cells with or without Gal-3 KO (n = 3 biological replicates). B, The expression levels of CD47 mRNA examined by qRT-PCR in NC and Gal-3 KO cells in both AGS and GT5 cells (n = 3 biological replicates). C and D, Representative histogram level and quantification of Gal-3 and CD47 in NC and Gal-3 KO cells in AGS and GT5 cells by flow cytometry, respectively (n = 3 biological replicates). E and F, Highly upregulated hallmark pathways were revealed by GSEA analysis of RNAseq data in AGS NC cells compared with Gal-3 KO cells. G, The expression level of c-Myc, CD47 and Gal-3 was determined by Western blot (n = 3 biological replicates) in Gal-3 KO AGS cells with or without overexpression of c-Myc. H, Quantitative ChIP-qPCR analysis was performed using CD47 promoter primers spanning c-Myc binding site after chromatin pulldown using c-Myc and H3k27ac antibodies in AGS Gal-3 KO cells with or without rescued Gal-3 overexpression (n = 3 biological replicates). Student’s test was used unless otherwise indicated.
Figure 4.
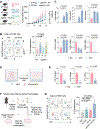
Figure 4.. Depletion of Gal-3 promotes phagocytosis by repolarizing macrophages.
A, Diagram of inoculation of KP-Luc2 NC and Gal-3 KO cells in C57BL/6 WT and Lgals3 KO mice (left). Tumor growth engrafted with KP-Luc2 NC and Gal-3 KO cells in both C57BL/6 WT and Lgals3 KO mice were measured (n = 5mice per group, right). B, Representative contour plots and quantification phagocytosis of KP-Luc2 NC and Gal-3 KO cells in both C57BL/6 WT and Lgals3 KO mice at the end point of experiment by flowcytometry. C, Expression levels of CD80, CD86, TNF (upper), CXCL10, TGFB1 and TGBF2 (bottom) were examined qRT-PCR in primary human donor-derived macrophages co-cultured with NC and Gal-3 KO cells of AGS for 48h (n = 3 biological replicates). D, Diagram of Diagram demonstrates the experiments procedure of co culturing U937 with AGS NC and AGS Gal-3 KO cell. E, U937 was treated with 80nM PMA for 48h, and co-cultured with NC and Gal-3 KO cells of AGS for 48h, expression levels of CSF1, CCL2 and IL10 were examined by qRT-PCR (n = 3 biological replicates). F, Diagram demonstrates the isolation of macrophage from bone marrow of mice. G, Representative contour plots and quantification of phagocytosis of KP-Luc2 by BMDMs pretreated with αCD47, TD139 and combination treatment for 48 h (n = 4/group), as examined by flow cytometry. One-way ANOVA was used in A, B, G. Student’s test was used unless otherwise indicated.
Figure 5.
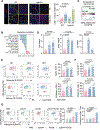
Figure 5.. Inhibition of Gal-3 boosted T cell responses in GAC.
A, Representative immunofluorescence staining images (left) and quantification (right) of CD8+ in KP-Luc2 NC and Gal-3 KO cells in WT and Lgals3−/− KO mice (n = 5 mice per group). Scale bars, 50 μm. B, Spearman correlation of LGALS3 expression and CD8+ T cell, CD4+ T cell, B cell and NK cell infiltration by MCP-counter, quaTIseq and xCELL algorithm in TCGA STAD cohort (n=415). C, Highly upregulated hallmark pathways were revealed by GSEA analysis of RNAseq data in AGS Gal-3 KO cells compared with NC cells. D, The expression levels of TNF, IL2 and IFNG examined by qRT-PCR in human PBMCs co-cultured with AGS NC and Gal-3 KO cells for 48h (n = 3/group). E, Representative contour plots and quantification of GrB and Perforin in CD8+ T cells after co-cultured with of AGS Gal-3 KO or NC cells with CD8 T cells for 48h (n = 4/group), as examined by flow cytometry. F, Quantification of GrB and Perforin CD8+ T cells after co-cultured with of GT5 Gal-3 KO or NC cells for 48h (n = 4/group), as examined by flow cytometry. G, Representative contour plots (left) and quantification of GrB and Perforin expression (right) in human peripheral CD8+ T cells co-cultured with AGS cells of the indicated treatment (n = 4/group), as examined by flow cytometry. AGS cells was treated with αCD47, TD139 and combination treatment for 48 h before co-culture with PBMCs. One-way ANOVA was used A and G. Student’s test was used unless otherwise indicated.
Figure 6.
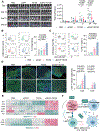
Figure 6.. Dual inhibition of Gal-3 and CD47 suppressed tumor growth through increasing phagocytosis and T cell infiltration and response.
A, Representative bioluminescence images over 28 days (left) and quantification (right) of engrafted with KP-Luc2 cell in C57BL/6 mice (n = 5 mice per group) in the indicated treatment. B, Representative contour plots and quantification of phagocytosis at the endpoint day 28 (n =5 mice per group), as examined by flow cytometry. C, Representative contour plots and quantification of tumor IFNγ+CD8+ T cells (n =5 mice per group), as examined by flow cytometry at day 14 (n=5 mice per group). D, Representative immunofluorescence staining images (left) and quantification (right) of tumor infiltrating CD8+ T cells in tumor core and total area (n =5 mice per group). Scale bars, 100 μm. E, Notable markers of M1 and M2 Macrophage (top) and T cell related genes expression (bottom) were shown in heatmap of indicated treatment (n=5 mice per group). F, Schematic illustration of the impact of Gal-3 and CD47 in phagocytosis and immune regulation in GAC in TME; and co-targeting Gal-3 using TD139 and CD47 using αCD47 antibody synergistically boost both innate and adaptive immune responses that lead to tumor suppression. One-way ANOVA was used A-D.

References

    1. Joshi SS, Badgwell BD. Current treatment and recent progress in gastric cancer. CA Cancer J Clin 2021;71:264–79 - PMC - PubMed
    1. Chen D, Liu Z, Liu W, Fu M, Jiang W, Xu S, et al. Predicting postoperative peritoneal metastasis in gastric cancer with serosal invasion using a collagen nomogram. Nat Commun 2021;12:179. - PMC - PubMed
    1. Tanaka Y, Chiwaki F, Kojima S, Kawazu M, Komatsu M, Ueno T, et al. Multi-omic profiling of peritoneal metastases in gastric cancer identifies molecular subtypes and therapeutic vulnerabilities. Nat Cancer 2021;2:962–77 - PubMed
    1. Cassetta L, Pollard JW. Targeting macrophages: therapeutic approaches in cancer. Nat Rev Drug Discov 2018;17:887–904 - PubMed
    1. Feng M, Jiang W, Kim BYS, Zhang CC, Fu YX, Weissman IL. Phagocytosis checkpoints as new targets for cancer immunotherapy. Nat Rev Cancer 2019;19:568–86 - PMC - PubMed

Publication types