. 2023 Sep 23;164(11):bqad143.
doi: 10.1210/endocr/bqad143.

Adipocyte Glucocorticoid Receptor Inhibits Immune Regulatory Genes to Maintain Immune Cell Homeostasis in Adipose Tissue

Affiliations

Adipocyte Glucocorticoid Receptor Inhibits Immune Regulatory Genes to Maintain Immune Cell Homeostasis in Adipose Tissue

Shripa Amatya et al. Endocrinology. .

Abstract

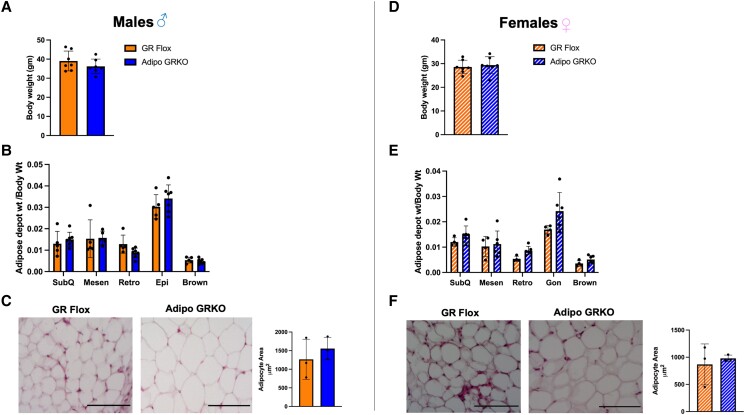
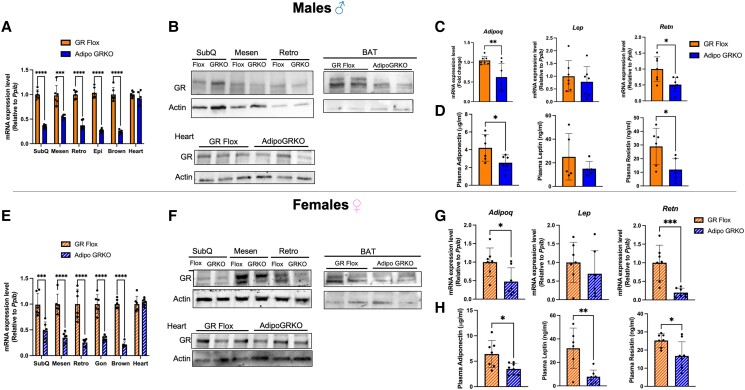
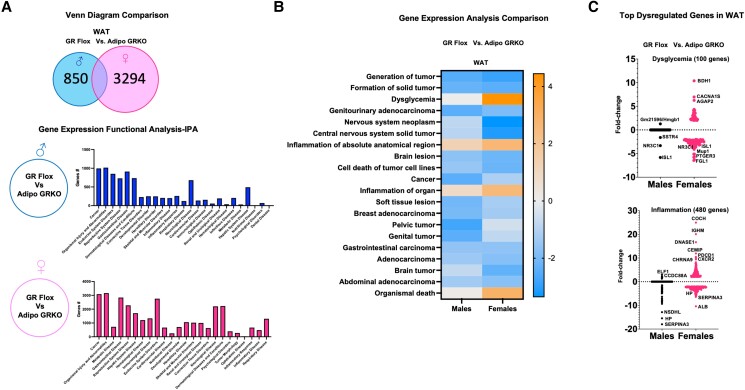
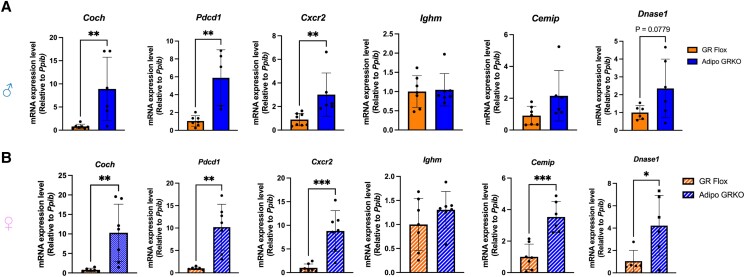
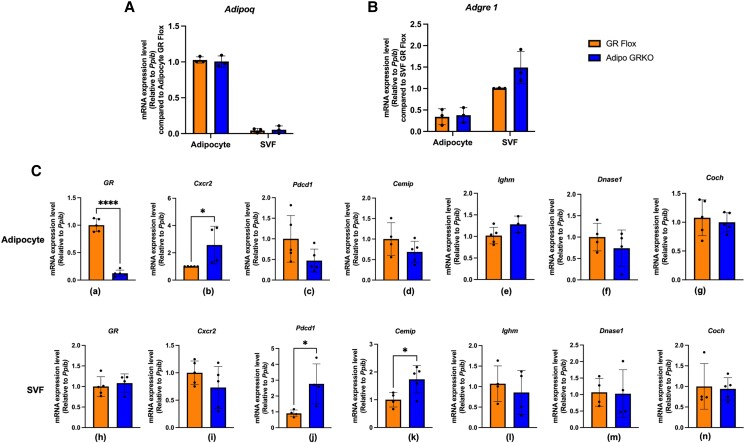
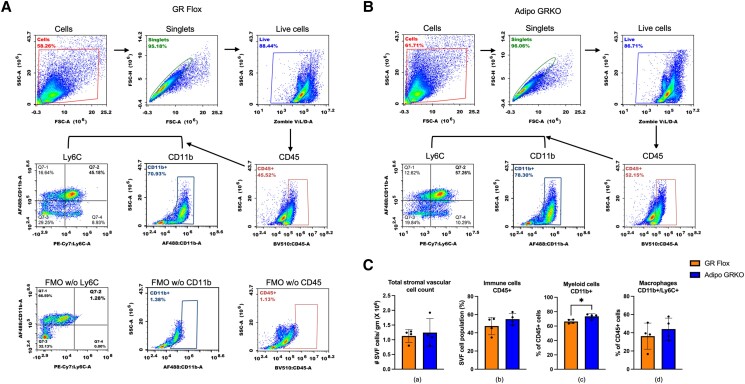
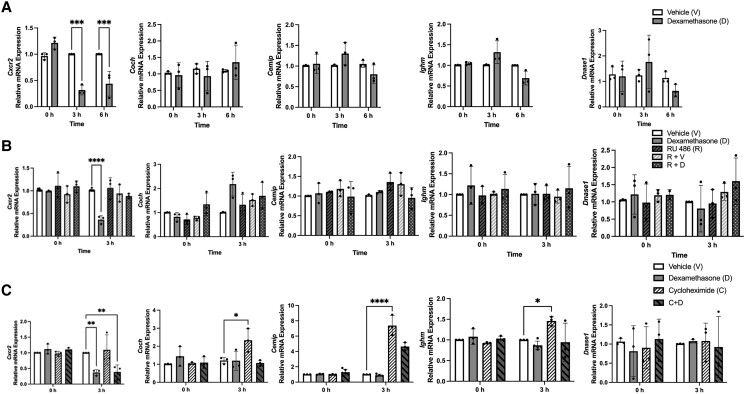
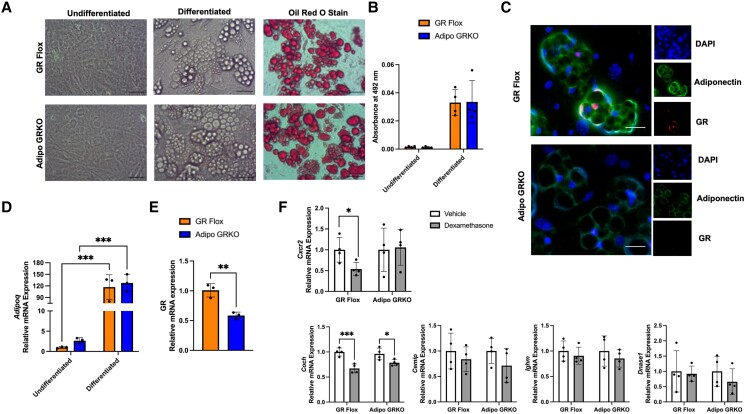
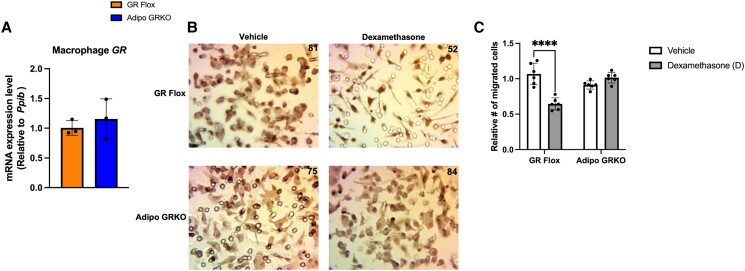
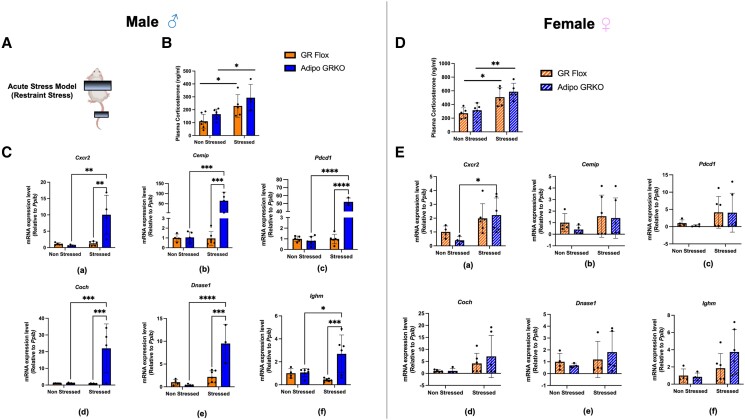
Glucocorticoids acting via the glucocorticoid receptors (GR) are key regulators of metabolism and the stress response. However, uncontrolled or excessive GR signaling adversely affects adipose tissue, including endocrine, immune, and metabolic functions. Inflammation of the adipose tissue promotes systemic metabolic dysfunction; however, the molecular mechanisms underlying the role of adipocyte GR in regulating genes associated with adipose tissue inflammation are poorly understood. We performed in vivo studies using adipocyte-specific GR knockout mice in conjunction with in vitro studies to understand the contribution of adipocyte GR in regulating adipose tissue immune homeostasis. Our findings show that adipocyte-specific GR signaling regulates adipokines at both mRNA and plasma levels and immune regulatory (Coch, Pdcd1, Cemip, and Cxcr2) mRNA gene expression, which affects myeloid immune cell presence in white adipose tissue. We found that, in adipocytes, GR directly influences Cxcr2. This chemokine receptor promotes immune cell migration, indirectly affecting Pdcd1 and Cemip gene expression in nonadipocyte or stromal cells. Our findings suggest that GR adipocyte signaling suppresses inflammatory signals, maintaining immune homeostasis. We also found that GR signaling in adipose tissue in response to stress is sexually dimorphic. Understanding the molecular relationship between GR signaling and adipose tissue inflammation could help develop potential targets to improve local and systemic inflammation, insulin sensitivity, and metabolic health.

Keywords: adipose tissue; adipose tissue homeostasis; glucocorticoid receptor; glucocorticoids.


Figures

Figure 1.
Figure 1.
Deletion of adipocyte GR did not affect the body weight, adiposity, or adipocyte size. (A), (D) Body weight of male (solid bars) and female (striped bars) GR Flox and Adipo GRKO mice (n = 7 mice/genotype). (B), (E) Ratio of different adipose tissue depot weight to body weight was calculated as a measure of adiposity in GR Flox and Adipo GRKO male and female mice (n = 4-6 mice/genotype). (C), (F) Representative hematoxylin and eosin stained image of GR Flox and Adipo GRKO male and female mesenteric adipose tissue. Average adipocyte area was calculated using ImageJ software (n = 3 mice/genotype). Scale bar: 10 μm. All values represent mean ± SD. Data were statistically analyzed using unpaired Student's t-test. Abbreviations: Adipo GRKO, adipocyte-specific GR knockout; GR, glucocorticoid receptors; GR Flox, C57BL/6J GR flox/flox; GRKO, GR knockout.
Figure 2.
Figure 2.
Characterization of adipocyte-specific GR knockout mice. (A), (E) GR mRNA expression relative to Ppib was assessed by quantitative PCR in SubQ, Mesen, Retro, Epi, BAT, and heart in male GR Flox and Adipo GRKO mice as well as female GR Flox and Adipo GRKO (n = 6 mice/genotype). (B), (F) Representative Western blot of GR expression in total white adipose tissue (SubQ, Mesen, and Retro), BAT, and heart protein extracts of GR Flox and Adipo GRKO male and female mice (n = 3 mice/genotype). (C), (G) Quantitative PCR assessment of mRNA expression of adiponectin (Adipoq), leptin (Lep), and resistin (Retn) relative to Ppib in mesenteric adipose tissue of GR Flox and Adipo GRKO male and female mice (n = 6 mice/genotype). (D), (H) Plasma adiponectin, leptin, and resistin levels were measured by enzyme linked immunoassay in GR Flox and Adipo GRKO male and female mice (n = 5-8 mice/genotype). All values represent mean ± SD. Data were statistically analyzed using unpaired Student's t-test. * P < .05, ** P < .01, *** P < .001, **** P < .0001. Abbreviations: Adipo GRKO, adipocyte-specific GR knockout; BAT, brown adipose tissue; Epi, epididymal; GR, glucocorticoid receptors; GR Flox, C57BL/6J GR flox/flox; Mesen, mesenteric; Retro, retroperitoneal; SubQ, subcutaneous.
Figure 3.
Figure 3.
Deletion of adipocyte GR significantly alters visceral white adipose tissue gene expression. (A) Venn diagram comparison between mesenteric adipose tissue of GR Flox and Adipo GRKO mice representing the number of differentially expressed genes in males and females. Functional clustering using the bioinformatics tool Ingenuity Pathway Analysis revealed several differentially regulated genes implicated in cancer, metabolic, and inflammatory diseases in both males and females. (B) Heat map generated from the microarray data comparing the gene expression analyzed from GR Flox and Adipo GRKO mice between males and females. Upregulated and downregulated genes associated with several pathologies, including cancer, dysglycemia, and inflammation, were associated with adipocyte GR deletion. (C) Pathologies linked to metabolic dysfunction such as dysglycemia and inflammation were among the top upregulated genes. Microarray analysis revealed enrichment of multiple dysglycemia and inflammation associated genes with a greater than 2-fold change in male and female Adipo GRKO mice. Abbreviations: Adipo GRKO, adipocyte-specific GR knockout; GR, glucocorticoid receptors; GR Flox, C57BL/6J GR flox/flox.
Figure 4.
Figure 4.
Validation of microarray data. Quantitative PCR was performed to analyze Cochlin (Coch), programmed cell death protein 1 (Pdcd1), C-X-C chemokine receptor 2 (Cxcr2), immunoglobulin heavy chain mu (Ighm), cell migration inducing hyaluronidase 1 (Cemip), and deoxyribonuclease1 (Dnase1) mRNA gene expression in GR Flox and Adipo GRKO male (A) and female (B) mice (n = 5-8 mice/genotype). The mRNA gene expression level was determined using the 2−ΔΔCt method with cyclophilin B (Ppib) as the reference gene. All values represent mean ± SD. Data were analyzed using Student's t-test. * P < .05, ** P < .01, *** P < .001. Abbreviations: Adipo GRKO, adipocyte-specific GR knockout; GR, glucocorticoid receptors; GR Flox, C57BL/6J GR flox/flox.
Figure 5.
Figure 5.
Adipose tissue fractionation revealed that both adipocytes and stromal vascular fraction cells express immune regulatory genes. (A) Expression of the Adipoq gene, which codes for the adipocyte marker adiponectin, was quantified in adipocytes and the SVF fraction using adipocyte GR Flox mice as the control. (B) Expression of the Adgre1 gene, which codes for the macrophage marker F4/80, was quantified in adipocyte and SVF fraction using SVF GR Flox as the control. (C)-(I) GR, Cxcr2, Pdcd1, Cemip, Ighm, Dnase1, and Coch mRNA gene expression measured in adipocytes and the SVF fraction compared to the respective fractions of GR Flox mice (n = 3-5 mice/genotype). All values represent mean ± SD. Data were combined from 3 or more independent experiments and statistically analyzed using unpaired Student's t-test. *, P < .05 ****, P < .0001. Abbreviations: GR, glucocorticoid receptors; GR Flox, C57BL/6J GR flox/flox; SVF, stromal vascular fraction.
Figure 6.
Figure 6.
Gating strategy for flow cytometry and quantification of immune cells from epididymal SVF cells. Total SVF cells were first gated on a forward scatter/side scatter plot and then gated for the selection of singlets. Singlets were further gated for live cells followed by CD45 gating for total immune cells. These were then gated for myeloid cells (CD45+/CD11b+) and macrophages (CD45+/Cd11b+/Ly6C+). Fluorescence Minus One (FMO) controls were used for each antibody marker to set the limit for the background signal of the excluded marker and to gate for a positive stained cell population. (A), (B) Representative gating strategy for GR Flox and Adipo GRKO mice. (C) Quantitative analysis of SVF cells prior to cell staining, immune cells, myeloid cells, and macrophages. Epididymal adipose tissues were pooled from 2 mice per genotype for each experiment. n = 4 independent experiments. All values represent mean ± SD. Data were analyzed by Student's t-test. * P < .05. Abbreviations: Adipo GRKO, adipocyte-specific GR knockout; GR, glucocorticoid receptors; GR Flox, C57BL/6J GR flox/flox; SVF, stromal vascular fraction.
Figure 7.
Figure 7.
Cxcr2 is directly repressed by the glucocorticoid receptor in differentiated 3T3-L1 adipocytes. (A) 3T3-L1 cells were treated with vehicle (control) (white bars) or 100 nM Dex, a synthetic GR agonist, for 3 and 6 hours (grey bars). Gene expression for Cxcr2, Coch, Cemip, Ighm, and Dnase1 were assessed by qPCR. (B) 3T3-L1 adipocytes were pretreated with vehicle (control) (white bars), 100 nM Dex (grey bars), 1 µM RU 486 (slanted black striped bars), 1 µM RU 486 and vehicle (slanted white striped bars) or both 1 µM RU 486 and 100 nM Dex (white dots on black bars). mRNA expression levels were measured by qPCR. (C) 3T3-L1 cells were pretreated for 1 hour with vehicle (control) (white bars), 100 nM Dex (grey bars), 10 µg/mL cycloheximide (slanted black stripes on white bars), or combined cycloheximide followed by 100 nM Dex for 3 hours (slanted black stripes on grey bars). mRNA levels of Cxcr2, Coch, Cemip, Ighm, and Dnase1 were measured using qPCR. All values represent mean ± SD. Data were combined from 3 independent experiments (in duplicate for each experiment) and statistically analyzed using 2-way ANOVA. P-values were based on Tukey's multiple comparison test. * P < .05, ** P < .01, *** P < .001, **** P < .0001. Abbreviations: GR, glucocorticoid receptors; qPCR, quantitative PCR.
Figure 8.
Figure 8.
Primary adipocytes differentiated from GR flox and Adipo GRKO mice showing significantly reduced GR mRNA expression and the effect of GR stimulation on immunoregulatory genes. (A) Representative images of undifferentiated, differentiated lipid laden, and Oil-Red-O-stained lipid droplets in primary GR Flox and Adipo GRKO adipocytes on day 10. Scale bar: 5 μm. (B) Stained lipid droplets were quantified using the extracted Oil-Red-O stain and absorbance was measured at 492 nm. (C) Representative immunofluorescence staining of adiponectin and GR proteins in differentiated GR Flox and Adipo GRKO adipocytes. (D) Adipoq mRNA expression as measured by qPCR in undifferentiated and differentiated GR Flox and Adipo GRKO adipocytes on day 10. (E) GR mRNA expression as measured by qPCR in differentiated GR Flox and Adipo GRKO adipocytes on day 10. (F) Primary GR Flox and Adipo GRKO adipocytes were treated with vehicle (control) or 100 nM dexamethasone (grey bars) for 3 hours. The mRNA gene expression of Cxcr2, Cemip, Coch, Ighm, and Dnase1 was measured by qPCR. All values represent mean ± SD. (D)-(F) Data from 3 independent experiments (in duplicate for each experiment) were combined and statistically analyzed using either 2-way ANOVA with Tukey's multiple comparisons (D) or Student's t-test [E-F). * P < 0.05, ** P < 0.01, ***P < 0.001. Abbreviations: Adipo GRKO, adipocyte-specific GR knockout; GR, glucocorticoid receptors; GR Flox, C57BL/6J GR flox/flox; qPCR, quantitative PCR.
Figure 9.
Figure 9.
Dexamethasone treatment inhibits macrophage migration toward GR flox but not toward adipo GRKO adipocytes. (A) GR mRNA expression in bone marrow derived macrophages from GR Flox and Adipo GRKO mice. (B) Macrophages that migrated through the pores to the lower side of the insert membrane were fixed, stained, and counted at 40 × magnification. The number on each panel indicates the cell count. Five images were taken for each group and the representative images are shown here. Images were taken with a light microscope (magnification 400x). (C) Adipocytes were treated with vehicle (white bars) or 100 nM dexamethasone (grey bars) prior to adding DMEM with 10% fetal bovine serum in a transwell migration assay. Data are representative of 3 independent experiments (in duplicate for each experiment). Statistics were calculated either using Student's t-test (A) or 2-way ANOVA (C). P-values were based on Tukey's multiple comparison test. **** P < 0.001. All values represent mean ± SD. Abbreviations: Adipo GRKO, adipocyte-specific GR knockout; GR, glucocorticoid receptors; GR Flox, C57BL/6J GR flox/flox.
Figure 10.
Figure 10.
Effect of exposure to acute stress on immune regulatory genes in mesenteric adipose tissue. (A) Model of psychogenic stress used to induce acute stress. (B), (D) Plasma corticosterone levels of nonstressed and stressed GR Flox and Adipo GRKO male and female mice, respectively. (C), (E) Quantitative PCR assessment of mRNA expression of Cxcr2, Cemip, Pdcd1, Coch, Dnase1, and Ighm, gene expression levels in nonstressed and stressed GR Flox and Adipo GRKO male and female mice (n = 4-6 mice/genotype/group) . All values represent mean ± SD. Statistics were calculated using 2-way ANOVA. P-values were based on Tukey's multiple comparison test. *P < .05, ** P < .01, *** P < .001, **** P < 0.0001. Abbreviations: Adipo GRKO, adipocyte-specific GR knockout; GR, glucocorticoid receptors; GR Flox, C57BL/6J GR flox/flox.

Similar articles

Cited by

References

    1. Burford NG, Webster NA, Cruz-Topete D. Hypothalamic-Pituitary-Adrenal axis modulation of glucocorticoids in the cardiovascular system. Int J Mol Sci. 2017;18(10):2150. - PMC - PubMed
    1. Glaser R, Kiecolt-Glaser JK. Stress-induced immune dysfunction: implications for health. Nat Rev Immunol. 2005;5(3):243‐251. - PubMed
    1. Sapolsky RM, Romero LM, Munck AU. How do glucocorticoids influence stress responses? Integrating permissive, suppressive, stimulatory, and preparative actions*. Endocr Rev. 2000;21(1):55‐89. - PubMed
    1. Timmermans S, Souffriau J, Libert C. A general Introduction to glucocorticoid biology. Front Immunol. 2019;10:1545. - PMC - PubMed
    1. Swarbrick M, Zhou H, Seibel M. Mechanisms in endocrinology: local and systemic effects of glucocorticoids on metabolism: new lessons from animal models. Eur J Endocrinol. 2021;185(5):R113‐R129. - PubMed