Randomized Controlled Trial
. 2024 Jan 1;79(1):glad214.
doi: 10.1093/gerona/glad214.

Caloric Restriction Intervention Alters Specific Circulating Biomarkers of the Senescence-Associated Secretome in Middle-Aged and Older Adults With Obesity and Prediabetes in an 18-Week Randomized Controlled Trial

Affiliations
Randomized Controlled Trial

Caloric Restriction Intervention Alters Specific Circulating Biomarkers of the Senescence-Associated Secretome in Middle-Aged and Older Adults With Obesity and Prediabetes in an 18-Week Randomized Controlled Trial

Jamie N Justice et al. J Gerontol A Biol Sci Med Sci. .

Abstract

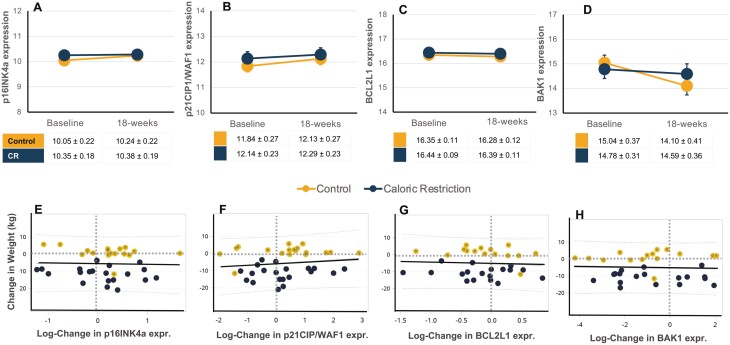
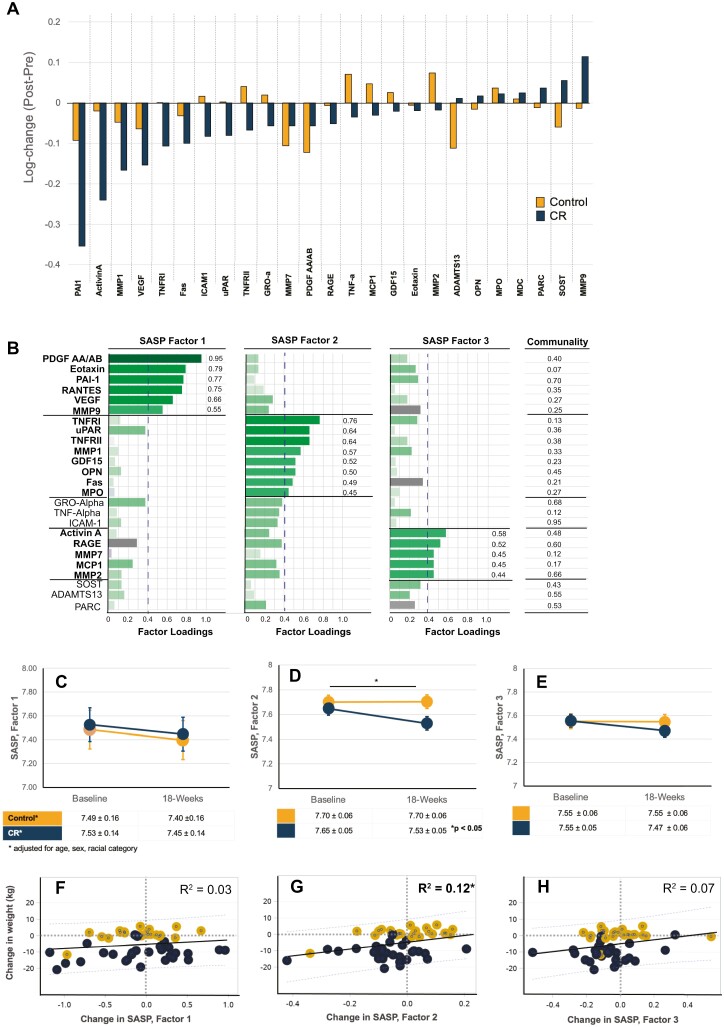
Cellular senescence is a biological aging process that is exacerbated by obesity and leads to inflammation and age- and obesogenic-driven chronic diseases including type 2 diabetes. Caloric restriction (CR) may improve metabolic function in part by reducing cellular senescence and the pro-inflammatory senescence-associated phenotype (SASP). We conducted an ancillary investigation of an 18-week randomized controlled trial (RCT) of CR (n = 31) or Control (n = 27) in 58 middle-aged/older adults (57.6 ± 5.8 years; 75% Women) with obesity and prediabetes. We measured mRNA expression of select senescence and apoptosis genes in blood CD3 + T cells (qRT-PCR) and a panel of 25 plasma SASP proteins (Luminex/multiplex; ELISA). Participants randomized to CR lost -10.8 ± 0.9 kg (-11.3% ± 5.4%) over 18 weeks compared with +0.5 ± 0.9 kg (+0.03% ± 3.5%) in Control group. T-cell expression of senescence biomarkers, p16INK4a and p21CIP1/WAF1, and apoptosis markers, BCL2L1 and BAK1, was not different between CR and Control groups in age, race, and sex-adjusted mixed models (p > .05, all). Iterative principal axis factor analysis was used to develop composite SASP Factors, and the Factors comprising TNFRI, TNFRII, uPAR, MMP1, GDF15, OPN, Fas, and MPO were significantly altered with CR intervention (age, sex, race-adjusted mixed model time × treatment F = 4.17, p ≤ .05) and associated with the degree of weight loss (R2 = 0.12, p ≤ .05). Our study provides evidence from an RCT that specific circulating biomarkers of senescent cell burden are changed by CR in middle-aged and older adults with obesity and prediabetes. Future studies compare tissue and circulating levels of p16INK4a and pro-inflammatory SASP biomarkers in other populations, and interventions.

Keywords: Aging; Biomarkers; Cell senescence; Dietary restriction; Inflammation.


Conflict of interest statement

N.M. is a cofounder of Sapere Bio, holds equity in the company, and is an inventor of intellectual property applications. The other authors declare that the research was conducted in the absence of any commercial or financial relationships that could be construed as a potential conflict of interest.

Figures

Figure 1.
Figure 1.
Intervention effect on circulating T-cell expression of biomarkers of cellular senescence and apoptosis. Individual data points and mean ± SEM data are shown at baseline and 18-week postintervention of caloric restriction (CR, blue) or health education control (Control, orange) for CD3 + T-cell gene expression of log-transformed markers of cellular senescence p16INK4a (A), and p21CIP1/WAF1 (B), apoptosis marker BCL2L1 (C), and anti-apoptosis marker BAK1 (D). Estimated means and SEM are shown in tables; mixed models adjusted for age, sex, and race were performed. Simple linear regression model with R2-values for log-fold change in gene expression with change in body with intervention in CR (blue) or Control (orange) groups for p16INK4a (E), p21CIP1/WAF1 (F), BCL2L1 (G), BAK1 (H). No significant changes or between group effects were observed. CR = Caloric restriction; SEM = standard error of the mean.
Figure 2.
Figure 2.
Change in senescence-associated secretory phenotype (SASP) proteins with 18-week intervention of Caloric restriction (CR) or Control. (A) All data are as log-fold change in biomarker levels (post–pre) for CR (blue) or Control (orange) groups, displayed as waterfall chart with largest reduction in biomarker level with CR on the left, and largest increase with CR on the right. (B) An exploratory factor analysis using iterative principal axis factor with a Varimax (orthogonal) rotation was performed on assays prior to randomization to reduce dimensionality. The results of an orthogonal rotation of the solution are shown with three SASP Factors (note, capitalized “Factor” hereafter refers to the composite score from each of three Factors identified by iterative principal factor analysis). A conservative cut point of 0.4 for variables contributing to Factors to remain in factor analysis was used. A composite score for each Factor was calculated by averaging the values of each contributing factor determined in Panel B, for example, SASP Factor 1 score = average (PDGF AA + Eotaxin + PAI-1 + RANTES + VEGF + MMP9). Mixed models adjusted for age, sex, and race were performed, and Estimated means and SEM are shown and time × treatment interactions indicated as *p ≤ .05 for: SASP Factor 1 score (C), SASP Factor 2 score (D), and SASP Factor 3 score (E). Lower panels show simple regression models with R2 values for log-fold change in composite SASP Factors 1 (F), Factor 2 (G), and Factor 3 (H) with change in body weight in CR (blue) or Control (orange) groups.

References

    1. Narasimhan A, Flores RR, Camell CD, Bernlohr DA, Robbins PD, Niedernhofer LJ.. Cellular senescence in obesity and associated complications: a new therapeutic target. Curr Diab Rep. 2022;22:537–548. 10.1007/s11892-022-01493-w - DOI - PMC - PubMed
    1. Ogrodnik M, Zhu Y, Langhi LGP, et al. . Obesity-induced cellular senescence drives anxiety and impairs neurogenesis. Cell Metab. 2019;29:1061–1077.e8. 10.1016/j.cmet.2018.12.008 - DOI - PMC - PubMed
    1. Ogrodnik M, Miwa S, Tchkonia T, et al. . Cellular senescence drives age-dependent hepatic steatosis. Nat Commun. 2017;8:15691. 10.1038/ncomms15691 - DOI - PMC - PubMed
    1. Tchkonia T, Morbeck DE, Von Zglinicki T, et al. . Fat tissue, aging, and cellular senescence. Aging Cell. 2010;9:667–684. 10.1111/j.1474-9726.2010.00608.x - DOI - PMC - PubMed
    1. Justice JN, Gregory H, Tchkonia T, et al. . Cellular senescence biomarker p16INK4a+ cell burden in thigh adipose is associated with poor physical function in older women. J Gerontol A Biol Sci Med Sci. 2017;73:939–945. 10.1093/gerona/glx134 - DOI - PMC - PubMed

Publication types

Substances