. 2023 Dec 21;142(25):2198-2215.
doi: 10.1182/blood.2022019495.

HEXIM1 is an essential transcription regulator during human erythropoiesis

Affiliations

HEXIM1 is an essential transcription regulator during human erythropoiesis

Xiurui Lv et al. Blood. .

Abstract

Regulation of RNA polymerase II (RNAPII) activity is an essential process that governs gene expression; however, its contribution to the fundamental process of erythropoiesis remains unclear. hexamethylene bis-acetamide inducible 1 (HEXIM1) regulates RNAPII activity by controlling the location and activity of positive transcription factor β. We identified a key role for HEXIM1 in controlling erythroid gene expression and function, with overexpression of HEXIM1 promoting erythroid proliferation and fetal globin expression. HEXIM1 regulated erythroid proliferation by enforcing RNAPII pausing at cell cycle check point genes and increasing RNAPII occupancy at genes that promote cycle progression. Genome-wide profiling of HEXIM1 revealed that it was increased at both repressed and activated genes. Surprisingly, there were also genome-wide changes in the distribution of GATA-binding factor 1 (GATA1) and RNAPII. The most dramatic changes occurred at the β-globin loci, where there was loss of RNAPII and GATA1 at β-globin and gain of these factors at γ-globin. This resulted in increased expression of fetal globin, and BGLT3, a long noncoding RNA in the β-globin locus that regulates fetal globin expression. GATA1 was a key determinant of the ability of HEXIM1 to repress or activate gene expression. Genes that gained both HEXIM1 and GATA1 had increased RNAPII and increased gene expression, whereas genes that gained HEXIM1 but lost GATA1 had an increase in RNAPII pausing and decreased expression. Together, our findings reveal a central role for universal transcription machinery in regulating key aspects of erythropoiesis, including cell cycle progression and fetal gene expression, which could be exploited for therapeutic benefit.


Conflict of interest statement

Conflict-of-interest disclosure: The authors declare no competing financial interests.

Figures

None
Graphical abstract
Figure 1.
Figure 1.
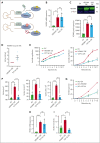
HEXIM1 promotes erythroid proliferation and survival. (A) Diagram of the 7SK complex and pTEFb with WT HEXIM1 (top) and HEXIM1 Y271A (bottom). Phosphorylation of WT HEXIM1 results in dissociation of HEIXM1 from the 7SK complex and release of pTEFb. The Y271A mutation prevents phosphorylation at a key residue, impairing HEXIM1 dissociation and pTEFb release. (B) HEXIM1 messenger RNA (mRNA) levels in HUDEP-2 cells transduced with EV, HEXIM1 OE, or Y271A OE. Data are presented relative to 18S ribosomal RNA. (C) HEXIM1 protein levels in HUDEP-2 cells transduced with EV, HEXIM1 OE, or Y271A OE. A representative western blot (top) and quantitation (bottom) are shown. (D) RNA immunoprecipitation assay for HEXIM1 WT and the Y271A mutant, confirming increased affinity of the Y271A mutant for the 7SK complex. (E) Live fold expansion of HEXIM1 WT, Y271A, and EV transduced cells in expansion media (left) and maturation media (right). (F) Imaging flow cytometric analyses of HEXIM1 WT, Y271A, and EV cell lines measuring cell size (left), nuclear size (middle), and CD235a expression (right). (G) Live fold expansion of HEXIM1 heterozygous cells transduced with EV, HEXIM1 WT, or Y271A in maturation media. (H) HEXIM1 messenger RNA levels in CD34+ hematopoietic stem and progenitor cells transduced with EV, HEXIM1 WT, or Y271A. Data are presented relative to 18S ribosomal RNA. (I) Erythroid colony-forming ability (burst-forming unit erythroid, and colony-forming unit erythroid) after transduction with EV, HEXIM1 WT, or HEXIM1 Y271A. For all experiments, n = minimum of 3 replicates; ∗P < .05; ∗∗P < .005; ∗∗∗P < .0005; ∗∗∗∗P < .00005.
Figure 2.
Figure 2.
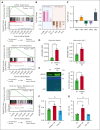
Hexim1 OE promotes fetal globin expression. (A) Selected top enriched gene sets from gene set enrichment analysis including GATA1 target genes, heme metabolism, and fetal liver genes. (B) Expression changes of known regulators of γ production (Lin28b, Arid3a, Tal1, Bcl11a, Myb, Fut8, and Sox6) via RNA sequencing from Murphy et al. (C) RNA expression changes of globin genes in HUDEP-2 in HEXIM1 OE cell lines compared with EV controls via RNA sequencing from Murphy et al. (D) Ratio of γ-globin to total β-globin transcripts in HUDEP-2 cells in expansion media (left) and at maturation day 5 (right). (E) Western blot of γ-globin levels in HUDEP-2 cells at maturation day 10 in HEXIM1 OE and EV cell lines. A representative western blot (left) and quantification (right) are shown. (F) RNA expression of γ-globin in CD36+ primary erythroblasts. Data are presented relative to 18S ribosomal RNA. (G) Quantification of F-cells in EV, HEXIM1 OE, and Y2A OE lines by fluorescence-activated cell sorting analysis in CD36+ primary erythroblasts. (H) Histogram showing distribution of cells expressing different HbF levels. (I) Median HbF expression of the F-cell population. (J) Bcl11a expression in CD36+ primary erythroblasts in indicated cell lines. Data are presented relative to 18S ribosomal RNA. n = minimum of 3 replicates; ∗P < .05; ∗∗P < .005; ∗∗∗P < .0005. ns, not significant.
Figure 2.
Figure 2.
Hexim1 OE promotes fetal globin expression. (A) Selected top enriched gene sets from gene set enrichment analysis including GATA1 target genes, heme metabolism, and fetal liver genes. (B) Expression changes of known regulators of γ production (Lin28b, Arid3a, Tal1, Bcl11a, Myb, Fut8, and Sox6) via RNA sequencing from Murphy et al. (C) RNA expression changes of globin genes in HUDEP-2 in HEXIM1 OE cell lines compared with EV controls via RNA sequencing from Murphy et al. (D) Ratio of γ-globin to total β-globin transcripts in HUDEP-2 cells in expansion media (left) and at maturation day 5 (right). (E) Western blot of γ-globin levels in HUDEP-2 cells at maturation day 10 in HEXIM1 OE and EV cell lines. A representative western blot (left) and quantification (right) are shown. (F) RNA expression of γ-globin in CD36+ primary erythroblasts. Data are presented relative to 18S ribosomal RNA. (G) Quantification of F-cells in EV, HEXIM1 OE, and Y2A OE lines by fluorescence-activated cell sorting analysis in CD36+ primary erythroblasts. (H) Histogram showing distribution of cells expressing different HbF levels. (I) Median HbF expression of the F-cell population. (J) Bcl11a expression in CD36+ primary erythroblasts in indicated cell lines. Data are presented relative to 18S ribosomal RNA. n = minimum of 3 replicates; ∗P < .05; ∗∗P < .005; ∗∗∗P < .0005. ns, not significant.
Figure 3.
Figure 3.
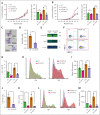
HEXIM1 OE phenotype is dependent on pTEFb activity. (A-B) Growth curves of HEXIM1 OE and EV cell lines and live fold amplification on day 7 in (A) expansion and (B) maturation media with and without NVP2 treatment. (C) Cytospins on maturation day 10 in EV, HEXIM1 OE, and HEXIM1 OE plus NVP2. (D) γ-globin expression in HEXIM1 OE via quantitative polymerase chain reaction with and without NVP2 treatment. Data are presented relative to 18S ribosomal RNA. (E) Levels of serine-2 (Ser2) RNAPII and (hemoglobin subunit gamma (HBG) in HEXIM1 OE cells with and without NVP2 treatment. (F) HbF-expressing HUDEP-2 cells at maturation day 5 in the indicated cell lines with and without NVP2 treatment via FACS analysis. (G) Quantification of F-cell percentage in the indicated cell lines with and without NVP2 treatment. (H) Distribution of HbF expression level in the indicated cell lines with and without NVP2 treatment. (I) Quantification of the median HbF expression level in the HbF+ population in the indicated cell lines with and without NVP2 treatment. (J) Proportion of green fluorescent protein–positive (GFP+) HEXIM1 OE cells after 2 days of treatment with either NVP2 or dimethyl sulfoxide (DMSO). The number of GFP+ HEXIM1 OE cells was identical before treatment. (K) Proportion of F-cells in GFP+ HEXIM1 OE primary erythroblasts treated with NVP2 or DMSO. (L) Distribution of HbF expression level in the indicated cell lines with and without NVP2 treatment. (M) Median HbF expression levels in GFP+ EV or HEXIM1 OE primary erythroblasts with and without NVP2 treatment. n = minimum of 3 replicates. ∗P < .05; ∗∗P < .005; ∗∗∗P < .0005.
Figure 4.
Figure 4.
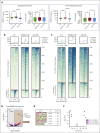
HEXIM1 regulates erythroid gene expression. (A) HEXIM1 occupancy and pausing index (PI) in genes that are upregulated or downregulated in HEXIM1 OE cells. (B-C) Heat maps showing regions that have differential (B) total and (C) serine-5 (Ser5) RNAPII occupancy in EV, HEXIM1 WT OE, and Y271A OE cell lines. (D) Volcano plot of differential total RNAPII occupancy in HEXIM1 OE cells compared with EV controls. (E) Top 5 motifs enriched for genomic regions that significantly gained RNAPII occupancy in HEXIM1 OE lines compared with EV controls. (F) Principal component (PC) analysis plot for total RNAPII in EV, HEXIM1 OE, and Y2A OE cell lines. (G) RNAPII occupancy at the β-globin loci in indicated cell lines. (H) Heat map of differential chromatin accessibility in indicated cell lines. (I) Volcano plot of differential chromatin accessibility in HEXIM1 OE cells. (J) Top 5 motifs enriched for genomic regions that become more accessible in HEXIM1 OE cell lines. (K) Gene ontology categories enriched for regions that become more accessible in HEXIM1 OE cell lines. (L) Chromatin accessibility at the β-globin loci in indicated cell lines. (M) BGLT3 RNA expression in indicated cell lines via quantitative polymerase chain reaction. Data are presented relative to 18S ribosomal RNA. ATAC, assay for transposase-accessible chromatin; LCR, locus control region.
Figure 4.
Figure 4.
HEXIM1 regulates erythroid gene expression. (A) HEXIM1 occupancy and pausing index (PI) in genes that are upregulated or downregulated in HEXIM1 OE cells. (B-C) Heat maps showing regions that have differential (B) total and (C) serine-5 (Ser5) RNAPII occupancy in EV, HEXIM1 WT OE, and Y271A OE cell lines. (D) Volcano plot of differential total RNAPII occupancy in HEXIM1 OE cells compared with EV controls. (E) Top 5 motifs enriched for genomic regions that significantly gained RNAPII occupancy in HEXIM1 OE lines compared with EV controls. (F) Principal component (PC) analysis plot for total RNAPII in EV, HEXIM1 OE, and Y2A OE cell lines. (G) RNAPII occupancy at the β-globin loci in indicated cell lines. (H) Heat map of differential chromatin accessibility in indicated cell lines. (I) Volcano plot of differential chromatin accessibility in HEXIM1 OE cells. (J) Top 5 motifs enriched for genomic regions that become more accessible in HEXIM1 OE cell lines. (K) Gene ontology categories enriched for regions that become more accessible in HEXIM1 OE cell lines. (L) Chromatin accessibility at the β-globin loci in indicated cell lines. (M) BGLT3 RNA expression in indicated cell lines via quantitative polymerase chain reaction. Data are presented relative to 18S ribosomal RNA. ATAC, assay for transposase-accessible chromatin; LCR, locus control region.
Figure 5.
Figure 5.
HEXIM1 OE regulates erythroid cell cycle progression by promoting both RNAPII pausing and recruitment. (A) Heat map of paused genes in EV, HEXIM1 OE, and Y271A OE cell lines; values represent z score of the average PI in the corresponding cell line; unsupervised k-means clustering was performed to acquire clusters of genes with different pausing status in each line. (B) Enriched pathways for the clusters of genes with a higher PI in HEXIM1 OE cell lines. (C) PI of gene sets cell cycle arrest genes” and cell cycle checkpoint genes. (D) Doubling time of EV, HEXIM1 OE, and Y2A OE HUDEP-2 cells. (E) Scheme of key regulators of S-phase entry. (F) Changes of chromatin accessibility, HEXIM1, and RNAPII occupancy at CCNE2 via ATAC sequencing and CUT&RUN. (G-H) Representative western blot (G) and quantification (H) of key regulators of G1/S phase progression; additional regulators are shown in supplemental Figure 10E. (I) Cell cycle analyses in HUDEP-2 and CD36+ selected primary erythroblasts via 5-bromo-2-deoxyuridine staining. n = minimum of 3 replicates; ∗P < .05; ∗∗P < .005.
Figure 5.
Figure 5.
HEXIM1 OE regulates erythroid cell cycle progression by promoting both RNAPII pausing and recruitment. (A) Heat map of paused genes in EV, HEXIM1 OE, and Y271A OE cell lines; values represent z score of the average PI in the corresponding cell line; unsupervised k-means clustering was performed to acquire clusters of genes with different pausing status in each line. (B) Enriched pathways for the clusters of genes with a higher PI in HEXIM1 OE cell lines. (C) PI of gene sets cell cycle arrest genes” and cell cycle checkpoint genes. (D) Doubling time of EV, HEXIM1 OE, and Y2A OE HUDEP-2 cells. (E) Scheme of key regulators of S-phase entry. (F) Changes of chromatin accessibility, HEXIM1, and RNAPII occupancy at CCNE2 via ATAC sequencing and CUT&RUN. (G-H) Representative western blot (G) and quantification (H) of key regulators of G1/S phase progression; additional regulators are shown in supplemental Figure 10E. (I) Cell cycle analyses in HUDEP-2 and CD36+ selected primary erythroblasts via 5-bromo-2-deoxyuridine staining. n = minimum of 3 replicates; ∗P < .05; ∗∗P < .005.
Figure 6.
Figure 6.
HEXIM1 OE results in redistribution of GATA1 occupancy. (A) Heat map of differential GATA1 occupancy in EV, HEXIM1 OE, and Y271A OE lines. (B) PC analysis plot based on GATA1 occupancy in EV, HEXIM1 OE, and Y271A OE cell lines. (C) Volcano plot of differential GATA1 occupancy in EV and HEXIM1 OE cells. (D) Motif analysis of GATA1 binding sites gained in HEXIM1 OE cells. (E) GATA1, Ser5, and total RNAPII occupancy at the β-globin locus in indicated cell lines. (F) Gene ontology terms enriched for genomic regions that gained GATA1 in HEXIM1 OE cells. (G) Genomic annotation of gained GATA1 binding sites. (H) Venn diagram showing overlap of GATA1 occupancy in HEXIM1 OE and EV lines (left), and chromatin accessibility at GATA1 sites gained in HEXIM1 OE lines (right). (I) Chromatin accessibility levels in WT HUDEP-2 cells at previously established and gained GATA1 sites (left) and H3K27ac occupancy in WT HUDEP-2 cells at previously established and gained GATA1 sites (right). (J) Heat maps showing chromatin accessibility and H3K27ac at gained and shared GATA1 sites in WT HUDEP-2 cells. (K) Quantification of chromatin accessibility (top) and H3K27ac occupancy (bottom) at shared and gained GATA1 sites. (L) Examples of RUNXT1, which gained GATA1 occupancy, chromatin accessibility, and RNAPII occupancy at the promoter region; and BCL11a, which lost both GATA1 and RNAPII occupancy at the well-established +55 enhancer region. (M) Venn diagrams showing the open chromatin regions in HUDEP-1 and HUDEP-2 cell lines. (N) GATA1 occupancy at the HUDEP-1 or HUDEP-2 only open chromatin regions in the EV, HEXIM1 OE, and Y271A OE cell lines. HBB, hemoglobin subunit beta; HBG, hemoglobin subunit gamma; UTR, untranslated region.
Figure 6.
Figure 6.
HEXIM1 OE results in redistribution of GATA1 occupancy. (A) Heat map of differential GATA1 occupancy in EV, HEXIM1 OE, and Y271A OE lines. (B) PC analysis plot based on GATA1 occupancy in EV, HEXIM1 OE, and Y271A OE cell lines. (C) Volcano plot of differential GATA1 occupancy in EV and HEXIM1 OE cells. (D) Motif analysis of GATA1 binding sites gained in HEXIM1 OE cells. (E) GATA1, Ser5, and total RNAPII occupancy at the β-globin locus in indicated cell lines. (F) Gene ontology terms enriched for genomic regions that gained GATA1 in HEXIM1 OE cells. (G) Genomic annotation of gained GATA1 binding sites. (H) Venn diagram showing overlap of GATA1 occupancy in HEXIM1 OE and EV lines (left), and chromatin accessibility at GATA1 sites gained in HEXIM1 OE lines (right). (I) Chromatin accessibility levels in WT HUDEP-2 cells at previously established and gained GATA1 sites (left) and H3K27ac occupancy in WT HUDEP-2 cells at previously established and gained GATA1 sites (right). (J) Heat maps showing chromatin accessibility and H3K27ac at gained and shared GATA1 sites in WT HUDEP-2 cells. (K) Quantification of chromatin accessibility (top) and H3K27ac occupancy (bottom) at shared and gained GATA1 sites. (L) Examples of RUNXT1, which gained GATA1 occupancy, chromatin accessibility, and RNAPII occupancy at the promoter region; and BCL11a, which lost both GATA1 and RNAPII occupancy at the well-established +55 enhancer region. (M) Venn diagrams showing the open chromatin regions in HUDEP-1 and HUDEP-2 cell lines. (N) GATA1 occupancy at the HUDEP-1 or HUDEP-2 only open chromatin regions in the EV, HEXIM1 OE, and Y271A OE cell lines. HBB, hemoglobin subunit beta; HBG, hemoglobin subunit gamma; UTR, untranslated region.
Figure 7.
Figure 7.
Changes in GATA1 occupancy determine whether HEXIM1 promotes RNAPII recruitment or enforces RNAPII pausing. (A) Three-dimensional correlation plot between HEXIM1, GATA1, RNAPII occupancy, and chromatin accessibility. Each dot represents a gene; the red color gradient represents HEXIM1 occupancy; x-axis represents GATA1 occupancy, y-axis represents RNAPII occupancy, and z-axis represents chromatin accessibility. (B) Heat map showing gained GATA1 sites also gained RNAPII and HEXIM1 occupancy and chromatin accessibility in HEXIM1 OE cells. (C) Quantification of changes in GATA1, RNAPII, HEXIM1 occupancy, and chromatin accessibility at gained GATA1 sites. (D-F) GATA1, HEXIM1 occupancy, and PI at genes for which the PI increases more than twofold in the indicated cell lines. (G) GATA1 occupancy at downregulated genes in the indicated cell lines. (H) Profiles of GATA1 and RNAPII occupancy at paused genes. At paused genes there is loss of GATA1 (top). There is also increased ser5 RNAPII at the promoter and decreased ser5 RNAPII in the gene body (bottom), resulting in an increased PI. (I) Examples of enhanced RNAPII recruitment facilitated by increased GATA1 occupancy (left), and enhanced pausing facilitated by decreased GATA1 (right).
Figure 7.
Figure 7.
Changes in GATA1 occupancy determine whether HEXIM1 promotes RNAPII recruitment or enforces RNAPII pausing. (A) Three-dimensional correlation plot between HEXIM1, GATA1, RNAPII occupancy, and chromatin accessibility. Each dot represents a gene; the red color gradient represents HEXIM1 occupancy; x-axis represents GATA1 occupancy, y-axis represents RNAPII occupancy, and z-axis represents chromatin accessibility. (B) Heat map showing gained GATA1 sites also gained RNAPII and HEXIM1 occupancy and chromatin accessibility in HEXIM1 OE cells. (C) Quantification of changes in GATA1, RNAPII, HEXIM1 occupancy, and chromatin accessibility at gained GATA1 sites. (D-F) GATA1, HEXIM1 occupancy, and PI at genes for which the PI increases more than twofold in the indicated cell lines. (G) GATA1 occupancy at downregulated genes in the indicated cell lines. (H) Profiles of GATA1 and RNAPII occupancy at paused genes. At paused genes there is loss of GATA1 (top). There is also increased ser5 RNAPII at the promoter and decreased ser5 RNAPII in the gene body (bottom), resulting in an increased PI. (I) Examples of enhanced RNAPII recruitment facilitated by increased GATA1 occupancy (left), and enhanced pausing facilitated by decreased GATA1 (right).

Comment in

References

    1. Murphy Z, Murphy K, Myers JA, et al. Regulation of RNA polymerase II activity is essential for terminal erythroid maturation. Blood. 2021;138(18):1740–1756. - PMC - PubMed
    1. Cantor AB, Orkin SH. Transcriptional regulation of erythropoiesis: an affair involving multiple partners. Oncogene. 2002;21(21):3368–3376. - PubMed
    1. Wells M, Steiner L. Epigenetic and transcriptional control of erythropoiesis. Front Genet. 2022;13:805265. - PMC - PubMed
    1. Rahl PB, Lin CY, Seila AC, et al. c-Myc regulates transcriptional pause release. Cell. 2010;141(3):432–445. - PMC - PubMed
    1. Zhou Q, Chang H, Zhang H, Han Y, Liu H. RNA polymerase II elongation control. Diagn Pathol. 2012;7:119–143. - PubMed

Publication types

MeSH terms