. 2023 Nov 30;142(22):1879-1894.
doi: 10.1182/blood.2023020142.

EGR1-mediated metabolic reprogramming to oxidative phosphorylation contributes to ibrutinib resistance in B-cell lymphoma

Affiliations

EGR1-mediated metabolic reprogramming to oxidative phosphorylation contributes to ibrutinib resistance in B-cell lymphoma

Yunxia Liu et al. Blood. .

Abstract

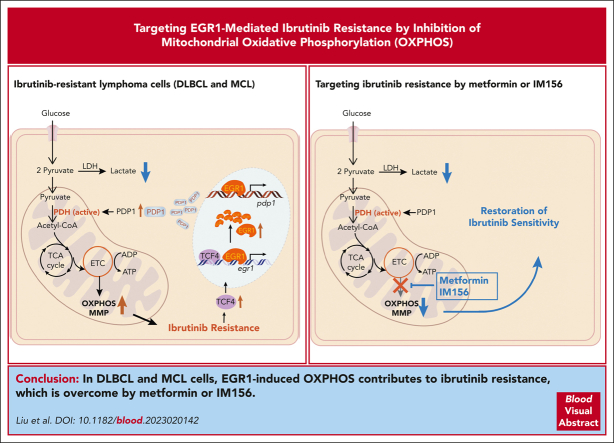
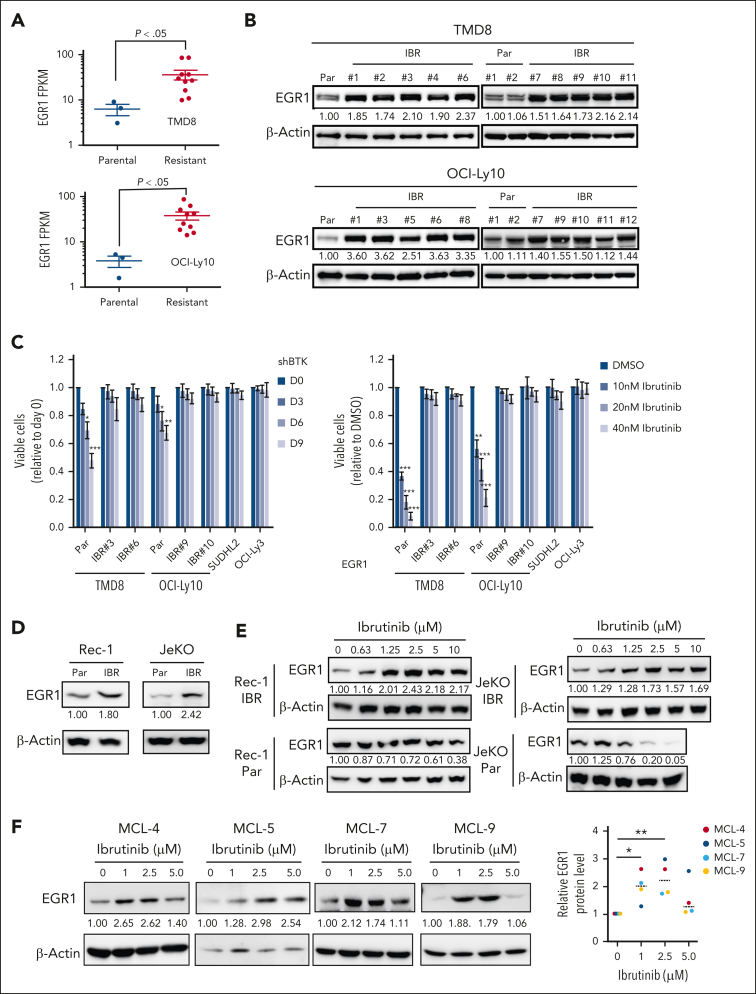
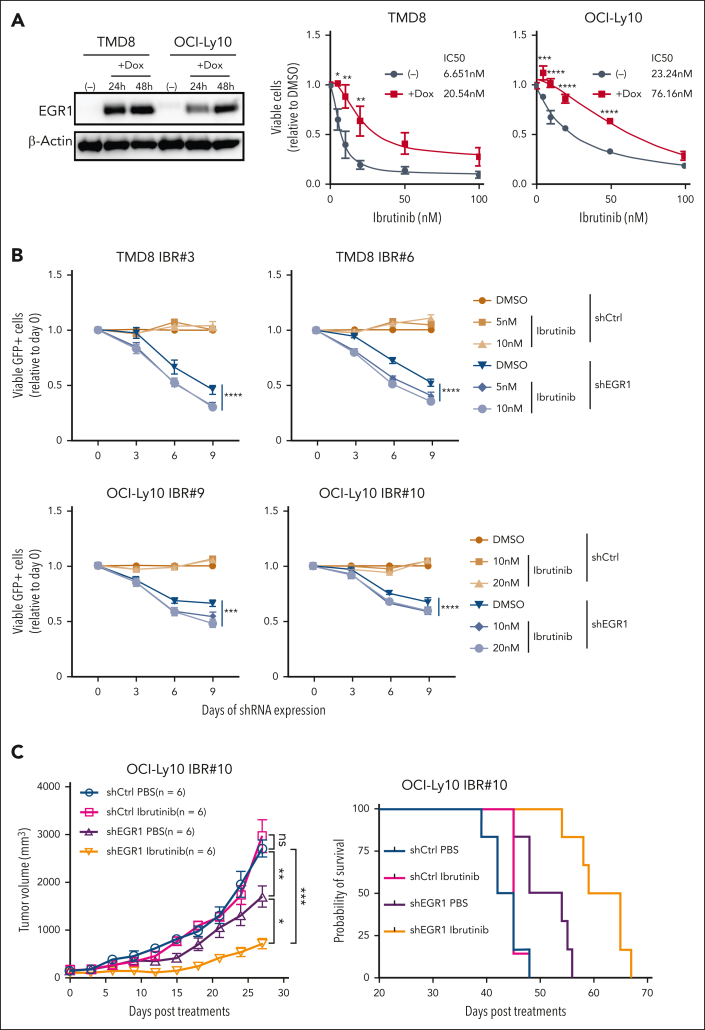
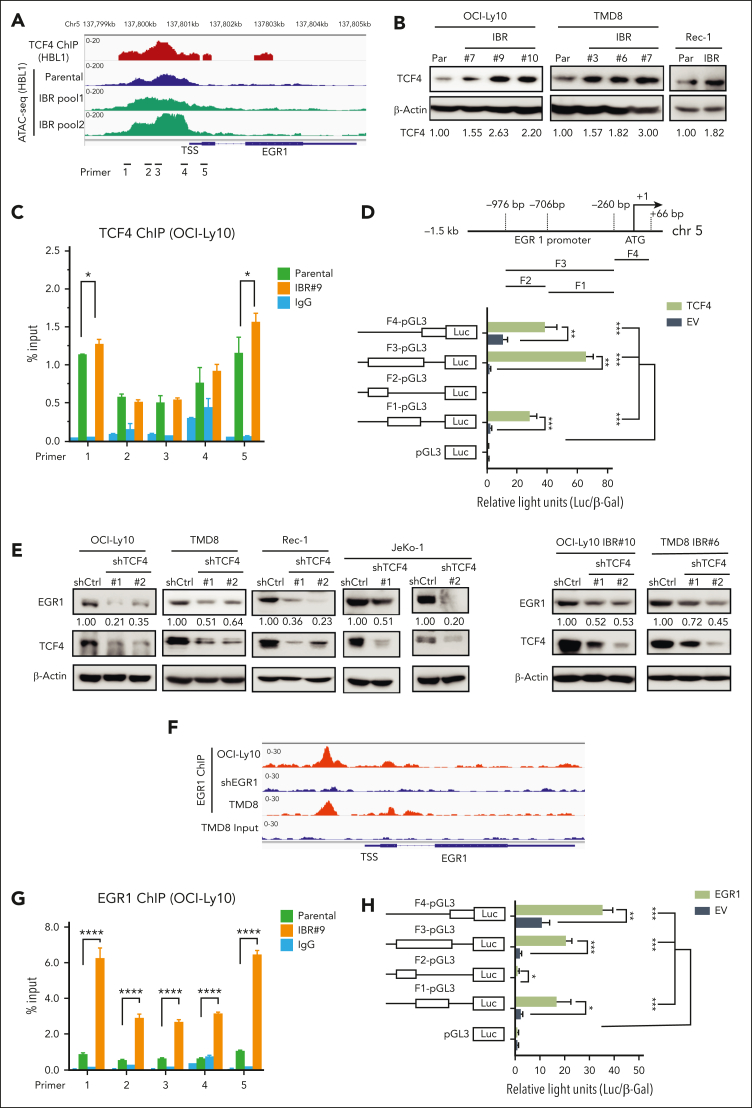
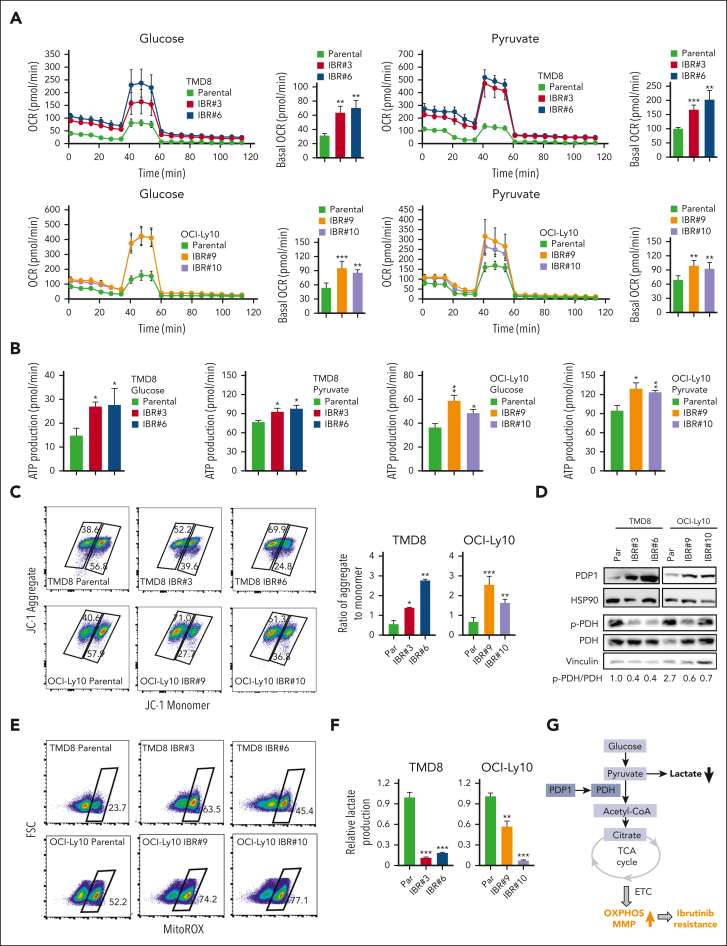
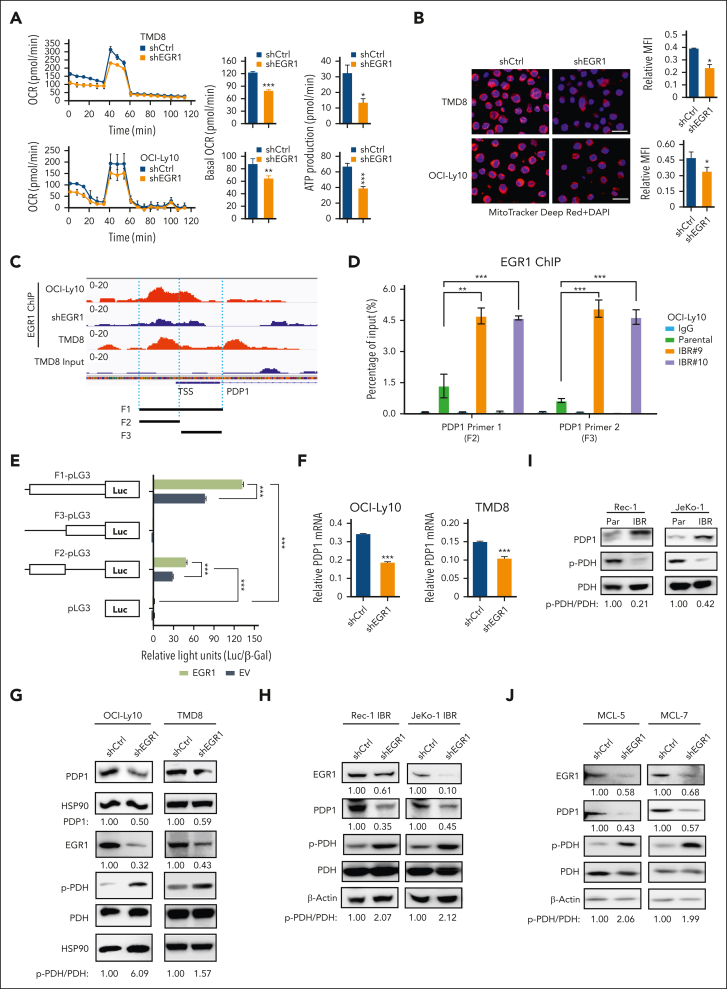
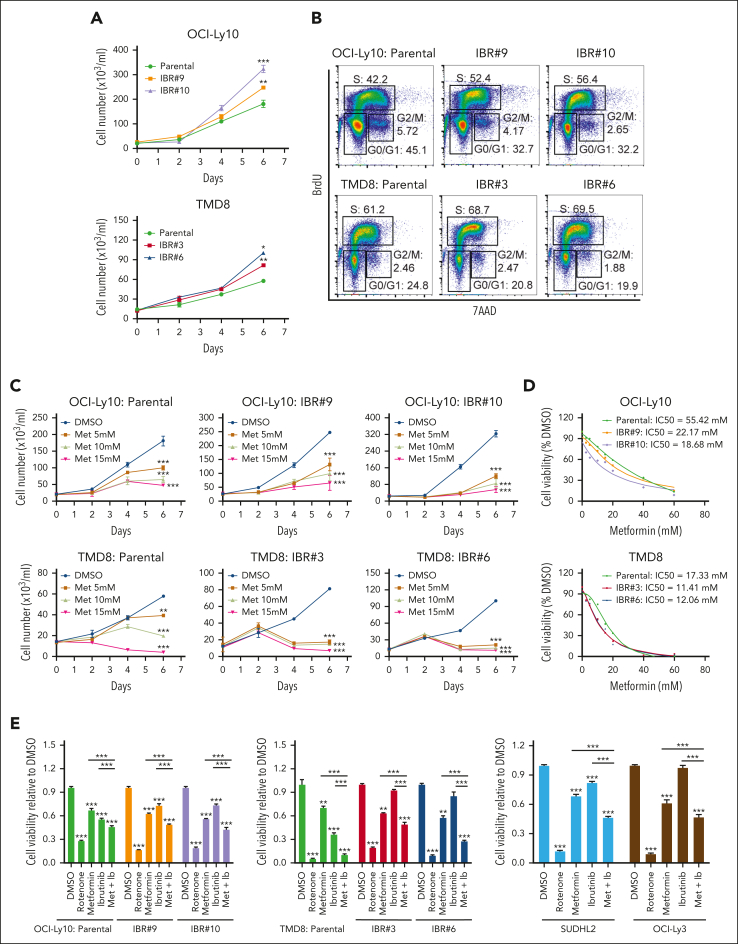
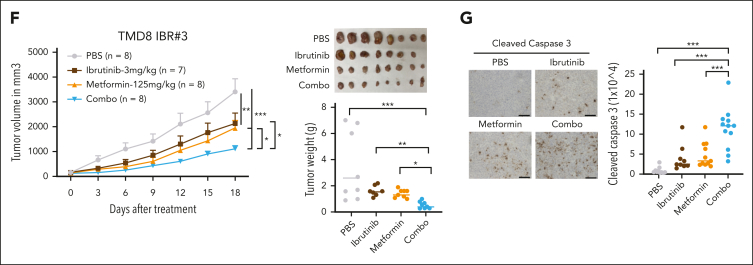
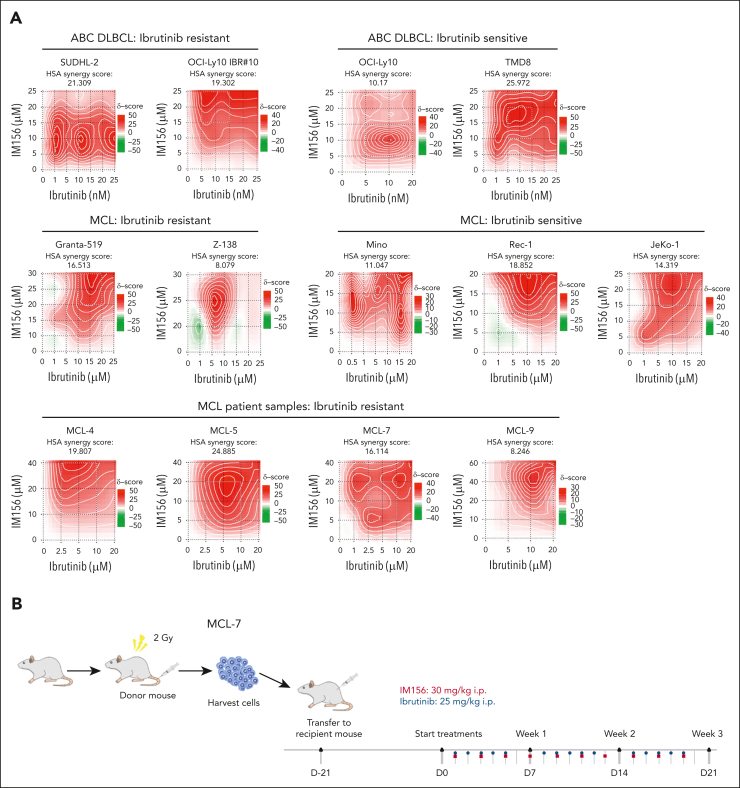
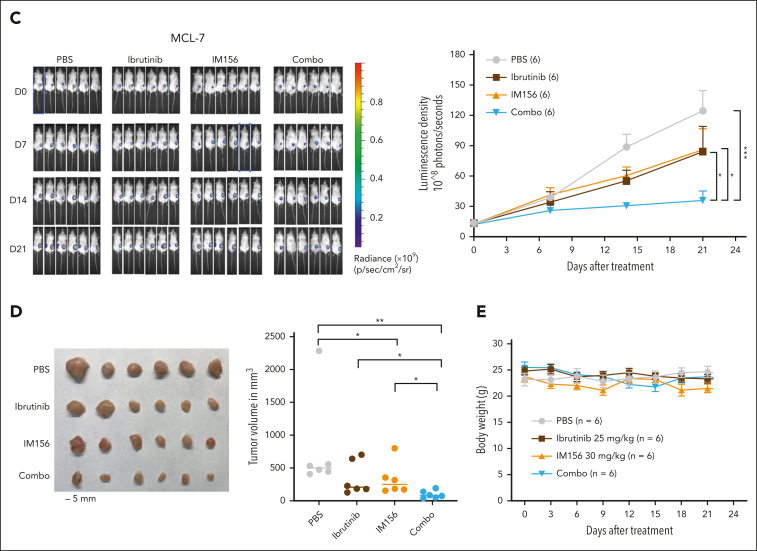
The use of Bruton tyrosine kinase inhibitors, such as ibrutinib, to block B-cell receptor signaling has achieved a remarkable clinical response in several B-cell malignancies, including mantle cell lymphoma (MCL) and diffuse large B-cell lymphoma (DLBCL). Acquired drug resistance, however, is significant and affects the long-term survival of these patients. Here, we demonstrate that the transcription factor early growth response gene 1 (EGR1) is involved in ibrutinib resistance. We found that EGR1 expression is elevated in ibrutinib-resistant activated B-cell-like subtype DLBCL and MCL cells and can be further upregulated upon ibrutinib treatment. Genetic and pharmacological analyses revealed that overexpressed EGR1 mediates ibrutinib resistance. Mechanistically, TCF4 and EGR1 self-regulation induce EGR1 overexpression that mediates metabolic reprogramming to oxidative phosphorylation (OXPHOS) through the transcriptional activation of PDP1, a phosphatase that dephosphorylates and activates the E1 component of the large pyruvate dehydrogenase complex. Therefore, EGR1-mediated PDP1 activation increases intracellular adenosine triphosphate production, leading to sufficient energy to enhance the proliferation and survival of ibrutinib-resistant lymphoma cells. Finally, we demonstrate that targeting OXPHOS with metformin or IM156, a newly developed OXPHOS inhibitor, inhibits the growth of ibrutinib-resistant lymphoma cells both in vitro and in a patient-derived xenograft mouse model. These findings suggest that targeting EGR1-mediated metabolic reprogramming to OXPHOS with metformin or IM156 provides a potential therapeutic strategy to overcome ibrutinib resistance in relapsed/refractory DLBCL or MCL.


Conflict of interest statement

Conflict-of-interest disclosure: C.M.C. receives honorarium for advisory board membership for Bayer, Elephas, Nektar Therapeutics, Novartis, and WiCell Research Institute, which had no input in the study design, analysis, manuscript preparation, or decision to submit for publication. The remaining authors declare no competing financial interests.

Thomas A. Waldmann died on 25 September 2021.

Figures

None
Graphical abstract
Figure 1.
Figure 1.
EGR1 expression is elevated and further upregulated upon ibrutinib treatment in ibrutinib-resistant cells. (A) RNA-seq analysis shows significantly increased EGR1 expression in ibrutinib-resistant cell clones (IBR; 10 clones) compared with that in the parental (Par) cells (3 replicates). (B) Immunoblot analysis shows increased EGR1 protein levels in IBR clones. (C) IBR clones are not sensitive to BTK shRNA (left) or ibrutinib (right). SUDHL2 and OCI-Ly3 are ibrutinib-resistant cell lines used as controls. Error bars represent mean ± standard deviation (SD) (∗P < .05; ∗∗P < .01; ∗∗∗P < .001; n = 3). (D) Immunoblot analysis shows increased EGR1 protein levels in IBR clones. (E) Immunoblot analysis shows increased EGR1 expression in resistant cells but reduced EGR1 expression in parental cells after 72 hours of ibrutinib treatment. (F) Immunoblot analysis shows increased EGR1 protein levels after 72 hours of ibrutinib treatment in all 4 patient samples. Protein bands were quantified by densitometry (∗P < .05; ∗∗P < .01). β-actin served as a loading control for all immunoblot experiments. DMSO, dimethyl sulfoxide; FPKM, fragments per kilobase of transcript per million mapped reads.
Figure 2.
Figure 2.
EGR1 mediates ibrutinib resistance. (A) Retroviral EGR1 expression after induction with 20 ng/mL doxycycline (Dox; left). Trypan blue cell viability assay after 3-day ibrutinib treatment with or without induction of EGR1 expression by 20 ng/mL Dox (right). Error bars represent mean ± SD of triplicates (∗P < .05; ∗∗P < .01; ∗∗∗P < .001; ∗∗∗∗P < .0001). (B) Flow cytometric analysis of cell viability of GFP-positive shRNA-expressing cells for up to 9 days of EGR1 shRNA or control shRNA expression in the presence of ibrutinib or DMSO control. Error bars represent mean ± SD of triplicates (∗∗∗P < .001; ∗∗∗∗P < .0001). (C) Ibrutinib-resistant ABC DLBCL xenografts. OCI-Ly10 ibrutinib-resistant cells were established as a subcutaneous tumor (average, 150 mm3) in NSG mice, and then treated with 3 mg/kg ibrutinib (intraperitoneally.) daily for 4 weeks or PBS vehicle. EGR1 shRNA or control shRNA expression was induced with 2 mg/mL Dox in drinking water. Tumor volume and the survival of recipient mice in each group are shown. Error bars represent mean ± standard error of the mean (SEM); two-way analysis of variance [ANOVA], ∗P < .05; ∗∗P < .01; ∗∗∗P < .001).
Figure 3.
Figure 3.
TCF4 and EGR1 self-regulation mediate EGR1 overexpression in ibrutinib-resistant cells. (A) The peaks of TCF4 ChIP-seq in HBL1 ABC DLBCL cells and ATAC-seq in the ibrutinib-resistant pool and parental HBL1 cells located at genomic regions of the EGR1 gene from a recent study. (B) Immunoblot analysis of TCF4 expression in ibrutinib-resistant cells of OCI-Ly10, TMD8, and Rec-1 compared with that in their parent cells. β-actin served as a loading control. (C) TCF4 ChIP-qPCR analysis with the indicated 5 pairs of primers for the EGR1 promoter and transcription start site regions. Immunoglobulin G (IgG) served as a control. Error bars represent mean ± SD (∗P < .05; n = 3). (D) TCF4 binds to the EGR1 promoter region (top) and induces EGR1 transcription by a standard dual luciferase reporter gene assay in 293T cells (bottom) (∗∗P < .01; ∗∗∗P < .001; n = 3). Firefly luciferase activity from the pGL3 basic reporter was normalized with β-galactosidase activity. (E) Immunoblot analysis of EGR1 and TCF4 expression after knockdown of TCF4 by 2 shRNAs or a control shRNA. β-Actin served as a loading control. (F) The peaks of EGR1 ChIP-seq OCI-Ly10 or TMD8 cells on genomic regions of the EGR1 gene from our recent study. EGR1 shRNA expression sample served as a ChIP control in OCI-Ly10 cell line. (G) EGR1 ChIP-qPCR analysis with the same EGR1 primers as in panel C. IgG served as a control. Error bars represent mean ± SD (∗∗∗∗P < .0001; n = 3). (H) EGR1 binds to its own promoter region for transcription. The same luciferase reporter gene constructs were used as in panel D (∗P < .05; ∗∗P < .01; ∗∗∗P < .001; n = 3). Firefly luciferase activity from the pGL3 basic reporter was normalized with β-galactosidase activity.
Figure 4.
Figure 4.
Metabolic reprogramming to OXPHOS is a hallmark of ibrutinib resistance. (A) OCRs were determined by a Seahorse XFe96 extracellular flux analyzer. Increased basal OCRs in IBRs compared with Par cells. Error bars represent mean ± SD (∗∗P < .01; ∗∗∗P < .001; n = 3). (B) Increased ATP production in IBRs compared with that in the Par cells. Error bars represent mean ± SD (∗P < .05; ∗∗P < .01; n = 3). (C) Flow cytometric analyses of MMP by incorporation of 5,5,6,6'-tetrachloro-1,1',3,3' tetraethylbenzimi-dazoylcarbocyanine iodide (JC1) dye. The ratio of aggregate to monomer is shown. Error bars represent mean ± SD (∗P < .05; ∗∗P < .01; ∗∗∗P < .001; n = 3). (D) Immunoblot analysis of PDP1, p-PDH, and PDH. HSP90 or vinculin served as a loading control. (E) Flow cytometric analysis of reactive oxygen species (ROS) production using MitoSOX dye. Data represent 3 independent experiments. (F) Reduced relative lactate production in IBRs compared with that in the Par cells. Error bars represent mean ± SD (∗∗P < .01; ∗∗∗P < .001; n = 3). (G) Schematic illustration of metabolic reprogramming to OXPHOS in ibrutinib resistance. ETC, electron transport chain; FSC, forward scatter; LDH, lactate dehydrogenase; TCA, trichloroacetic acid.
Figure 5.
Figure 5.
EGR1 upregulates PDP1 expression to promote OXPHOS. (A) OCRs were determined by Seahorse XFe96 extracellular flux analyzer. Reduced basal OCR and ATP production after EGR1 knockdown in ABC DLBCL cells. Error bars represent mean ± SD of 3 replicates (∗P < .05; ∗∗P < .01; ∗∗∗P < .001). (B) Reduced MMP after EGR1 knockdown. Representative images of colocalized mitochondrial tracker Deep Red and 4′,6-diamidino-2-phenylindole (DAPI) nuclear staining in the indicated cells. Mean fluorescence intensity (MFI) of MitoTracker Deep Red relative to DAPI nuclear DNA staining was determined by NIH ImageJ. Error bars represent mean ± SD (∗P < .05; n = 3). Scale bar, 20 μm. (C) EGR1 ChIP-seq data show EGR1 binding peaks on the PDP1 promoter region. (D) EGR1 ChIP-qPCR analysis with 2 pairs of primers (F2 and F3) for the PDP1 promoter core regions. IgG served as a control. Error bars represent mean ± SD (∗∗P < .01; ∗∗∗P < .001; n = 3). (E) EGR1 induces PDP1 transcription by a standard dual luciferase reporter gene assay in 293T cells (∗∗∗P < .001; n = 3). Firefly luciferase activity from the pGL3 basic reporter was normalized with β-galactosidase activity. (F) Real-time PCR for PDP1 mRNA expression relative to β-actin. Error bars represent mean ± SD of 3 replicates (∗∗∗P < .001). (G) Immunoblot analysis of PDP1, p-PDH, and PDH expression after EGR1 knockdown in ABC DLBCL cells. HSP90 served as a loading control. (H) Immunoblot analysis of PDP1, p-PDH, and PDH expression after EGR1 knockdown in the ibrutinib-resistant MCL cell lines. β-actin served as a loading control. (I) Immunoblot analysis of PDP1, p-PDH, and PDH expression in MCL parental and ibrutinib-resistant cells. β-actin served as a loading control. (J) Immunoblot analysis of PDP1, p-PDH, and PDH expression after EGR1 knockdown in the ibrutinib-resistant primary MCL cells. β-actin served as a loading control. TSS, transcription start site.
Figure 6.
Figure 6.
Metformin inhibits the proliferation and growth of ibrutinib-resistant cells. (A) The advantage of ibrutinib-resistant cells in cell growth over parental cells. The cell number was counted by trypan blue staining. Error bars represent mean ± SD of 3 replicates (∗P < .05; ∗∗P < .01; ∗∗∗P < .001). (B) Cell cycle analysis by flow cytometry after 4 hours of BrdU incorporation in the indicated cell lines. Data represent 3 independent experiments. (C) Reduced cell number after metformin treatment in parental and resistant cells by trypan blue staining. Error bars represent mean ± SD (∗∗P < .01; ∗∗∗P < .001; n = 3). (D) The resistant cells are more sensitive to metformin treatment than parental cells, based on the CellTiter-Glo luminescent cell viability assay. IC50 was calculated by GraphPad Prism (9.0) using a 4-parameter nonlinear regression model. (E) CellTiter-Glo luminescent cell viability assay shows that metformin restores the sensitivity of the resistant cells to ibrutinib treatment. Cells were treated with 1 μM rotenone (control), 5 mM metformin, 10 nM ibrutinib, or a combination of metformin and ibrutinib. Rotenone was used as a strong inhibitor of complex I of the mitochondrial respiratory chain (MRC). SUDHL2 and OCI-Ly3 are primary ibrutinib-resistant cells. Error bars represent mean ± SD (one-way ANOVA, ∗P < .05; ∗∗P < .01; ∗∗∗P < .001; n = 3). (F) Ibrutinib-resistant ABC DLBCL xenografts. TMD8 ibrutinib-resistant cells were established as a subcutaneous tumor (average, 150 mm3) in NSG mice and then treated with 3 mg/kg ibrutinib (intraperitoneally) daily, 125 mg/kg metformin (met; intraperitoneally) daily, or with a combination of the 2 drugs until the end point (day 18). Error bars represent mean ± SEM (two-way ANOVA, ∗P < .05; ∗∗ P < .01; ∗∗∗P < .001). (G) Immunohistochemical analysis of cleaved caspase 3 in tumor tissues (∗∗∗P < .001). Representative images of each group are shown. Scale bar, 100 μm. Combo, combination.
Figure 6.
Figure 6.
Metformin inhibits the proliferation and growth of ibrutinib-resistant cells. (A) The advantage of ibrutinib-resistant cells in cell growth over parental cells. The cell number was counted by trypan blue staining. Error bars represent mean ± SD of 3 replicates (∗P < .05; ∗∗P < .01; ∗∗∗P < .001). (B) Cell cycle analysis by flow cytometry after 4 hours of BrdU incorporation in the indicated cell lines. Data represent 3 independent experiments. (C) Reduced cell number after metformin treatment in parental and resistant cells by trypan blue staining. Error bars represent mean ± SD (∗∗P < .01; ∗∗∗P < .001; n = 3). (D) The resistant cells are more sensitive to metformin treatment than parental cells, based on the CellTiter-Glo luminescent cell viability assay. IC50 was calculated by GraphPad Prism (9.0) using a 4-parameter nonlinear regression model. (E) CellTiter-Glo luminescent cell viability assay shows that metformin restores the sensitivity of the resistant cells to ibrutinib treatment. Cells were treated with 1 μM rotenone (control), 5 mM metformin, 10 nM ibrutinib, or a combination of metformin and ibrutinib. Rotenone was used as a strong inhibitor of complex I of the mitochondrial respiratory chain (MRC). SUDHL2 and OCI-Ly3 are primary ibrutinib-resistant cells. Error bars represent mean ± SD (one-way ANOVA, ∗P < .05; ∗∗P < .01; ∗∗∗P < .001; n = 3). (F) Ibrutinib-resistant ABC DLBCL xenografts. TMD8 ibrutinib-resistant cells were established as a subcutaneous tumor (average, 150 mm3) in NSG mice and then treated with 3 mg/kg ibrutinib (intraperitoneally) daily, 125 mg/kg metformin (met; intraperitoneally) daily, or with a combination of the 2 drugs until the end point (day 18). Error bars represent mean ± SEM (two-way ANOVA, ∗P < .05; ∗∗ P < .01; ∗∗∗P < .001). (G) Immunohistochemical analysis of cleaved caspase 3 in tumor tissues (∗∗∗P < .001). Representative images of each group are shown. Scale bar, 100 μm. Combo, combination.
Figure 7.
Figure 7.
Targeting OXPHOS with IM156 restores the sensitivity of the resistant cells to ibrutinib treatment. (A) Synergistic assay in the indicated cell lines and samples from patients with MCL. Synergistic scores were calculated by SynergyFinder 2.0. A score >0 (pink) indicated a synergistic effect of the 2 drugs. (B) Schematic illustration of PDXs of MCL and the treatment procedure. (C) PDXs of MCL. Freshly collected MCL-7 cells were inoculated subcutaneously into NSG mice, and tumor signals were monitored by the Xenogen IVIS Imaging System (Caliper Life) until they reached ∼1 × 108 radiance ps−1 cm2 sr−1, then treated with 25 mg/kg ibrutinib (intraperitoneally) at 5 days a week, 30 mg/kg IM156 (intraperitoneally) every other day for 3 weeks, or with a combination of the 2 drugs. Bioluminescence images of mice before and after treatment (left) and tumor growth curves (right) are shown. The color scale depicts the photon flux (photons per second) emitted by tumors. Error bars represent mean ± SEM (two-way ANOVA, ∗P < .05; ∗∗∗P < .001). (D) Shown are photographs of tumors (left) and tumor volumes (right) from each group on day 21 (∗P < .05; ∗∗P < .01). (E) No significant mouse body weight changes were observed during treatment.
Figure 7.
Figure 7.
Targeting OXPHOS with IM156 restores the sensitivity of the resistant cells to ibrutinib treatment. (A) Synergistic assay in the indicated cell lines and samples from patients with MCL. Synergistic scores were calculated by SynergyFinder 2.0. A score >0 (pink) indicated a synergistic effect of the 2 drugs. (B) Schematic illustration of PDXs of MCL and the treatment procedure. (C) PDXs of MCL. Freshly collected MCL-7 cells were inoculated subcutaneously into NSG mice, and tumor signals were monitored by the Xenogen IVIS Imaging System (Caliper Life) until they reached ∼1 × 108 radiance ps−1 cm2 sr−1, then treated with 25 mg/kg ibrutinib (intraperitoneally) at 5 days a week, 30 mg/kg IM156 (intraperitoneally) every other day for 3 weeks, or with a combination of the 2 drugs. Bioluminescence images of mice before and after treatment (left) and tumor growth curves (right) are shown. The color scale depicts the photon flux (photons per second) emitted by tumors. Error bars represent mean ± SEM (two-way ANOVA, ∗P < .05; ∗∗∗P < .001). (D) Shown are photographs of tumors (left) and tumor volumes (right) from each group on day 21 (∗P < .05; ∗∗P < .01). (E) No significant mouse body weight changes were observed during treatment.

Comment in

References

    1. Alu A, Lei H, Han X, Wei Y, Wei X. BTK inhibitors in the treatment of hematological malignancies and inflammatory diseases: mechanisms and clinical studies. J Hematol Oncol. 2022;15(1):138. - PMC - PubMed
    1. Wilson WH, Young RM, Schmitz R, et al. Targeting B cell receptor signaling with ibrutinib in diffuse large B cell lymphoma. Nat Med. 2015;21(8):922–926. - PMC - PubMed
    1. Wilson WH, Wright GW, Huang DW, et al. Effect of ibrutinib with R-CHOP chemotherapy in genetic subtypes of DLBCL. Cancer Cell. 2021;39(12):1643–1653.e3. - PMC - PubMed
    1. Nakhoda S, Vistarop A, Wang YL. Resistance to Bruton tyrosine kinase inhibition in chronic lymphocytic leukaemia and non-Hodgkin lymphoma. Br J Haematol. 2023;200(2):137–149. - PMC - PubMed
    1. Woyach JA, Furman RR, Liu TM, et al. Resistance mechanisms for the Bruton's tyrosine kinase inhibitor ibrutinib. N Engl J Med. 2014;370(24):2286–2294. - PMC - PubMed

Publication types

MeSH terms

LinkOut - more resources