. 2023 Oct 27;51(19):10109-10131.
doi: 10.1093/nar/gkad734.

Epigenetic reprogramming of a distal developmental enhancer cluster drives SOX2 overexpression in breast and lung adenocarcinoma

Affiliations

Epigenetic reprogramming of a distal developmental enhancer cluster drives SOX2 overexpression in breast and lung adenocarcinoma

Luis E Abatti et al. Nucleic Acids Res. .

Abstract

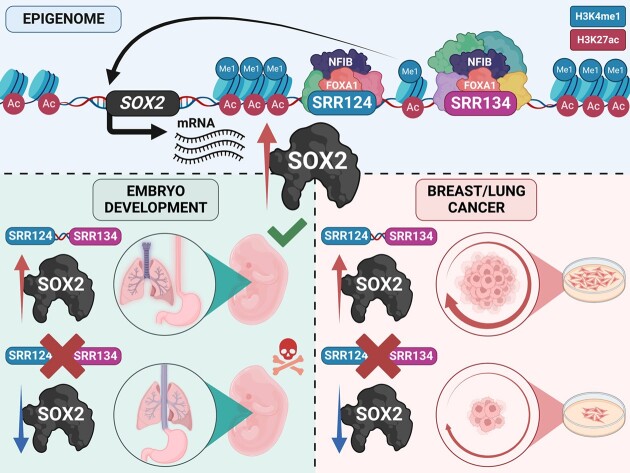
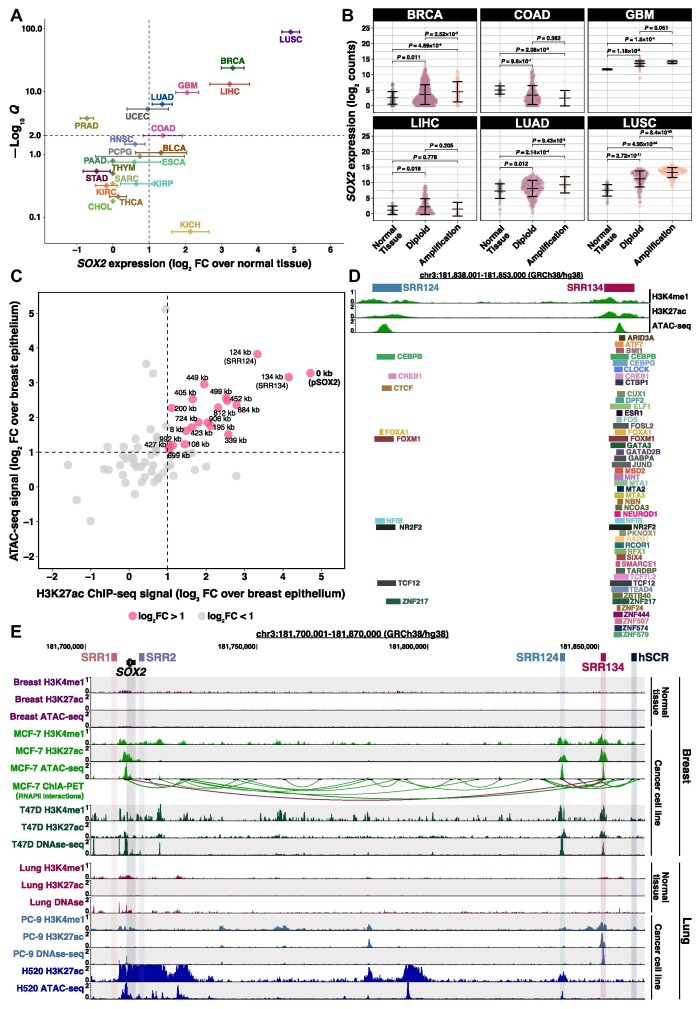
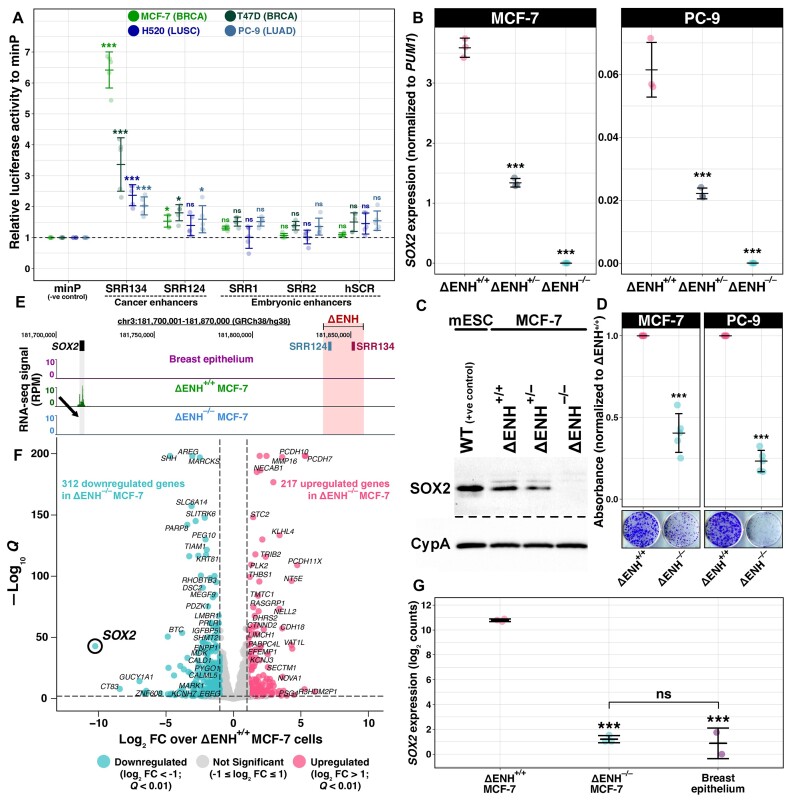
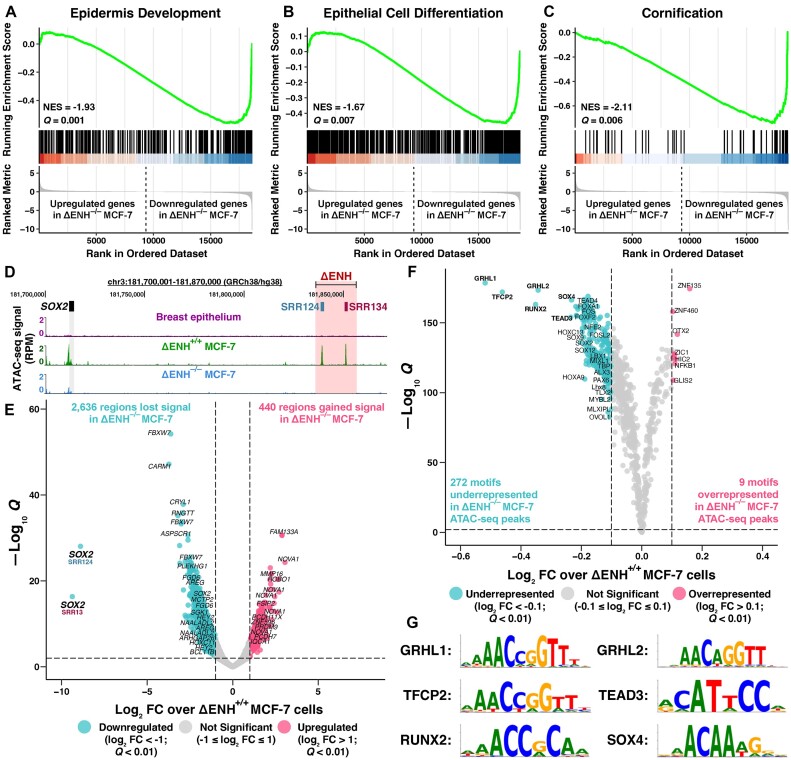
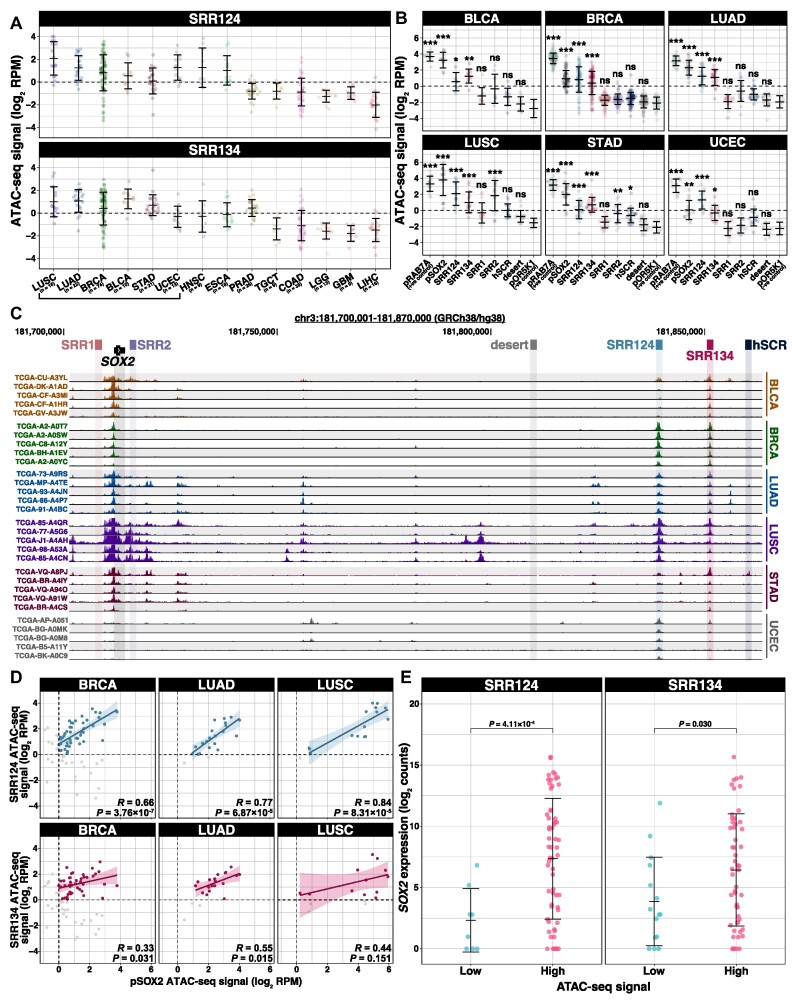
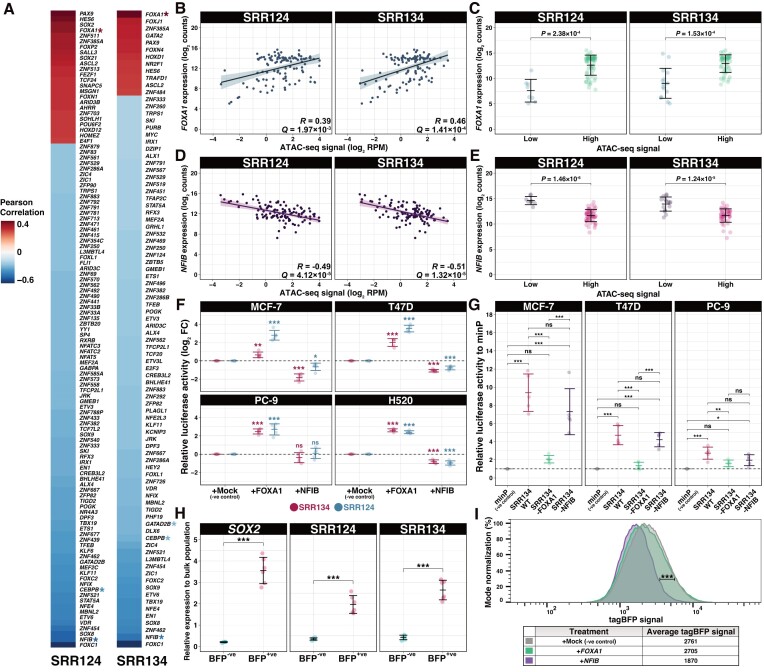
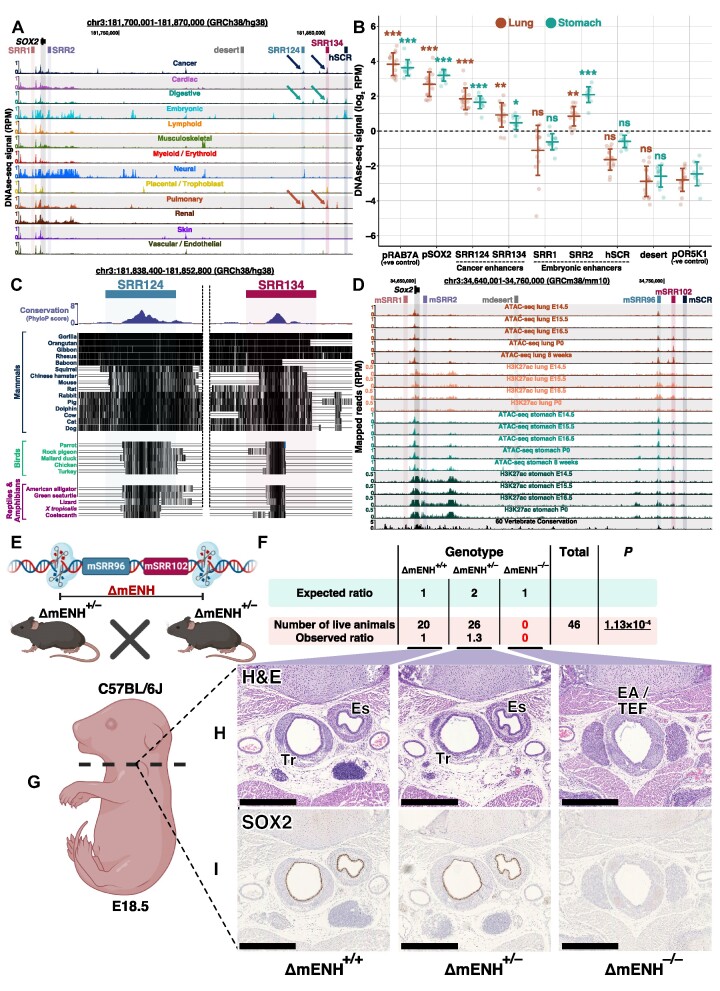
Enhancer reprogramming has been proposed as a key source of transcriptional dysregulation during tumorigenesis, but the molecular mechanisms underlying this process remain unclear. Here, we identify an enhancer cluster required for normal development that is aberrantly activated in breast and lung adenocarcinoma. Deletion of the SRR124-134 cluster disrupts expression of the SOX2 oncogene, dysregulates genome-wide transcription and chromatin accessibility and reduces the ability of cancer cells to form colonies in vitro. Analysis of primary tumors reveals a correlation between chromatin accessibility at this cluster and SOX2 overexpression in breast and lung cancer patients. We demonstrate that FOXA1 is an activator and NFIB is a repressor of SRR124-134 activity and SOX2 transcription in cancer cells, revealing a co-opting of the regulatory mechanisms involved in early development. Notably, we show that the conserved SRR124 and SRR134 regions are essential during mouse development, where homozygous deletion results in the lethal failure of esophageal-tracheal separation. These findings provide insights into how developmental enhancers can be reprogrammed during tumorigenesis and underscore the importance of understanding enhancer dynamics during development and disease.

Plain language summary

The manuscript by Abatti et al. shows that epigenetic reactivation of a pair of distal enhancers that drive Sox2 expression during development (to permit separation of the esophagus and trachea) is responsible for the tumor-promoting re-expression of SOX2 in breast and lung tumors. Intriguingly, the same transcription factors that act on the enhancers during development to either activate or repress them (i.e. FOXA1 and NFIB, respectively) are also required for altering chromatin accessibility of the enhancers and SOX2 transcription in breast and lung cancer cells. With their work, the authors unravel the exact mechanism of how developmentally active enhancers become repurposed in a tumor context and show the relevance of this repurposing event for cancer.


Figures

Graphical Abstract
Graphical Abstract
Figure 1.
Figure 1.
A cluster 124–134 kb downstream of SOX2 gains enhancer features in cancer cells. (A) Super-logarithmic RNA-seq volcano plot of SOX2 expression from 21 cancer types compared with normal tissue (90). Cancer types with log2 FC > 1 and FDR-adjusted Q< 0.01 were considered to significantly overexpress SOX2. Error bars: standard deviation (SD). (B) SOX2 log2-normalized expression (log2 counts) associated with the SOX2 copy number from BRCA (n = 1174), COAD (n = 483), GBM (n = 155), LIHC (n = 414), LUAD (n = 552) and LUSC (n = 546) patient tumors (90). RNA-seq reads were normalized to library size using DESeq2 (88). Error bars: SD. Significance analysis by Dunn's test (180) with Holm correction (181). (C) 1500 bp genomic regions within ± 1 Mb from the SOX2 transcription start site (TSS) that gained enhancer features in MCF-7 cells (85) compared with normal breast epithelium (86). Regions that gained both ATAC-seq and H3K27ac ChIP-seq signal above our threshold (log2 FC > 1, dashed line) are highlighted in pink. Each region was labeled according to their distance in kilobases to the SOX2 promoter (pSOX2, bold). (D) ChIP-seq signal for H3K4me1 and H3K27ac, ATAC-seq signal and transcription factor ChIP-seq peaks at the SRR124–134 cluster in MCF-7 cells. Datasets are from ENCODE (85). (E) UCSC Genome Browser (102) display of H3K4me1 and H3K27ac ChIP-seq signal, DNase-seq and ATAC-seq chromatin accessibility signal, and ChIA-PET RNA polymerase II (RNAPII) interactions around the SOX2 gene within breast (normal tissue and 2 BRCA cancer cell lines) and lung (normal tissue, one LUAD and one LUSC cancer cell line) samples (,106,108,127). Relevant RNAPII interactions (between SRR124 and SRR134, and between SRR134 and pSOX2) are highlighted in maroon.
Figure 2.
Figure 2.
The SRR124–134 cluster drives SOX2 overexpression in BRCA and LUAD cells. (A) Enhancer reporter assay comparing luciferase activity driven by the SRR1, SRR2, SRR124, SRR134 and hSCR regions with an empty vector containing only a minimal promoter (minP). Enhancer constructs were assayed in the BRCA (MCF-7, T47D), LUAD (PC-9) and LUSC (H520) cell lines. Dashed line: average activity of minP. Error bars: SD. Significance analysis by Dunnett's test (n = 5; *P < 0.05, ***P < 0.001, ns: not significant) (182). (B) RT–qPCR analysis of SOX2 transcript levels in SRR124–134 heterozygous- (ΔENH+/–) and homozygous- (ΔENH–/–) deleted MCF-7 (BRCA) and PC-9 (LUAD) clones compared with WT (ΔENH+/+) cells. Error bars: SD. Significance analysis by Dunnett's test (n = 3; ***P < 0.001). (C) SOX2 protein levels in mouse embryonic stem cells (mESCs, positive control), ΔENH+/+, ΔENH+/– and ΔENH–/– MCF-7 clones. Cyclophilin A (CypA) was used as a loading control across all samples. (D) Colony formation assay with ΔENH+/+ and ΔENH–/– MCF-7 and PC-9 cells. Total crystal violet absorbance was normalized relative to the average absorbance from ΔENH+/+ cells for each respective cell line. Significance analysis by t-test with Holm correction (n = 5; ***P < 0.001). (E) UCSC Genome Browser (102) view of the SRR124–134 cluster deletion in ΔENH–/– MCF-7 cells with RNA-seq tracks from normal breast epithelium (86), ΔENH+/+ and ΔENH–/– MCF-7 cells. Arrow: reduction in RNA-seq signal at the SOX2 gene in ΔENH–/– MCF-7 cells. (F) Volcano plot with DESeq2 (88) differential expression analysis between ΔENH–/– and ΔENH+/+ MCF-7 cells. Blue: 312 genes that significantly lost expression (log2 FC < –1; FDR-adjusted Q < 0.01) in ΔENH–/– MCF-7 cells. Pink: 217 genes that significantly gained expression (log2 FC > 1; Q < 0.01) in ΔENH–/– MCF-7 cells. Gray: 35 891 genes that maintained similar (–1 ≤ log2 FC ≤ 1) expression between ΔENH–/– and ΔENH+/+ MCF-7 cells. (G) Comparison of SOX2 transcript levels between ΔENH+/+ and either ΔENH–/– MCF-7 or normal breast epithelium cells (86), and between ΔENH–/– MCF-7 and normal breast epithelium cells. RNA-seq reads were normalized to library size using DESeq2 (88). Error bars: SD. Significance analysis by Tukey's test (***P < 0.001, ns: not significant) (183).
Figure 3.
Figure 3.
SOX2 down-regulation impacts chromatin accessibility in luminal A BRCA. (A–C) GSEA in the transcriptome of ΔENH–/– compared with ΔENH+/+ MCF-7 cells. Genes were ranked according to their change in expression (log2 FC). A subset of Gene Ontology (GO) terms significantly enriched among down-regulated genes in ΔENH–/– MCF-7 cells are displayed, indicated by the NES < 1: (A) epidermis development, (B) epithelial cell differentiation and (C) cornification. GSEA was performed using clusterProfiler (94) with an FDR-adjusted Q < 0.05 threshold. Green line: running enrichment score. (D) UCSC Genome Browser (102) view of the SRR124–134 deletion in ΔENH–/– MCF-7 cells with ATAC-seq tracks from breast epithelium (86), ΔENH+/+ and ΔENH–/– MCF-7 cells. (E) Volcano plot with differential ATAC-seq analysis between ΔENH–/– and ΔENH+/+ MCF-7 cells. Blue: 2638 regions that lost (log2 FC < –1; FDR-adjusted Q < 0.01) chromatin accessibility in ΔENH–/– MCF-7 cells. Pink: 440 regions that gained (log2 FC > 1; Q < 0.01) chromatin accessibility in ΔENH–/– MCF-7 cells. Gray: 132 726 regions that retained chromatin accessibility in ΔENH–/– MCF-7 cells (–1 ≤ log2 FC ≤ 1). Regions were labeled with their closest gene within a ± 1 Mb distance threshold. Differential chromatin accessibility analysis was performed using diffBind (96). (F) Volcano plot with ATAC-seq footprint analysis of differential transcription factor binding in ΔENH–/– compared with ΔENH+/+ MCF-7 cells. Blue: 272 under-represented (log2 FC < –0.1; FDR-adjusted Q < 0.01) motifs in ATAC-seq peaks from ΔENH–/– MCF-7 cells. Pink: nine over-represented (log2 FC > 0.1; Q < 0.01) motifs in ATAC-seq peaks from ΔENH–/– MCF-7 cells. Gray: 560 motifs with no representative change (–0.1 ≤ log2 FC ≤ 0.1) within ATAC-seq peaks from ΔENH–/– MCF-7 cells. (G) Sequence motifs of the top six transcription factors with the lowest binding score in ΔENH–/– compared with ΔENH+/+ MCF-7 cells: GRHL1, TFCP2, RUNX2, GRHL2, TEAD3 and SOX4. Footprint analysis was performed using TOBIAS (97) utilizing the JASPAR 2022 motif database (79).
Figure 4.
Figure 4.
The SRR124–134 cluster is associated with SOX2 overexpression in cancer patient tumors. (A) ATAC-seq signal (log2 RPM) at SRR124 and SRR134 for 294 patient tumors from 14 cancer types (100). Cancer types are sorted in descending order by the median signal between all three regions. Dashed line: regions with a sum of reads above our threshold (log2 RPM > 0) were considered ‘accessible’. Error bars: SD. Underscore: top six cancer types with the highest ATAC-seq median signal. (B) ATAC-seq signal (log2 RPM) at the RAB7A promoter (pRAB7A), SOX2 promoter (pSOX2), SRR1, SRR2, SRR124, SRR134, hSCR and a desert region within the SOX2 locus (desert) compared with the background signal at the repressed OR5K1 promoter (pOR5K1) in BLCA (n = 10), BRCA (n = 74), LUAD (n = 22), LUSC (n = 16), STAD (n = 21) and UCEC (n = 13) patient tumors. Dashed line: regions with a sum of reads above our threshold (log2 RPM > 0) were considered ‘accessible’. Error bars: SD. Significance analysis by Dunn's test with Holm correction (*P < 0.05, **P < 0.01, ***P < 0.001, ns: not significant). (C) UCSC Genome Browser (102) visualization of the SOX2 region with ATAC-seq data from BLCA, BRCA, LUAD, LUSC, STAD and UCEC patient tumors (n = 5 in each cancer type) (100). ATAC-seq reads were normalized by library size (RPM). Scale: 0–250 RPM. (D) ATAC-seq signal at SRR124 and SRR134 regions against ATAC-seq signal for the SOX2 promoter (pSOX2) from 74 BRCA, 22 LUAD and 16 LUSC patient tumors. Correlation is shown for accessible chromatin (log2 RPM > 0). Gray: tumors with closed chromatin (log2 RPM < 0) at either region, not included in the correlation analysis. Significance analysis by Pearson correlation. Bold line: fitted linear regression model. Shaded area: 95% confidence region for the regression fit. (E) Comparison of log2-normalized SOX2 transcript levels (log2 counts) between BRCA, LUAD and LUSC patient tumors according to the chromatin accessibility at SRR124 and SRR134 regions. Chromatin accessibility at each region was considered ‘low’ if log2 RPM < –1, or ‘high’ if log2 RPM > 1. RNA-seq reads were normalized to library size using DESeq2 (88). Error bars: SD. Significance analysis by a two-sided t-test with Holm correction.
Figure 5.
Figure 5.
FOXA1 and NFIB are upstream regulators of SRR124 and SRR134. (A) Heatmap of the Pearson correlation between transcription factor expression (90) and chromatin accessibility (100) at SRR124 and SRR134 in BRCA, LUAD and LUSC patient tumors (n = 111). Transcription factors are ordered according to their correlation to chromatin accessibility at each region. Red: transcription factors with a positive correlation (R > 0; FDR-adjusted Q < 0.05) to chromatin accessibility. Blue: transcription factors with a negative correlation (R < 0; Q < 0.05) to chromatin accessibility. Asterisk: transcription factors that show binding at SRR124 or SRR134 by ChIP-seq (85). (B) Correlation analysis between FOXA1 expression (log2 counts) and chromatin accessibility (log2 RPM) at SRR124 and SRR134 regions in BRCA (n = 74), LUAD (n = 21) and LUSC (n = 16) tumors. RNA-seq reads were normalized to library size using DESeq2 (88). Significance analysis by Pearson correlation (n = 111). Bold line: fitted linear regression model. Shaded area: 95% confidence region for the regression fit. (C) Comparison of FOXA1 expression (log2 counts) from BRCA, LUAD and LUSC patient tumors according to their chromatin accessibility at the SRR124 and SRR134 regions. Chromatin accessibility at each region was considered ‘low’ if log2 RPM < 1, or ‘high’ if log2 RPM > 1. RNA-seq reads were normalized to library size using DESeq2 (88). Error bars: SD. Significance analysis by a two-sided t-test with Holm correction. (D) Correlation analysis between NFIB expression (log2 counts) and chromatin accessibility (log2 RPM) at SRR124 and SRR134 regions in BRCA (n = 74), LUAD (n = 21) and LUSC (n = 16) tumors. RNA-seq reads were normalized to library size using DESeq2 (88). Significance analysis by Pearson correlation (n = 111). Boldline: fitted linear regression model. Shaded area: 95% confidence region for the regression fit. (E) Comparison of NFIB expression (log2 counts) from BRCA, LUAD and LUSC patient tumors according to their chromatin accessibility at the SRR124 and SRR134 regions. Chromatin accessibility at each region was considered ‘low’ if log2 RPM < 1, or ‘high’ if log2 RPM > 1. RNA-seq reads were normalized to library size using DESeq2 (88). Error bars: SD. Significance analysis by a two-sided t-test with Holm correction. (F) Relative fold change (log2 FC) in luciferase activity driven by SRR124 and SRR134 after overexpression of either FOXA1 or NFIB compared with an empty vector (mock negative control, miRFP670). Dashed line: average activity of the mock control. Error bars: SD. Significance analysis by Tukey's test (n = 5; *P < 0.05, **P < 0.01, ***P < 0.001, ns: not significant). (G) Relative luciferase activity driven by WT, FOXA1-mutated and NFIB-mutated SRR134 constructs compared with a minimal promoter (minP) vector in the MCF-7, PC-9 and T47D cell lines. Dashed line: average activity of minP. Error bars: SD. Significance analysis by Tukey's test (n = 5; *P < 0.05, **P < 0.01, ***P < 0.001, ns: not significant). (H) RT–qPCR comparison of transcripts at SOX2, SRR124 and SRR134 between sorted BFP−ve and BFP+ve MCF-7 cells relative to the unsorted population. Error bars: SD. Significance analysis by paired t-test with Holm correction (n = 6; ***P < 0.001). (I) FACS density plot comparing tagBFP signal between SOX2-P2A-tagBFP MCF-7 cells transfected with an empty vector (mock negative control, miRFP670), FOXA1-T2A-miRFP670 or NFIB-T2A-miRFP670. tagBFP signal was acquired from successfully transfected live cells (miRFP+/PI) after 5 days post-transfection. Significance analysis by FlowJo's chi-squared T(x) test. T(x) scores >1000 were considered ‘strongly significant’ (***P < 0.001), whereas T(x) scores <100 were considered ‘non-significant’.
Figure 6.
Figure 6.
The SRR124 and SRR134 enhancers are conserved across species and are required for the separation of the esophagus and trachea in the mouse. (A) UCSC Genome Browser (102) view of the SOX2 region containing a compilation of chromatin accessibility tracks of multiple human tissues (85,86,137). Arrow: increased chromatin accessibility at the SRR124–134 cluster in cancer and in digestive and respiratory tissues. (B) DNase-seq quantification (log2 RPM) at the RAB7A promoter (pRAB7A), SOX2 promoter (pSOX2), SRR1, SRR2, SRR124, SRR134, hSCR and a desert region within the SOX2 locus (desert) compared with the background signal at the repressed OR5K1 promoter (pOR5K1) in lung and stomach embryonic tissues (85). Dashed line: regions with a sum of reads above our threshold (log2 RPM > 0) were considered ‘accessible’. Error bars: SD. Significance analysis by Dunn's test with Holm correction (*P < 0.05, **P < 0.01, ***P < 0.001, ns: not significant). (C) UCSC Genome Browser (102) with PhyloP conservation scores (103) at the SRR124 and SRR134 enhancers across mammals, birds, reptiles and amphibians. Black lines: highly conserved sequences. Empty lines: variant sequences. (D) UCSC Genome Browser (102) view of the Sox2 region in the mouse. ATAC-seq and H3K27ac ChIP-seq data from lung and stomach tissues throughout developmental days E14.5 to the eighth post-natal week (85,101). mSRR96: homologous to SRR124. mSRR102: homologous to SRR134. Reads were normalized to library size (RPM). (E) Illustration demonstrating the mSRR96–102 enhancer cluster CRISPR deletion (ΔmENH) in C57BL/6J mouse embryos. (F) Quantification and genotype of the C57BL/6J progeny from mSRR96–102-deleted crossings (ΔmENH+/–). Pups were counted and genotyped at weaning (P21). Significance analysis by chi-squared test to measure the deviation in the number of obtained pups from the expected Mendelian ratio of 1:2:1 (ΔmENH+/+:ΔmENH+/–:ΔmENH–/–). (G) Transverse cross-section of fixed E18.5 embryos at the start of the thymus. (H) Embryo sections stained with H&E. Scale bar: 500 μm. Es, esophagus; Tr, trachea; EA/TEF, esophageal atresia with distal tracheoesophageal fistula. (I) Embryo cross-sections stained for SOX2. Scale bar: 500 μm. Es, esophagus; Tr, trachea; EA/TEF, esophageal atresia with distal tracheoesophageal fistula.

References

    1. Zhu J., Adli M., Zou J.Y., Verstappen G., Coyne M., Zhang X., Durham T., Miri M., Deshpande V., De Jager P.L.et al. .. Genome-wide chromatin state transitions associated with developmental and environmental cues. Cell. 2013; 152:642–654. - PMC - PubMed
    1. Hawkins R.D., Hon G.C., Lee L.K., Ngo Q., Lister R., Pelizzola M., Edsall L.E., Kuan S., Luu Y., Klugman S.et al. .. Distinct epigenomic landscapes of pluripotent and lineage-committed human cells. Cell Stem Cell. 2010; 6:479–491. - PMC - PubMed
    1. Rada-Iglesias A., Bajpai R., Swigut T., Brugmann S.A., Flynn R.A., Wysocka J.. A unique chromatin signature uncovers early developmental enhancers in humans. Nature. 2011; 470:279–283. - PMC - PubMed
    1. Creyghton M.P., Cheng A.W., Welstead G.G., Kooistra T., Carey B.W., Steine E.J., Hanna J., Lodato M.A., Frampton G.M., Sharp P.A.et al. .. Histone H3K27ac separates active from poised enhancers and predicts developmental state. Proc. Natl Acad. Sci. USA. 2010; 107:21931–21936. - PMC - PubMed
    1. Rubin A.J., Barajas B.C., Furlan-Magaril M., Lopez-Pajares V., Mumbach M.R., Howard I., Kim D.S., Boxer L.D., Cairns J., Spivakov M.et al. .. Lineage-specific dynamic and pre-established enhancer–promoter contacts cooperate in terminal differentiation. Nat. Genet. 2017; 49:1522–1528. - PMC - PubMed

Publication types