. 2023 Dec 6;13(12):jkad219.
doi: 10.1093/g3journal/jkad219.

High-throughput screening of the Saccharomyces cerevisiae genome for 2-amino-3-methylimidazo [4,5-f] quinoline resistance identifies colon cancer-associated genes

Affiliations

High-throughput screening of the Saccharomyces cerevisiae genome for 2-amino-3-methylimidazo [4,5-f] quinoline resistance identifies colon cancer-associated genes

Michael Dolan et al. G3 (Bethesda). .

Abstract

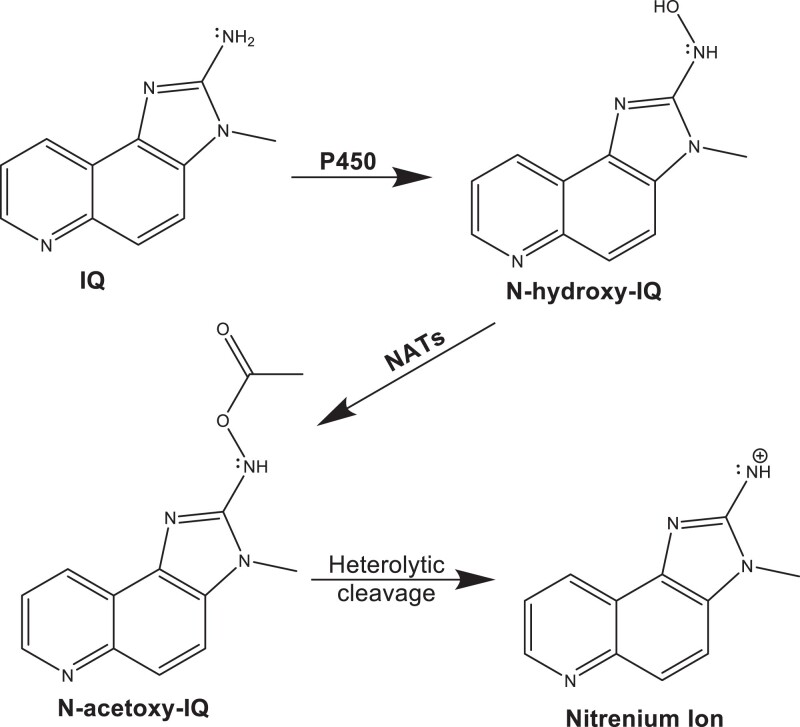
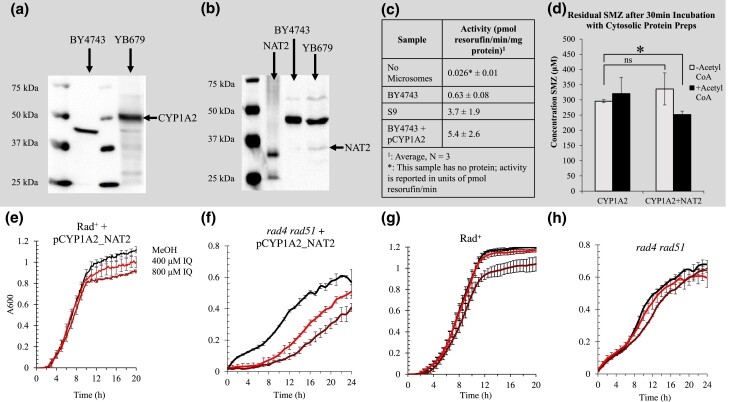
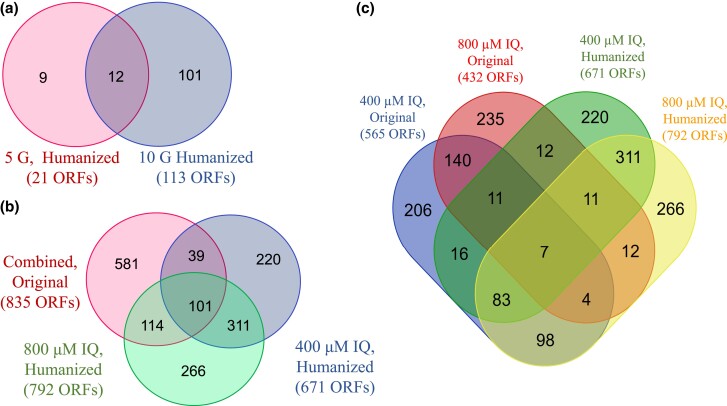
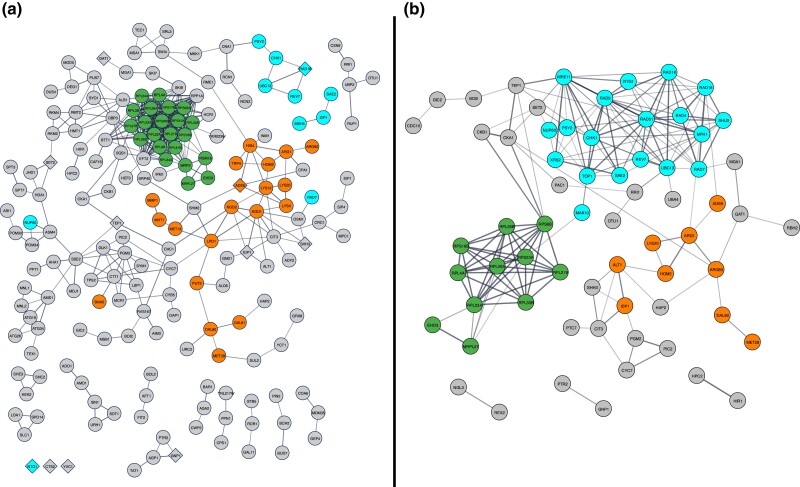
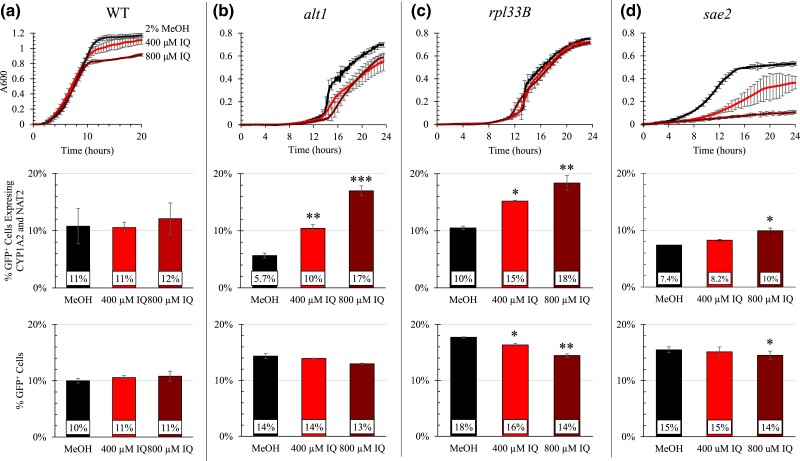
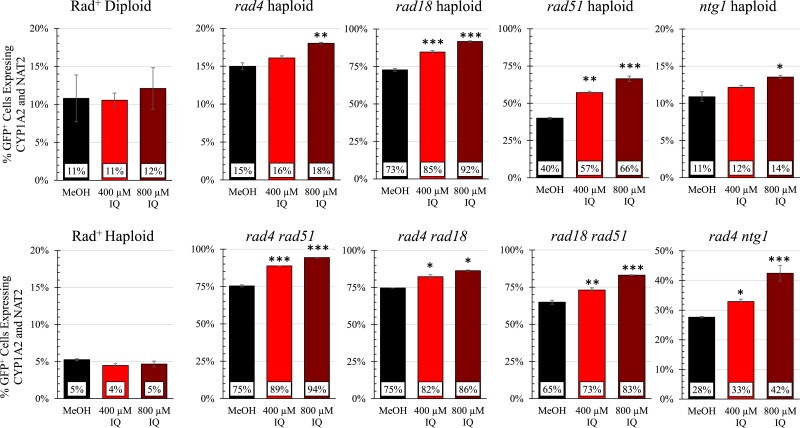
Heterocyclic aromatic amines (HAAs) are potent carcinogenic agents found in charred meats and cigarette smoke. However, few eukaryotic resistance genes have been identified. We used Saccharomyces cerevisiae (budding yeast) to identify genes that confer resistance to 2-amino-3-methylimidazo[4,5-f] quinoline (IQ). CYP1A2 and NAT2 activate IQ to become a mutagenic nitrenium compound. Deletion libraries expressing human CYP1A2 and NAT2 or no human genes were exposed to either 400 or 800 µM IQ for 5 or 10 generations. DNA barcodes were sequenced using the Illumina HiSeq 2500 platform and statistical significance was determined for exactly matched barcodes. We identified 424 ORFs, including 337 genes of known function, in duplicate screens of the "humanized" collection for IQ resistance; resistance was further validated for a select group of 51 genes by growth curves, competitive growth, or trypan blue assays. Screens of the library not expressing human genes identified 143 ORFs conferring resistance to IQ per se. Ribosomal protein and protein modification genes were identified as IQ resistance genes in both the original and "humanized" libraries, while nitrogen metabolism, DNA repair, and growth control genes were also prominent in the "humanized" library. Protein complexes identified included the casein kinase 2 (CK2) and histone chaperone (HIR) complex. Among DNA Repair and checkpoint genes, we identified those that function in postreplication repair (RAD18, UBC13, REV7), base excision repair (NTG1), and checkpoint signaling (CHK1, PSY2). These studies underscore the role of ribosomal protein genes in conferring IQ resistance, and illuminate DNA repair pathways for conferring resistance to activated IQ.

Keywords: budding yeast; colon cancer; genome profiling; heterocyclic aromatic amine.


Conflict of interest statement

Conflicts of interest The author(s) declare no conflict of interest.

Figures

Fig. 1.
Fig. 1.
Bioactivation of the HAA IQ by human CYP and NAT proteins. The chemical structures of IQ, N-hydroxy IQ, and N-acetoxy-IQ are shown in the figure. IQ is first hydroxylated by CYPs to form N-hydroxy-IQ. The hydroxylated IQ is then acetylated by N-acetyl transferases (NATs) to form N-acetyl-IQ. This compound is unstable and generates the nitrenium ion shown in the figure (for review see, Turesky and Le Marchand 2011).
Fig. 2.
Fig. 2.
IQ sensitivity and expression of CYP1A2 and NAT2 in rad+ and DNA repair deficient strains. Panel A is a Western blot that detects the human CYP1A2 protein present in yeast protein extracts. The black arrow indicates the position of CYP1A2, which is ∼58 kDa. The first and third lanes from the left contain the molecular weight standards. The second lane contains the protein extract from wild type (BY4743) and the last lane contains the extract from wild-type strain containing pCYP1A2_NAT2 (YB679). Panel B is a Western blot that detects the human NAT2 protein in yeast protein extracts. The red arrow indicates the position of the NAT2 protein, which is ∼37 kDa. The first lane from the left contains the molecular weight standards. The second contains a purified NAT2 protein. The third and fourth lanes, respectively, contain the wild-type (BY4743) and the wild type expressing pCYP1A2_NAT2 (YB679). Panel C shows the 7-MROD activity of CYP1A2 ±1 standard deviation, N = 3. Panel D shows the acetyltransferase activity of Nat2. Acetyl-CoA is a cofactor, without which the reaction does not occur. Error bars represent 1 standard deviation, N = 3. Panels E-H are growth curves of Rad+ or rad4  rad51 yeast strains exposed to 2% MeOH (black), 400 µM IQ (Light red), or 800 µM IQ (Dark red), plotted as absorbance (A600) against time (Hours). Error bars represent 1 standard deviation at 1-hour intervals. Panel E is a growth curve of the Rad+ diploid strain containing pCYP1A2_NAT2 (YB679), N = 8. Percent growth with 400 µM IQ and 800 µM IQ were 94 and 83%, respectively. Panel F is a growth curve of the rad4  rad51 haploid yeast strain containing pCYP1A2_NAT2 (YB400), N = 3. Percent growth with 400 µM IQ and 800 µM IQ were 60 and 41%, respectively. Panel G is a growth curve of the Rad+ diploid strain (BY4743), N = 8. Percent growth with 400 µM IQ and 800 µM IQ were 99 and 93%, respectively. Panel H is a growth curve the rad4  rad51 (YB226) strains, N = 3. Percent growth with 400 µM IQ and 800 µM IQ were 94 and 87%, respectively.
Fig. 3.
Fig. 3.
Venn diagrams of IQ resistance genes identified in screens that vary either exposure time or IQ concentrations. All ORFs were identified from the yeast diploid deletion library expressing CYP1A2 and NAT2. ORFs include genes of known function, genes of unknown function, and uncharacterized open Reading frames, which confer IQ resistance. Panel A is the overlap of the ORFs identified after 800 µM IQ exposure for 5 and 10 generations. Twenty-one ORFs were identified after 5 generations and 113 ORFs were identified after 10 generations. Panel B is the overlap of the IQ resistance genes identified after 400 µM and 800 µM IQ exposures for 10 generations. Individually, 671 ORFs were identified after 400 µM IQ exposure and 792 ORFs were identified after 800 µM IQ exposures. The original library treated with either IQ concentration identified 835 unique ORFs across both 400 µM and 800 µM IQ treatments. Panel C expands the combined original library from B into ORFs from the individual 400 µM (565 ORFs) and 800 µM IQ exposures (432 ORFs), displaying the degree of overlap.
Fig. 4.
Fig. 4.
Protein interactome identified from screens of the diploid deletion library containing pCYP1A2_NAT2. The interactome was curated using String V11 (https://string-db.org, Szklarczyk et al. 2019). Nodes represent proteins, while edges represent interactions between 2 proteins. More evidence of interaction between proteins is denoted by thicker lines. Colored nodes indicate proteins involved in translation (green), DNA damage tolerance (blue), and amino acid metabolism (orange). Genes with human orthologs implicated in colon cancer are shown as diamond-shaped nodes. Disconnected nodes have been removed to improve readability. Panel A represents the functional interactome of proteins encoded by the 424 ORFs that were identified in both screens of the “humanized” library. Disconnected nodes in the bottom left were included because they have human orthologs implicated in colorectal cancer (CRC). Protein interactions with “high” confidence (0.7) of interaction are displayed. Panel B represents the functional interactome of each protein encoded by the 93 ORFs from the “humanized” yeast deletion library, which have been individually validated. Protein interactions with a “medium” confidence (0.4) of interaction are displayed.
Fig. 5.
Fig. 5.
Growth curves and competition assays for selected IQ resistance genes identified in high-throughput screens. Panels A, B, C, and D show the wild-type strain, alt1, rpl33B, and sae2, respectively. The latter 3 represent major gene clusters highlighted in Fig. 4, including nitrogen metabolism (ALT1), ribosome protein (RPL33B) and DNA repair (SAE2). The top row contains growth curves for selected strains containing pCYP1A2_NAT2. A600 is plotted against time (Hours) with the background absorbance was subtracted, N ≥ 3. Error bars represent 1 standard deviation for 1-hour measurements. The middle row shows competitive growth data for the indicated strains containing pCYP1A2_NAT2. The y-axis shows the percent of GFP-containing wild type expressing CYP1A2 and NAT2 (YB676). Competitive cultures were inoculated into SC-Ura at approximately 10% YB676 and 90% the indicated strain. 2 × 10⁴ cells were acquired per sample. Error bars represent 1 standard deviation. For wild type (YB679), N ≥ 5; for all others, N = 2. Significance was determined by Dunnett's test and asterisks indicate P < 0.05 (*), P < 0.01 (**) and P < 0.001(***). The bottom row shows competitive growth data for the indicated strains not expressing CYP1A2 or NAT2. The y-axis shows the % of GFP-containing WT (YB675). Competitive cultures were inoculated into SC at approximately 10% YB675 and 90% the indicated strain and grown for 20 hours. 2 104 cells were acquired per sample. For wild type (BY4743), N = 12; for all others, N = 2. Error bars represent 1 standard deviation. Significance was determined by Dunnett's test and asterisks indicate P < 0.05 (*), P < 0.01 (**) and P < 0.001(***).
Fig. 6.
Fig. 6.
IQ toxicity in rad4, ntg1, rad18, and rad51 single and double mutants. The competitive growth of selected single haploid DNA repair mutants (top row) and double mutants (bottom row) after growth in the presence of 2% MeOH, 400 µM IQ, or 800 µM IQ. Cultures were inoculated at approximately 10% of GFP-expressing wild-type cells and 90% mutant cells and were grown for 20 hours (∼10 generations). 2 × 10⁴ cells were acquired for each sample. For the Rad+ haploid (YB682) N = 8. For the Rad+ diploid (YB679), N = 12. For the other strains, N = 2. Error bars represent 1 standard deviation. Significance was determined by Dunnett's test and asterisks indicate P < 0.05 (*), P < 0.01 (**) and P < 0.001(***).

Similar articles

References

    1. Aeschbacher HU, Turesky RJ. 1991. Mammalian cell mutagenicity and metabolism of heterocyclic aromatic amines. Mutat Res. 259(3–4):235–250. doi:10.1016/0165-1218(91)90120-B. - DOI - PubMed
    1. Aggarwal N, Donald ND, Malik S, Selvendran SS, McPhail MJW, Monahan KJ. 2017. The association of low-penetrance variants in DNA repair genes with colorectal cancer: a systematic review and meta-analysis. Clin Transl Gastroenterol. 8(7):e109. doi:10.1038/ctg.2017.35. - DOI - PMC - PubMed
    1. Al-Tassan N, Chmiel NH, Maynard J, Fleming N, Livingston AL, Williams GT, Hodges AK, Davies DR, David SS, Sampson JR, et al. 2002. Inherited variants of MYH associated with somatic G:c→T:a mutations in colorectal tumors. Nat Genet. 30(2):227–232. doi:10.1038/ng828. - DOI - PubMed
    1. Ausubel FM. 2003. Current Protocols in Molecular Biology. New York: Greene Pub. Associates. p. 1.7.1–1.7.15.
    1. Aykan NF. 2015. Red meat and colorectal cancer. Oncol Rev. 9(1):288. doi:10.4081/oncol.2015.288. - DOI - PMC - PubMed

Publication types

LinkOut - more resources