. 2023 Oct:96:104809.
doi: 10.1016/j.ebiom.2023.104809. Epub 2023 Sep 20.

Rebalancing of mitochondrial homeostasis through an NAD+-SIRT1 pathway preserves intestinal barrier function in severe malnutrition

Affiliations

Rebalancing of mitochondrial homeostasis through an NAD+-SIRT1 pathway preserves intestinal barrier function in severe malnutrition

Catriona Ling et al. EBioMedicine. 2023 Oct.

Abstract

Background: The intestine of children with severe malnutrition (SM) shows structural and functional changes that are linked to increased infection and mortality. SM dysregulates the tryptophan-kynurenine pathway, which may impact processes such as SIRT1- and mTORC1-mediated autophagy and mitochondrial homeostasis. Using a mouse and organoid model of SM, we studied the repercussions of these dysregulations on malnutrition enteropathy and the protective capacity of maintaining autophagy activity and mitochondrial health.

Methods: SM was induced through feeding male weanling C57BL/6 mice a low protein diet (LPD) for 14-days. Mice were either treated with the NAD+-precursor, nicotinamide; an mTORC1-inhibitor, rapamycin; a SIRT1-activator, resveratrol; or SIRT1-inhibitor, EX-527. Malnutrition enteropathy was induced in enteric organoids through amino-acid deprivation. Features of and pathways to malnutrition enteropathy were examined, including paracellular permeability, nutrient absorption, and autophagic, mitochondrial, and reactive-oxygen-species (ROS) abnormalities.

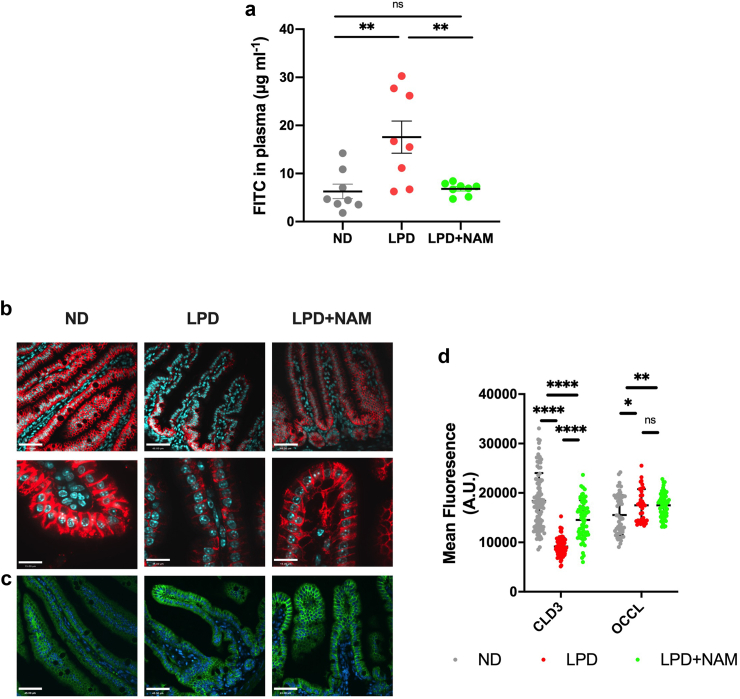
Findings: LPD-feeding and ensuing low-tryptophan availability led to villus atrophy, nutrient malabsorption, and intestinal barrier dysfunction. In LPD-fed mice, nicotinamide-supplementation was linked to SIRT1-mediated activation of mitophagy, which reduced damaged mitochondria, and improved intestinal barrier function. Inhibition of mTORC1 reduced intestinal barrier dysfunction and nutrient malabsorption. Findings were validated and extended using an organoid model, demonstrating that resolution of mitochondrial ROS resolved barrier dysfunction.

Interpretation: Malnutrition enteropathy arises from a dysregulation of the SIRT1 and mTORC1 pathways, leading to disrupted autophagy, mitochondrial homeostasis, and ROS. Whether nicotinamide-supplementation in children with SM could ameliorate malnutrition enteropathy should be explored in clinical trials.

Funding: This work was supported by the Bill and Melinda Gates Foundation, the Sickkids Research Institute, the Canadian Institutes of Health Research, and the University Medical Center Groningen.

Keywords: Autophagy; Enteropathy; Malnutrition; Mitochondria; SIRT1.


Conflict of interest statement

Declaration of interests All authors declare no conflicts interests.

Figures

Fig. 1
Fig. 1
Assessment of body growth, intestinal architecture and barrier function in weanling mice fed the low protein diet or isocaloric normal diet. (a) Body weight over 14-days. Individual data points are shown with mean and SD, n = 6 mice per group (repeated measures analysis of variance). (b) Representative images of mice in each treatment group. (c) Body length measured after 14-days. Data points represent mean SD, n = 6 mice per group. (d) Non-essential amino acids (NEAA) and essential amino acids (EAA) were measured in plasma on day 14. Bar graph indicates the mean with SD, n = 10–12 mice per group (two-tailed Student’s T -test on log transformed data). (e) Intestine length, and (f) intestine length normalized to body length were measured after 14-days. Data points represent mean SD, n = 6 mice per group (Student’s T-test). (g–i) Average villus height in jejunum and ileum with representative H&E-stained images of jejunum from each group, n = 8 mice per group. Scale bar, 100 μm. Bar graphs indicate the mean with SD (Mann–Whitney U test). (j) Villus height measured in jejunum of LPD-fed mice and weight-matched weanling mice (WMC). (k) Concentration of FITC in the plasma measured 1.5 h post oral administration after 14 days. Bars indicate the mean with SD, n = 8 per group, Student’s T-test). (∗p < 0.05, ∗∗p < 0.01, ∗∗∗p < 0.001) (Grey = ND, red = LPD).
Fig. 2
Fig. 2
Supplementation with nicotinamide rescues LPD-induced intestinal barrier dysfunction and loss of tight junction proteins. (a) Concentration of FITC in the plasma measured 1.5 h-post oral administration on day 14. Bars indicate the mean with SD, n = 8 per group. (Ordinary ANOVA with Tukey’s post-hoc) (b and c) Representative immunofluorescent images of CLD-3 (red) and OCCL (green), nuclei counterstained with DAPI (cyan) (scale bar = 45um) (d) Quantification of average fluorescence of immunofluorescent staining of CLD-3 and OCCL, bars indicate the mean with SD, n = 3 mice/group, 15–20 image sections/mouse. (Ordinary ANOVA with Tukey’s post-hoc) (∗p < 0.05, ∗∗p < 0.01, ∗∗∗∗p < 0.001).
Fig. 3
Fig. 3
Feeding a LPD induces alterations in TRP pathway and its downstream target SIRT1. (a) Small intestinal NAD levels (n = 5–6 per group, Ordinary ANOVA with Tukey’s post-hoc correction) (b) Representative immunoblots of SIRT1 and loading control GAPDH (c) Representative immunoblots of AC-P53, P53, and loading control GAPDH (d and e) densitometry quantification of immunoblots represented as fold change from ND. Bars indicate the mean with SD, n = 6 per group (Ordinary ANOVA with Tukey’s post-hoc comparison to ND). (∗∗p < 0.01∗∗∗∗p < 0.0001).
Fig. 4
Fig. 4
Feeding LPD induces alterations in TRP pathway and its downstream targets, autophagy and mitochondrial biogenesis. (a and b) Representative immunoblots of HSP60, TOMM20, GAPDH and (c and d) densitometry quantification represented as fold change from ND. Bars indicate the mean with SD, n = 6 per group (Ordinary ANOVA with Tukey’s post-hoc). (e) Immunofluorescent imaging of HSP60 (green), membrane marker ECAD (red) and nuclei counterstain DAPI (Cyan) (scalebar = 20um). (f) Corresponding quantification of average fluorescence n = 3 mice/group, 15–20 image sections/mouse, individual data points are shown with mean and SD (student’s t-test, ∗p < 0.05) (g) Representative immunoblots of PGC-1a and GAPDH and (h) densitometry quantification represented as fold change from ND. Bars indicate the mean with SD, n = 6 per group (Ordinary ANOVA with Tukey’s post-hoc). (i and j) Gene expression analysis of TFAM and NRF-1, Bars indicate the mean with SD (Ordinary ANOVA with Tukey’s post-hoc) (∗p < 0.05, ∗∗p < 0.01, ∗∗∗p < 0.005).
Fig. 5
Fig. 5
LPD feeding and nicotinamide supplementation alter mitochondrial complex protein expression and mitochondrial size, quantity, and cristae structures through modulating mitophagy. (a) Representative TEM images of mouse enterocyte mitochondria (scale bar = 1um). (b–e) Quantification of TEM images (N = 3 mice per group with n = 10–20 cells analyzed per mouse (n varying depending on image resolution), individual data points are shown with mean and SD). (b) The percent of all cells that contain abnormal cristae structures, (average of cells imaged in n = 3 mice/group). (c) The average circularity index of the mitochondria Circularity index is a measurement performed by ImageJ following the calculation circularity = 4pi(area/perimenter2). (d) The number of mitochondria per cell area (measured in um2). (e) The average area of a mitochondria (um2), (average of cells imaged in n = 3 mice/group). (f) Small intestinal ATP levels (nmol/g tissue, n = 5–7/group). (g) Representative immunoblots of Complex I–V and B-Actin, (h) representative immunoblots of PINK-1, TOM-20, and GAPDH and (i) representative immunoblots of P62, LC3B, and GAPDH. (j–q) Densitometry quantification of immunoblots represented as fold change from ND. Bars indicate the mean with SD, n = 6 per group. (All statistical tests shown are: Ordinary ANOVA with Tukey’s post-hoc, ns: p > 0.05, ∗p < 0.05, ∗∗p < 0.01, ∗∗∗p < 0.005, ∗∗∗∗p < 0.001).
Fig. 6
Fig. 6
Autophagy activation via rapamycin treatment improves intestinal function and mitochondrial damage. (a) Representative immunoblots of LC3B, p70s6k, and p70s6K-pS235/236 and (b and c) densitometry quantification normalized to total protein, n = 4–6 mice per group (Individual data points are shown with mean and SD, Two-way ANOVA with Tukey’s post-hoc test). (d) Concentration of FITC in the serum measured 1.5 h post oral administration after 14 days. Bars indicate the mean with SD, n = 8 per group (Two-way ANOVA with Tukey’s post-hoc analysis). (e) Fractional absorption of glucose and lactose after mice were fed the normal diet (n = 9) or low protein diet (n = 11) or low protein with daily rapamycin i.p., injections for 14 days. Individual data points are shown with mean and SD (Two-way ANOVA with Tukey’s post-hoc analysis). (f and g) Representative electron microscopy images of jejunal enterocytes, arrowheads indicating mitochondria (scale bar = 1um). (h) Number of mitochondria per cell. (i) Average mitochondrial length. (j) Average mitochondrial width, n = 9 cells per experimental group (Individual data points are shown with mean and SD, Two-way ANOVA with Tukey’s post-hoc test). (∗p < 0.05, ∗∗p < 0.01, ∗∗∗p < 0.001).
Fig. 7
Fig. 7
Nicotinamide-induced alterations in autophagy and mitochondrial complex IV are mediated through a SIRT1 dependent mechanism. (a) Percent weight change over 14-days (n = 6 per group). (b) Immunoblotting of CLD-3, LC3B, ComplexIV, B-Actin and (c–f) densitometry quantification of immunoblots represented as fold change from ND. Bars indicate the mean with SD, n = 4–6 per group. NB. GAPDH in for LC3 is the same as for CIV because LC3 and CIV were stripped on the same blot. (g) Immunofluorescent imaging of HSP60 (green), membrane marker ECAD (red) and nuclei counterstain DAPI (Cyan) n = 3 mice/group (scalebar = 20um). (All statistical tests shown are: Ordinary ANOVA with Dunnett’s post-hoc, ns: p > 0.05, ∗p < 0.05, ∗∗p < 0.01).
Fig. 8
Fig. 8
Amino Acid deprivation of small intestinal organoids induces features of SM enteropathy. (a) Representative brightfield images of organoids on day 5 (scale bar = 1000uM) (b) Average organoid size on day 5 (n = 50–60 organoids in N = 3 biological replicates each, two-tailed Student’s T -test where). (c) Representative images of Basal out and Apical out polarization of enteric organoids stained for DAPI (cyan), ZO-1 (green), Phalloidin (magenta) (scale bar = 26uM). (d) 3D rendering of exemplary apical out organoid visualized from a top-down view and through the mid-section stained for DAPI (cyan), E-Cadherin (green), Phalloidin (magenta). (e) Representative brightfield images of apical out organoids on after 72 h in control or AA-deprived medium (scale bar = 200uM). (f) Average organoid size on day 5 (n = 20–30 organoids in N = 3 biological replicates each, two-tailed Student’s T -test where), (g) non-essential amino acids (NEAA), and essential amino acids (EAA) were measured in culture medium on day 5. Bar graph indicates the mean with SD, n = 3 biological replicates per group (two-tailed Student’s T-test). (∗p < 0.05, ∗∗p < 0.01, ∗∗∗p < 0.005, ∗∗∗∗p < 0.001).
Fig. 9
Fig. 9
Paracellular barrier dysfunction in AA deprived organoids is caused, at least in part, by mitochondrial derived reactive oxygen species. (a) Coupled oxygen consumption measurements in control or amino acid deprived organoids (students two-tailed T-Test). (b) Mitochondrial superoxide levels normalized to million cells measured on a fluorescent plate reader (a & b: n = 3 replicates in N = 3 biological replicates each, Ordinary ANOVA with Tukey’s post-hoc). (c) Representative fluorescent images of mitochondrial superoxide levels. (d) Representative images of the FITC-Dextran Assay in enteric organoids and (e) corresponding quantification of FITC-dextran leakage into organoid lumen as lumen intensity/background intensity in (n = 20–40 organoids in N = 3 biological replicates each, Ordinary ANOVA with Tukey’s post-hoc), (ns: p > 0.05, ∗∗p < 0.01, ∗∗p < 0.005, ∗∗∗∗p < 0.001).

References

    1. United Nations Children’s Fund. World Health Organization. World Bank Group Levels and trends in child malnutrition: key findings of the 2020 edition of the joint child malnutrition estimates. https://www.who.int/publications-detail/jme-2020-edition Available from:
    1. Grenov B., Lanyero B., Nabukeera-Barungi N., et al. Diarrhea, dehydration, and the associated mortality in children with complicated severe acute malnutrition: a prospective cohort study in Uganda. J Pediatr. 2019;210:26–33. - PubMed
    1. Nabukeera-Barungi N., Grenov B., Lanyero B., et al. Predictors of mortality among hospitalized children with severe acute malnutrition: a prospective study from Uganda. Pediatr Res. 2018;84(1):92–98. - PubMed
    1. Amadi B., Besa E., Zyambo K., et al. Impaired barrier function and autoantibody generation in malnutrition enteropathy in Zambia. EBioMedicine. 2017;22:191–199. - PMC - PubMed
    1. Boaz R.T., Joseph A.J., Kang G., Bose A. Vol. 50. Indian pediatrics; India: 2013. Intestinal permeability in normally nourished and malnourished children with and without diarrhea; pp. 152–153. - PubMed

LinkOut - more resources