. 2023 Oct 9;41(10):1803-1816.e8.
doi: 10.1016/j.ccell.2023.08.013. Epub 2023 Sep 21.

ZNF683 marks a CD8+ T cell population associated with anti-tumor immunity following anti-PD-1 therapy for Richter syndrome

Affiliations

ZNF683 marks a CD8+ T cell population associated with anti-tumor immunity following anti-PD-1 therapy for Richter syndrome

Erin M Parry et al. Cancer Cell. .

Abstract

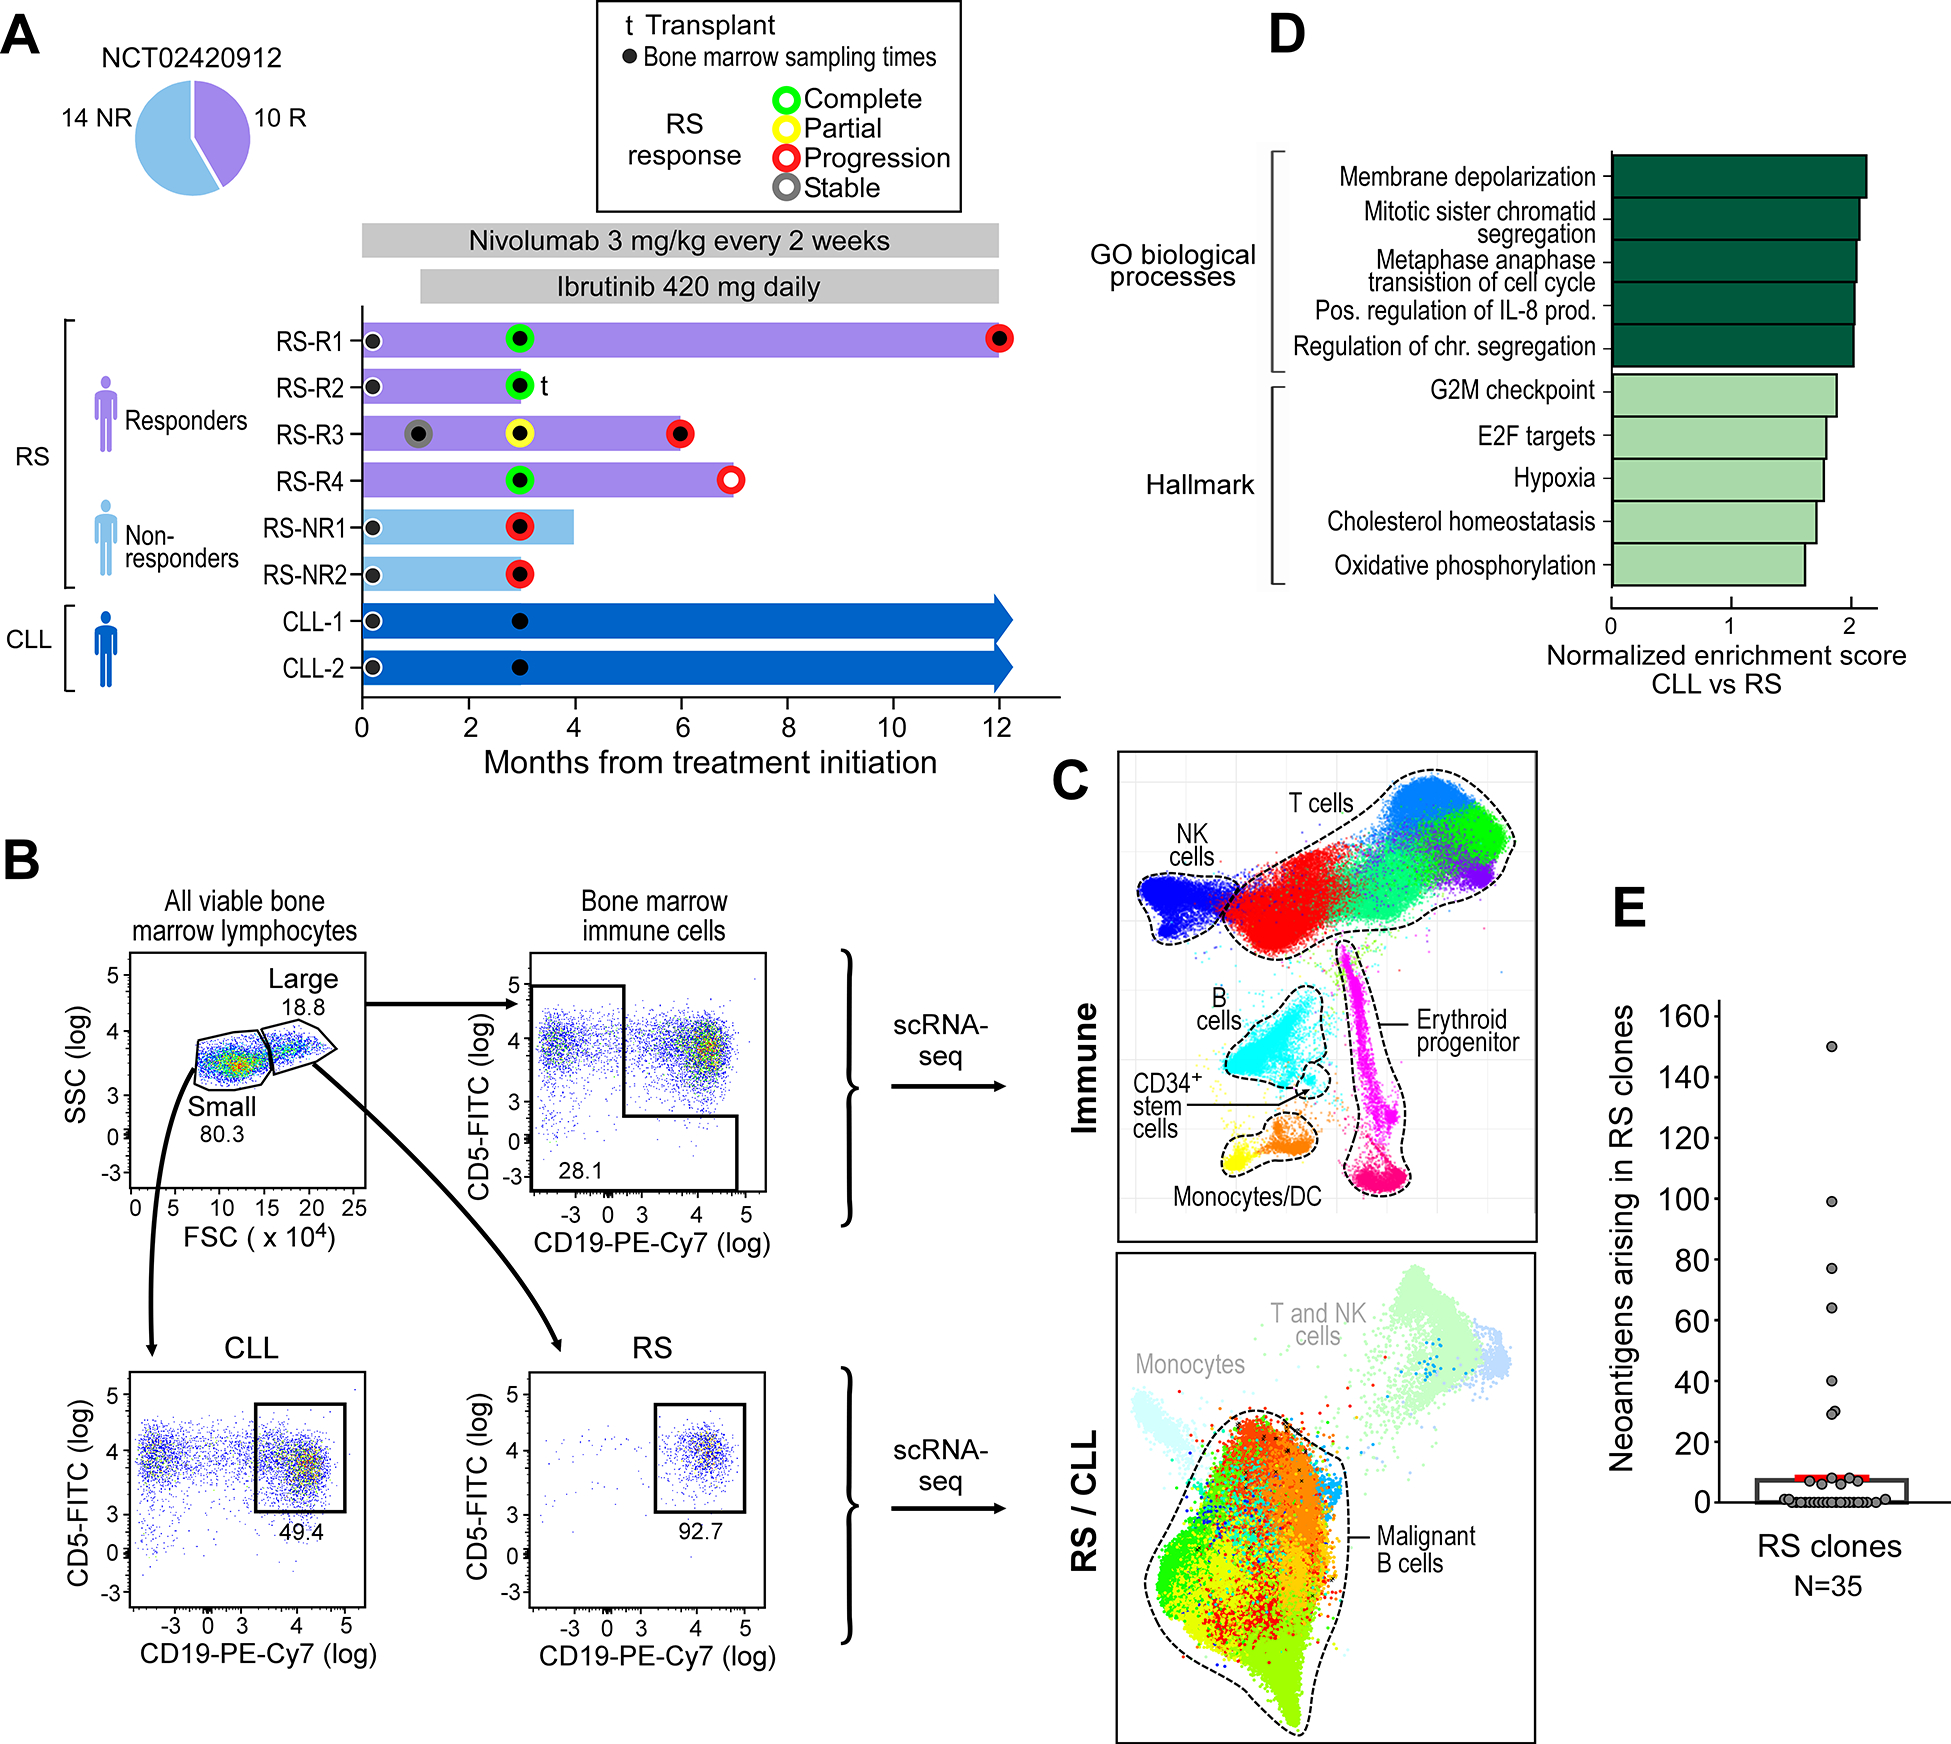
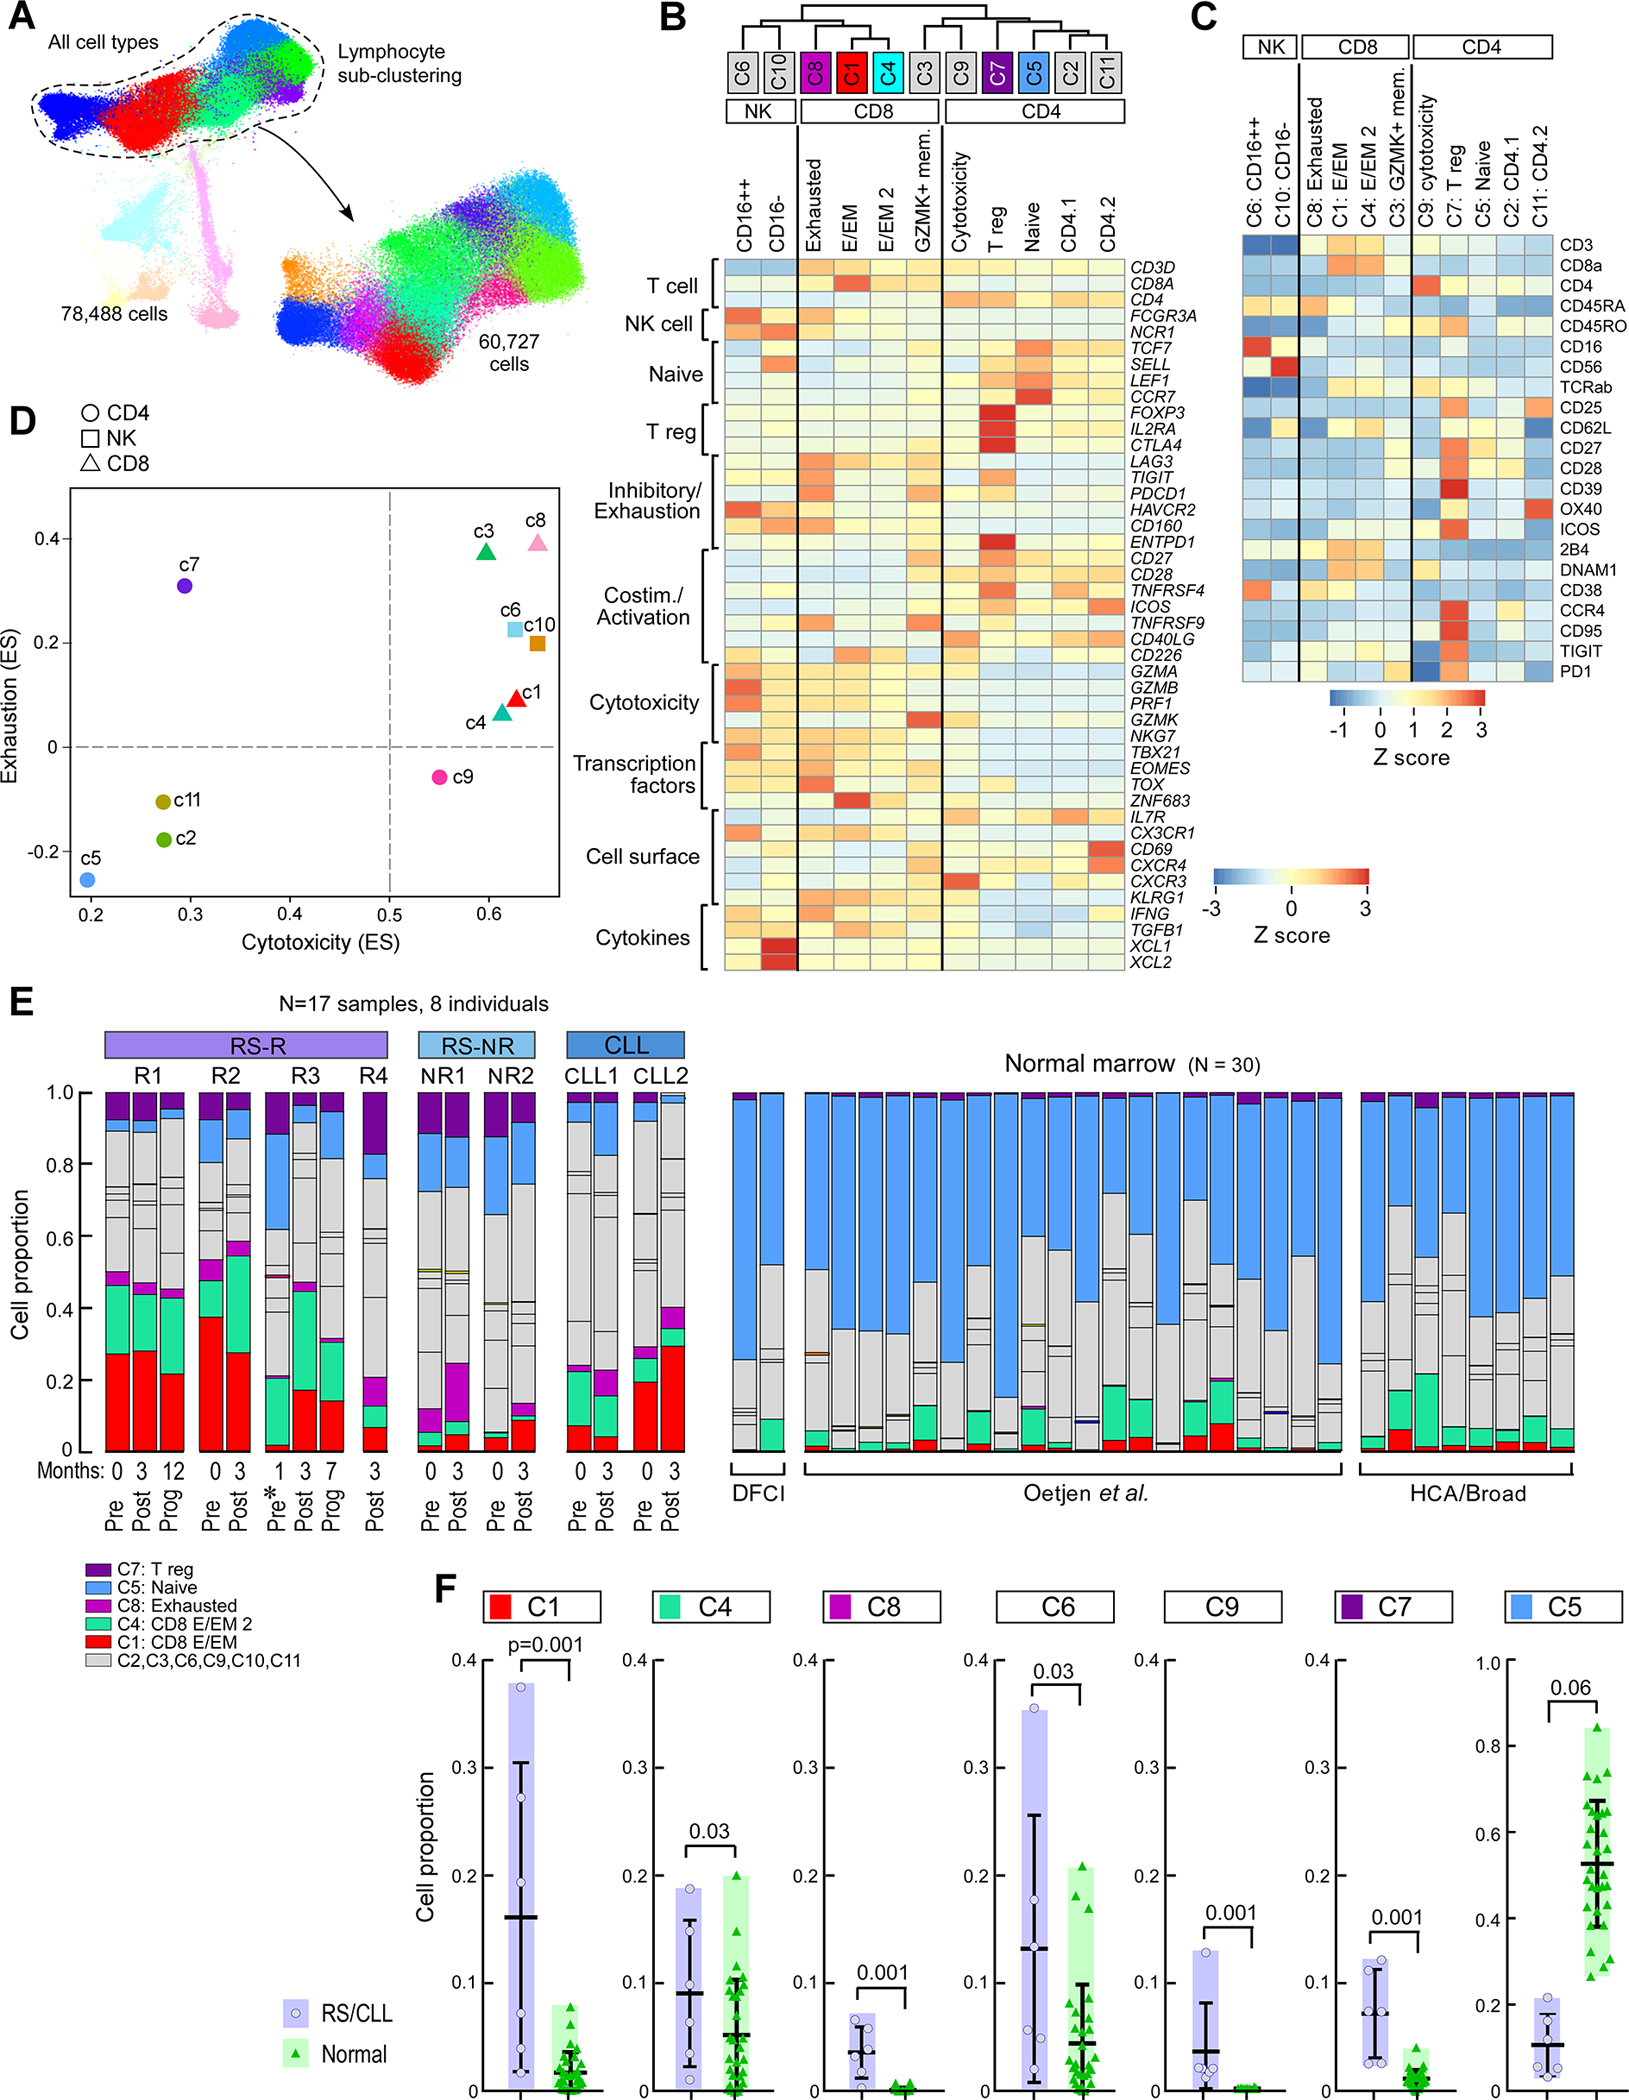
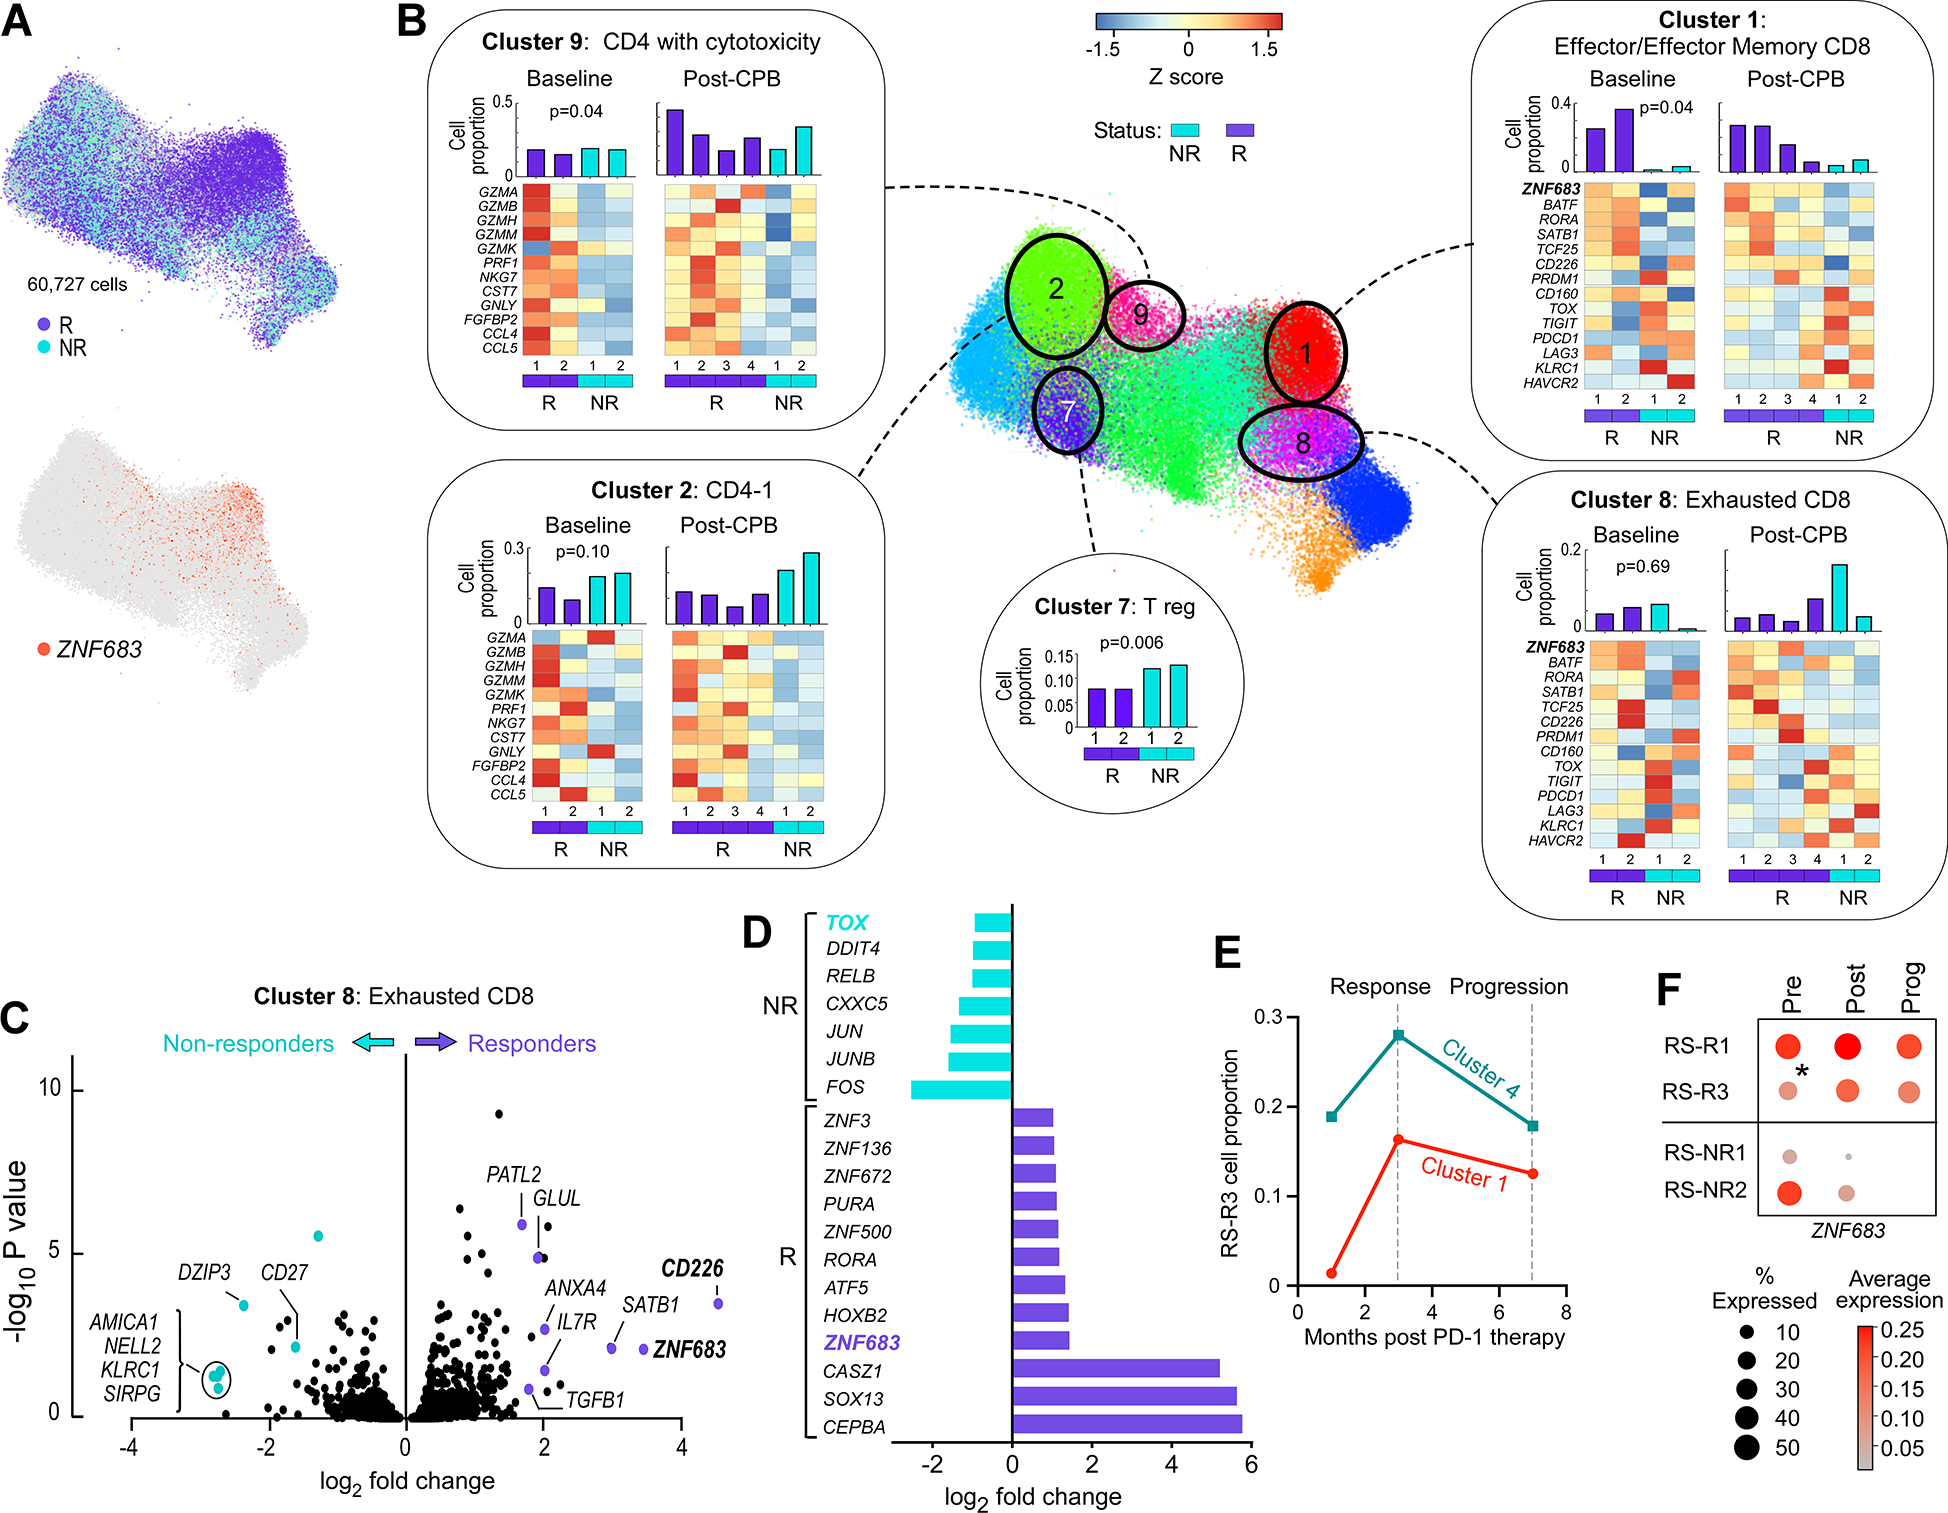
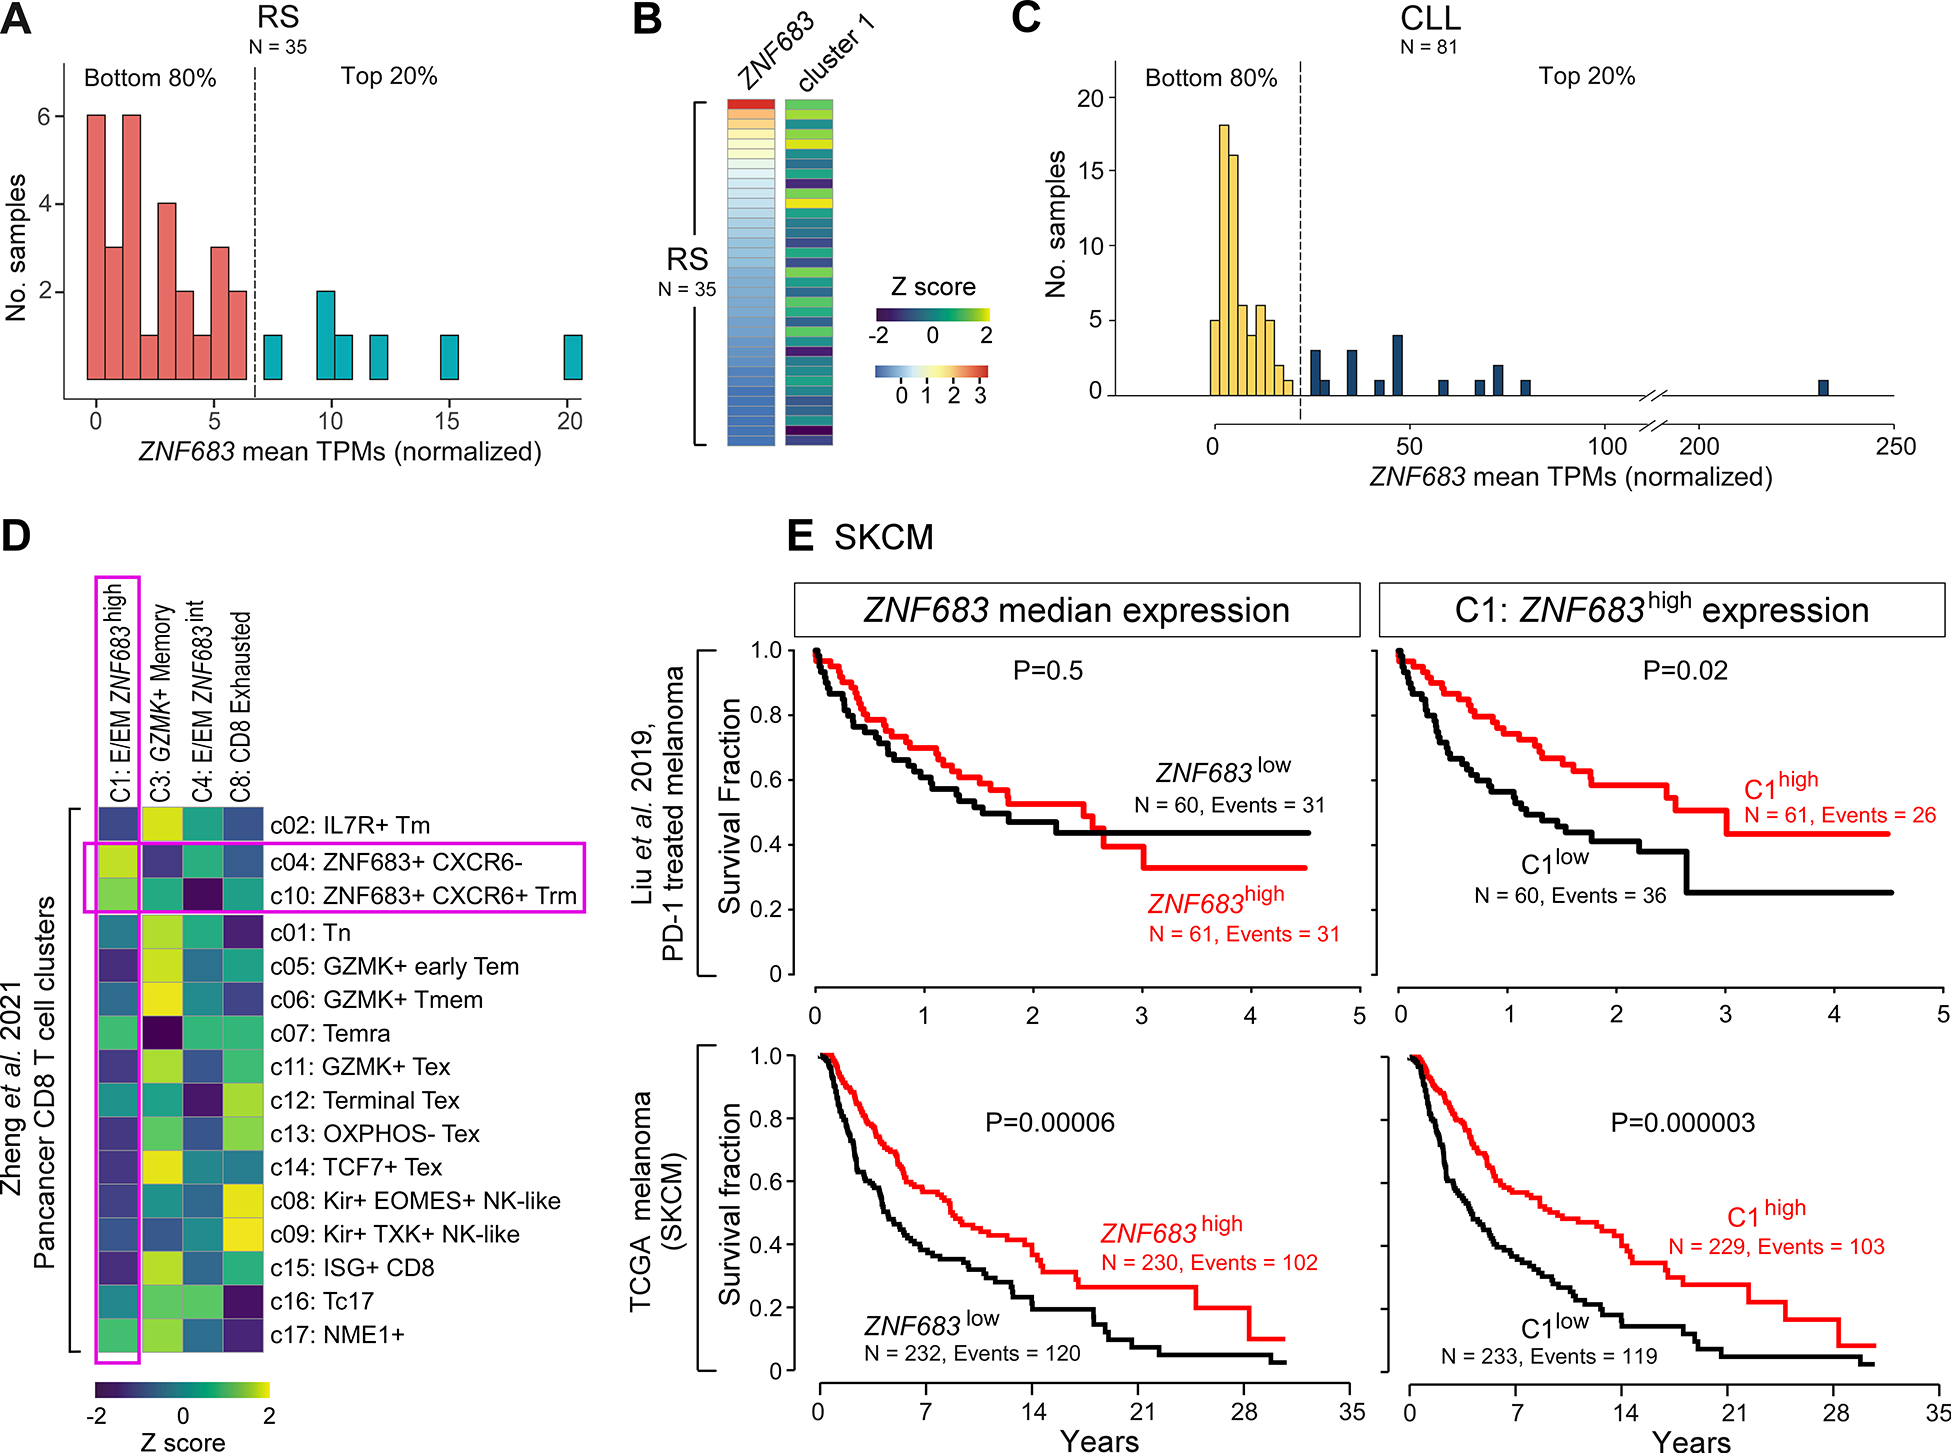
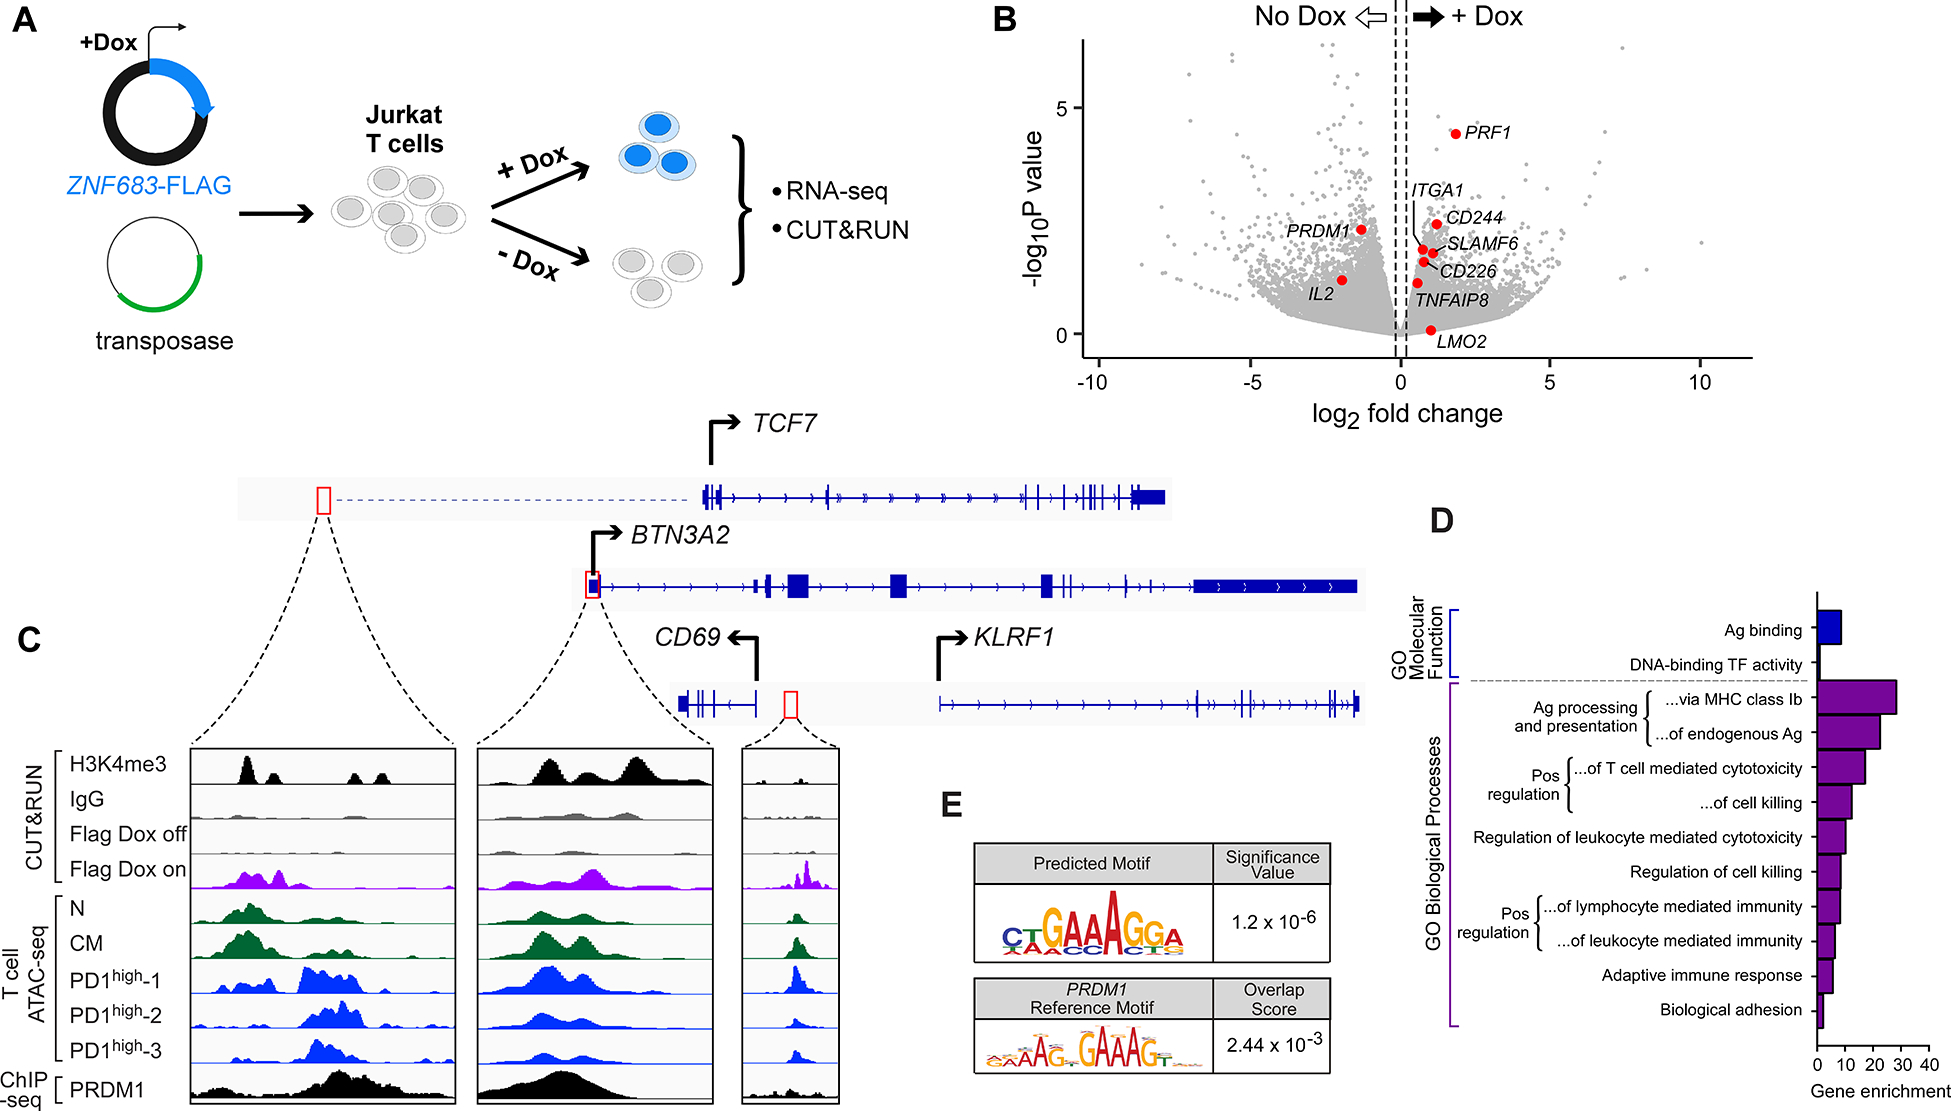
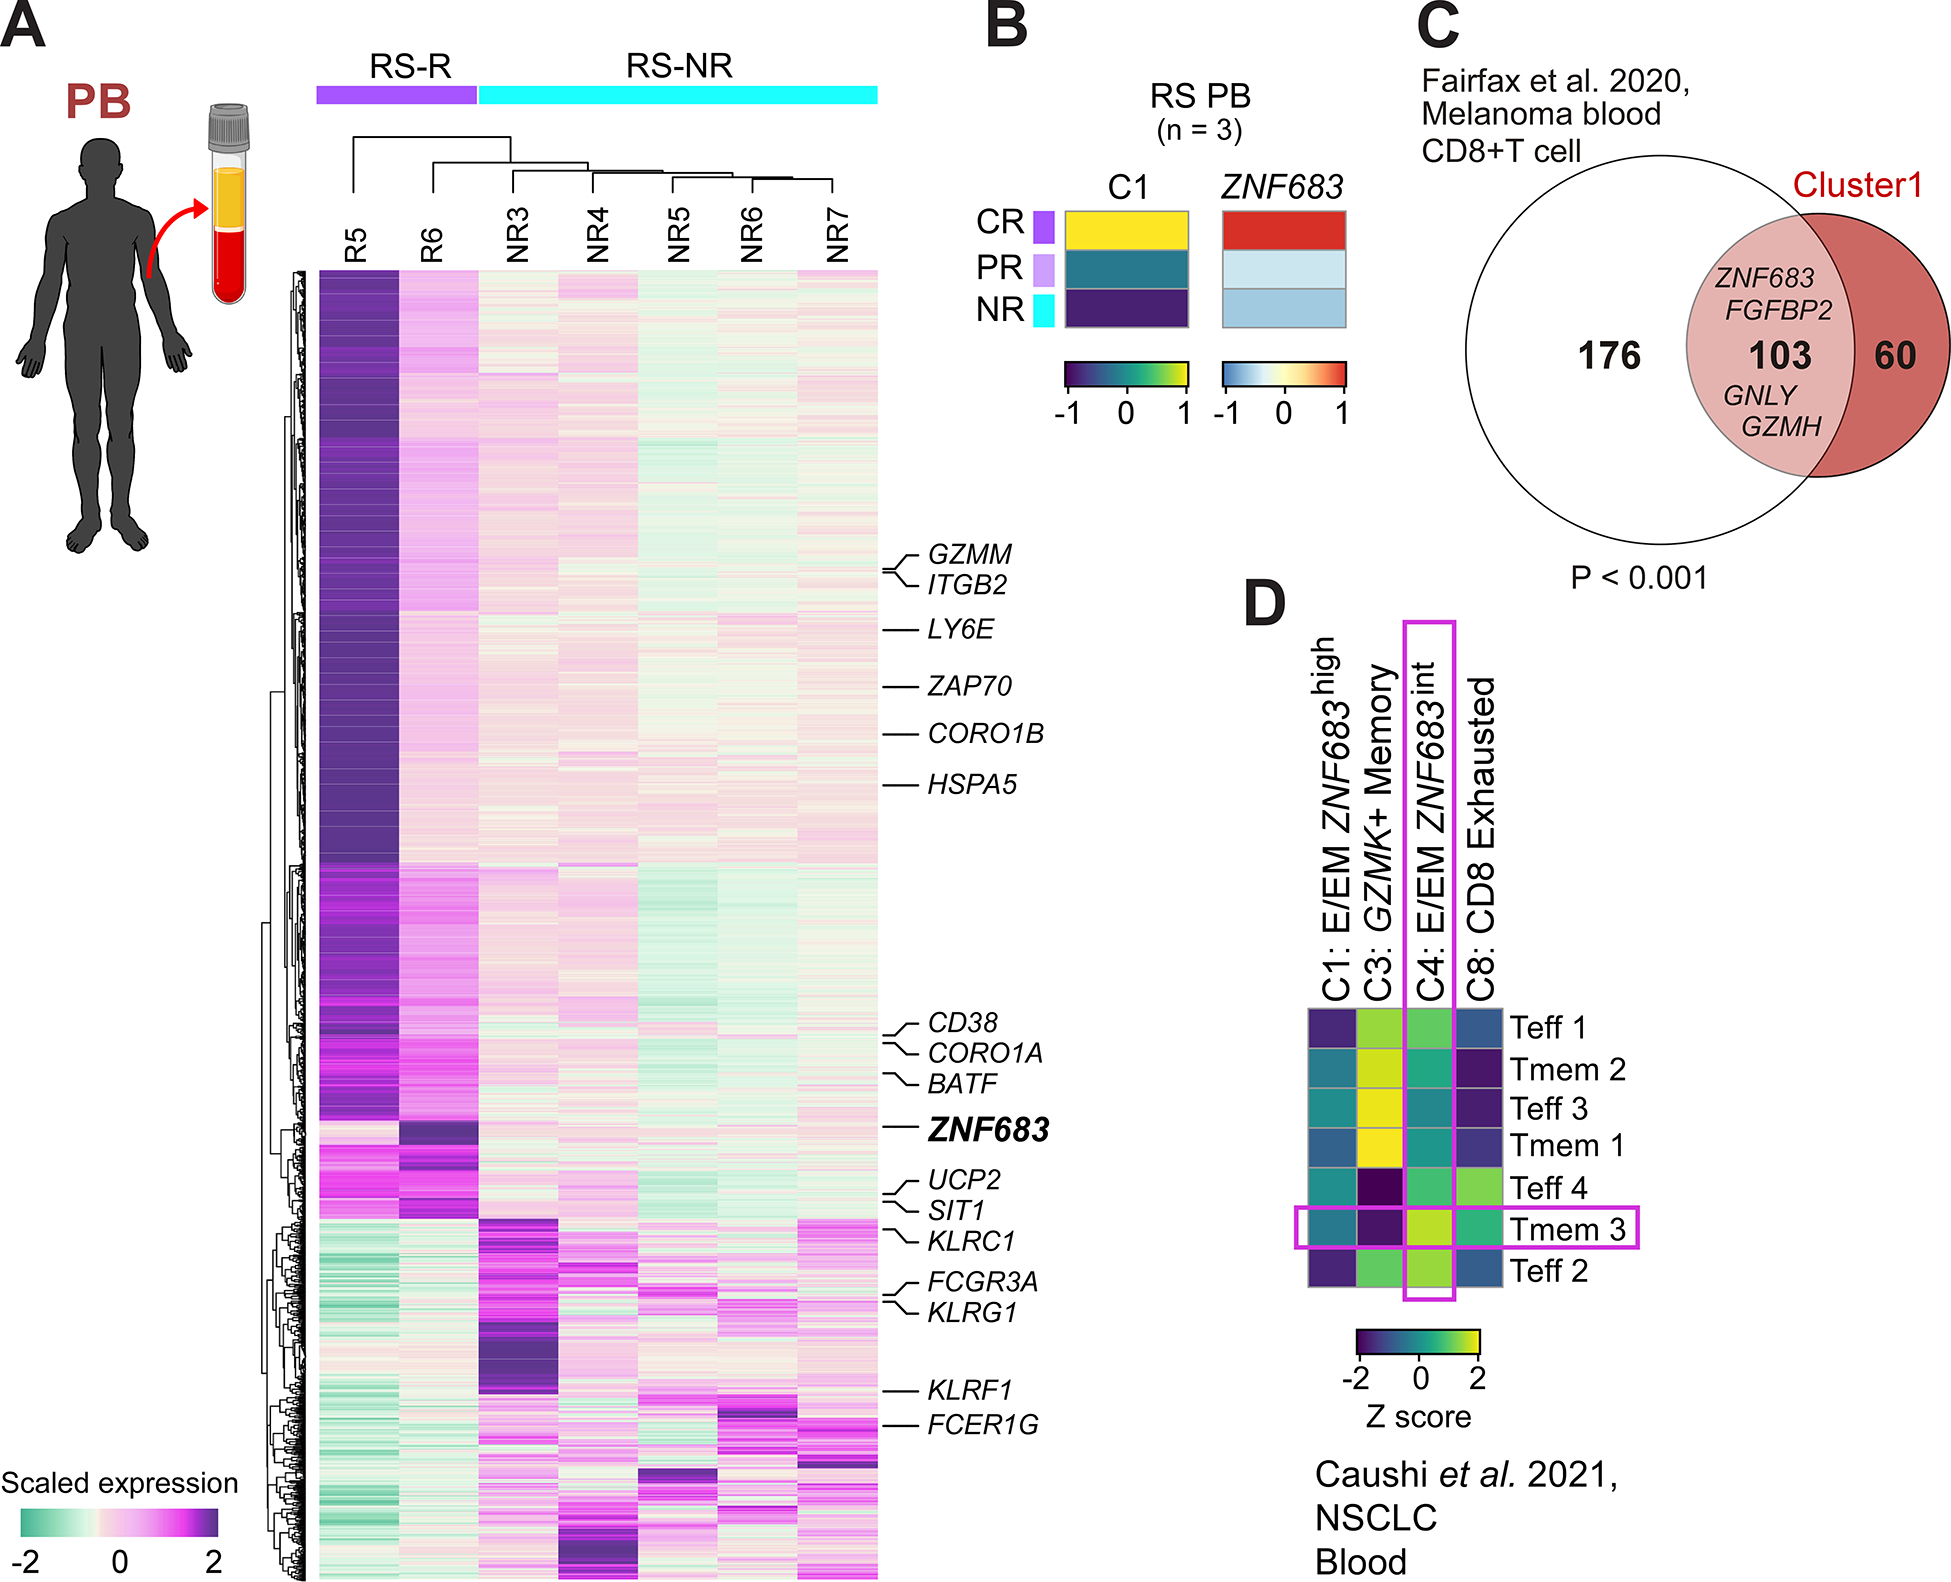
Unlike many other hematologic malignancies, Richter syndrome (RS), an aggressive B cell lymphoma originating from indolent chronic lymphocytic leukemia, is responsive to PD-1 blockade. To discover the determinants of response, we analyze single-cell transcriptome data generated from 17 bone marrow samples longitudinally collected from 6 patients with RS. Response is associated with intermediate exhausted CD8 effector/effector memory T cells marked by high expression of the transcription factor ZNF683, determined to be evolving from stem-like memory cells and divergent from terminally exhausted cells. This signature overlaps with that of tumor-infiltrating populations from anti-PD-1 responsive solid tumors. ZNF683 is found to directly target key T cell genes (TCF7, LMO2, CD69) and impact pathways of T cell cytotoxicity and activation. Analysis of pre-treatment peripheral blood from 10 independent patients with RS treated with anti-PD-1, as well as patients with solid tumors treated with anti-PD-1, supports an association of ZNF683high T cells with response.

Keywords: Hobit; PD-1; Richter transformation; ZNF683; checkpoint blockade; chronic lymphocytic leukemia; immunotherapy; single-cell RNA sequencing; t cells; tox.


Conflict of interest statement

Declaration of interests C.J.W. receives funding support from: Pharmacyclics; holds equity in: BioNTech, Inc; G.G. is a founder, consultant and holds privately held equity in Scorpion Therapeutics, receives funding support from: IBM and Pharmacyclics, is an inventor on patent applications related to: MuTect, ABSOLUTE, MutSig, MSMuTect, MSMutSig, MSIDetect, POLYSOLVER, and TensorQTL; R.G. receives funding support from: Abbvie, Janssen, Gilead, AstraZeneca, and Roche; N.J. receives research funding from: Pharmacyclics, AbbVie, Genentech, AstraZeneca, BMS, Pfizer, Servier, ADC Therapeutics, Cellectis, Precision BioSciences, Adaptive Biotechnologies, Incyte, Aprea Therapeutics, Fate Therapeutics, Mingsight, Takeda, Medisix, Loxo Oncology, Novalgen and serves on Advisory Board/Honoraria: Pharmacyclics, Janssen, AbbVie, Genentech, AstraZeneca, BMS, Adaptive Biotechnologies, Precision BioSciences, Servier, Beigene, Cellectis, TG Therapeutics, ADC Therapeutics, MEI Pharma; W.G.W. reports funding from GSK/Novartis, Abbvie, Genentech, Pharmacyclics LLC, AstraZeneca/Acerta Pharma, Gilead Sciences, Juno Therapeutics, KITE Pharma, Sunesis, Miragen, Oncternal Therapeutics, Inc., Cyclacel, Loxo Oncology, Inc., Janssen, Xencor. B.A.K., C.J.W. and G.G. are inventors on patent: “Compositions, panels, and methods for characterizing chronic lymphocytic leukemia” (PCT/US21/45144); S.A.S. reports nonfinancial support from Bristol-Myers Squibb, and equity in Agenus Inc., Agios Pharmaceuticals, Breakbio Corp., Bristol-Myers Squibb and Lumos Pharma. N.P. is currently an employee of Bristol Myers Squibb. K.J.L. holds equity in Standard BioTools Inc. (formerly Fluidigm Corporation). C.J.W. and E.M.P are inventors on a patent, US Utility Application No. US-2022-0298580-A1 filed on 02/10/2022, International Application No. WO/2021/041669 filed on 9/15/2022, “Immune Signatures Predictive of Response to PD-1 Blockade in Richter’s transformation.” M.D., J.D.K. and B.T. have no relevant conflict of interest. C.T. reports honorarium from Beigene, Janssen, Abbvie, AZ and LOXO and research funding from Beigene, Janssen, and AbbVie.

Figures

Figure 1.
Figure 1.. Single-cell RNA-sequencing cohort for determinants of response to PD-1 blockade
(A) Response data (pie chart) for RS arm of NCT 02420912 and Swimmer’s plot showing the 8 patients with RS/CLL included in the discovery cohort and treatment schema (gray bars). RS responders are represented in purple, RS non-responders are represented in light blue and relapsed/refractory patients with CLL in dark blue. Marrow sampling times are indicated by black circles and responses by green (complete), yellow (partial), red (progression) and gray (stable) overlying circles. (B) Experimental schema showing flow cytometry sorting strategy of populations used for single-cell RNA-sequencing experiments followed by analytic strategy. (C) LargeVis embedding displaying joint clustering of tumor and immune cell populations. (D) GSEA analysis shows differences between tumor transcriptome of RS vs. CLL. (E) Difference in predicted neoantigen burden (HLAthena, binding threshold <2) between antecedent CLL clones and RS clones (n=35).
Figure 2.
Figure 2.. Transcriptionally identified T cell populations in RS and CLL marrow
(A) Joint graph LargeVis embedding of immune cell populations with subsequent sub-clustering of T and NK cells revealing 11 distinct transcriptional clusters. (B) Heat map showing marker genes and cluster identities for 11 identified T and NK cell clusters. Cluster 1, red; Cluster 4, teal, Cluster 8, magenta. Values represent expression Z scores. (C) Heat map showing cell surface markers for 11 identified T and NK cell clusters by CITE-seq. Values represent expression Z scores. (D) Identified T and NK cell clusters plotted by Cytotoxicity and Exhaustion scores (Oliveira et al., 2021). (E) Bar graphs showing T and NK population distributions across serial marrow samples and normal bone marrow samples. (F) Distribution of T and NK cell populations in RS/CLL marrows (blue shading, n=6) as compared to normal bone marrow samples (green shading, n=30). p values reflect 2 sample t-tests. Bars reflect mean ±SD.
Figure 3.
Figure 3.. Gene expression changes associated with PD-1 response
(A) Joint graph LargeVis sub-clustering embedding showing RS-R (purple) and RS-NR (light blue) cells as well as ZNF683-expressing cells (red). (B) Cluster proportions for RS-R (purple) and RS-NR (blue) in bar graphs at top with heat maps showing representative cytotoxicity, exhaustion and expression changes within circled clusters for RS-R and RS-NR. Heat map values represent expression Z scores. (C) Volcano plot showing gene expression differences comparing RS-R to RS-NR cells in Cluster 8 Exhausted. (D) Top differentially expressed transcription factors in comparison of gene expression data in total CD8 T cells between RS-R and RS-NR. (E) Kinetics of cluster 1 and 4 cell proportion at on-treatment, response and progression time points in RS-R3. (F) Bubble plot showing percent expressing and average relative expression for patients with RS with progression on PD-1 blockade.
Figure 4.
Figure 4.. TCR repertoire and trajectory analysis.
(A) Single-cell TCR analysis showing captured distribution of clonotypes (pie chart) pre- and post CPB therapy (top). Cluster distribution (bottom bar plots) of top 10 expanded clonotypes from post-CPB response assessment shown for RS-R2 and RS-NR1 pre (navy) and post (light blue) CPB. (B) LargeVis joint graph embeddings showing expanded clonotype distributions (right) and ZNF683+ clonotype distributions (left) for RS-R2 (top) and RS-NR1 (bottom). (C) TCR clonotype distribution across T cell clusters in RS-R2 (left) and RS-NR1 (right) pre- and post-therapy. (D) Pre- and post-therapy clonotype frequencies are plotted on the x and y axis for RS-R2 (left) and RS-NR1 (right). Dot size reflects clonotype size and shading reflects singlets vs multiplet clones. (E) Pre-and post-therapy clonotype frequencies from bulk-TCR sequencing of 3 RS-R (right) and 4 RS-NR (left) show clonotype stability or shifts with PD-1 CPB therapy from pre-therapy to time of response. (F) Trajectory analysis of CD8 clusters showing inferred patterns of T cell differentiation across clusters. (G). ssGSEA showing overlap of CD8 T cell clusters with Daniel et al. and Giles et al. cohorts,. Values represent Z scores.
Figure 5.
Figure 5.. ZNF683 marks a distinct population in RS and CLL with prognostic significance
(A) ZNF683 TPMs corrected for T cell content in RS bulk RNA-seq samples (N=35) (top). Top 20% of samples, blue; bottom 80%, pink. (B) Cluster 1-ZNF683high signature and ZNF683 expression normalized for T cell content in bulk-RNA-seq data from 35 independent patients with RS (bottom). (C) ZNF683 TPMs corrected for T cell content in CLL bulk-RNA-seq samples (n=81) (top). Top 20% of samples, blue; bottom 80%, yellow. (D) Heatmap showing Z scores of single-sample GSEA scores for identified CD8+ T cell clusters as compared to Pancancer analysis CD8+ T cell clusters (Zheng et al., 2021). (E) Survival curve showing ZNF683 expression and C1 gene expression signature with overall survival in PD-1 treated (top) and TCGA melanoma (bottom) data.
Figure 6.
Figure 6.. ZNF683 directly regulates key pathways of T cell activation and function
(A) Schema showing doxycycline-inducible expression of ZNF683 in Jurkat cells. (B) Volcano plot showing genes differentially regulated by ZNF683 induction by RNA-seq. (C) CUT&RUN on Jurkat cell lines (top) shows binding of ZNF683 at regions surrounding key immune genes that correspond to differential ATAC-seq peaks in T cell subsets and prior PRDM1 ChIP-seq data. N, Naïve; CM, Central memory, PD-1high, PD-1 high tumor infiltrating CD8 T cells. (D) Top pathways predicted to be differentially regulated by ZNF683 through CISTROME-GO analysis. (E) Top predicted motifs for ZNF683 (top) compared to reference PRDM1 motif (below).
Figure 7.
Figure 7.. ZNF683 expression in peripheral blood associates with CPB response status
(A) Heatmap of differential gene expression results from bulk RNA-seq on peripheral blood human T cells from additional RS-R and RS-NR highlighting that ZNF683 is associated with PD-1 response. Values represent expression Z scores. (B) Heatmap of single sample C1 GSEA and ZNF683 expression of N=3 additional samples of PD-1 treated RS (NCT02795182). Values represent expression Z scores. (C) Overlap analysis showing similarity of C1 ZNF683high signature to CD8+ T cell peripheral blood population tied to PD-1 response in melanoma. p value reflects hypergeometric test (Methods). (D) Single sample GSEA analysis showing overlap of CD8+ T cell clusters with peripheral blood CD8+ T cell populations from Non-small cell lung cancer (NSCLC). Values represent expression Z scores.

References

    1. Jain N, Senapati J, Thakral B, Ferrajoli A, Thompson PA, Burger JA, Basu S, Kadia TM, Daver NG, Borthakur G, et al. (2022). A Phase 2 Study of Nivolumab Combined with Ibrutinib in Patients with Diffuse Large B-cell Richter Transformation of CLL. Blood Adv, bloodadvances.2022008790. 10.1182/bloodadvances.2022008790. - DOI - PMC - PubMed
    1. Ding W, LaPlant BR, Call TG, Parikh SA, Leis JF, He R, Shanafelt TD, Sinha S, Le-Rademacher J, Feldman AL, et al. (2017). Pembrolizumab in patients with CLL and Richter transformation or with relapsed CLL. Blood 129, 3419–3427. 10.1182/blood-2017-02-765685. - DOI - PMC - PubMed
    1. Younes A, Brody J, Carpio C, Lopez-Guillermo A, Ben-Yehuda D, Ferhanoglu B, Nagler A, Ozcan M, Avivi I, Bosch F, et al. (2019). Safety and activity of ibrutinib in combination with nivolumab in patients with relapsed non-Hodgkin lymphoma or chronic lymphocytic leukaemia: a phase 1/2a study. Lancet Haematol. 6, e67–e78. 10.1016/S2352-3026(18)30217-5. - DOI - PubMed
    1. Parikh SA, Kay NE, and Shanafelt TD (2014). How we treat Richter syndrome. Blood 123, 1647–1657. 10.1182/blood-2013-11-516229. - DOI - PMC - PubMed
    1. Mackay LK, Minnich M, Kragten NAM, Liao Y, Nota B, Seillet C, Zaid A, Man K, Preston S, Freestone D, et al. (2016). Hobit and Blimp1 instruct a universal transcriptional program of tissue residency in lymphocytes. Science 352, 459–463. 10.1126/science.aad2035. - DOI - PubMed

Publication types

MeSH terms