. 2023 Oct 11;31(10):1668-1684.e12.
doi: 10.1016/j.chom.2023.08.003. Epub 2023 Sep 21.

Impact of SARS-CoV-2 ORF6 and its variant polymorphisms on host responses and viral pathogenesis

Affiliations

Impact of SARS-CoV-2 ORF6 and its variant polymorphisms on host responses and viral pathogenesis

Thomas Kehrer et al. Cell Host Microbe. .

Abstract

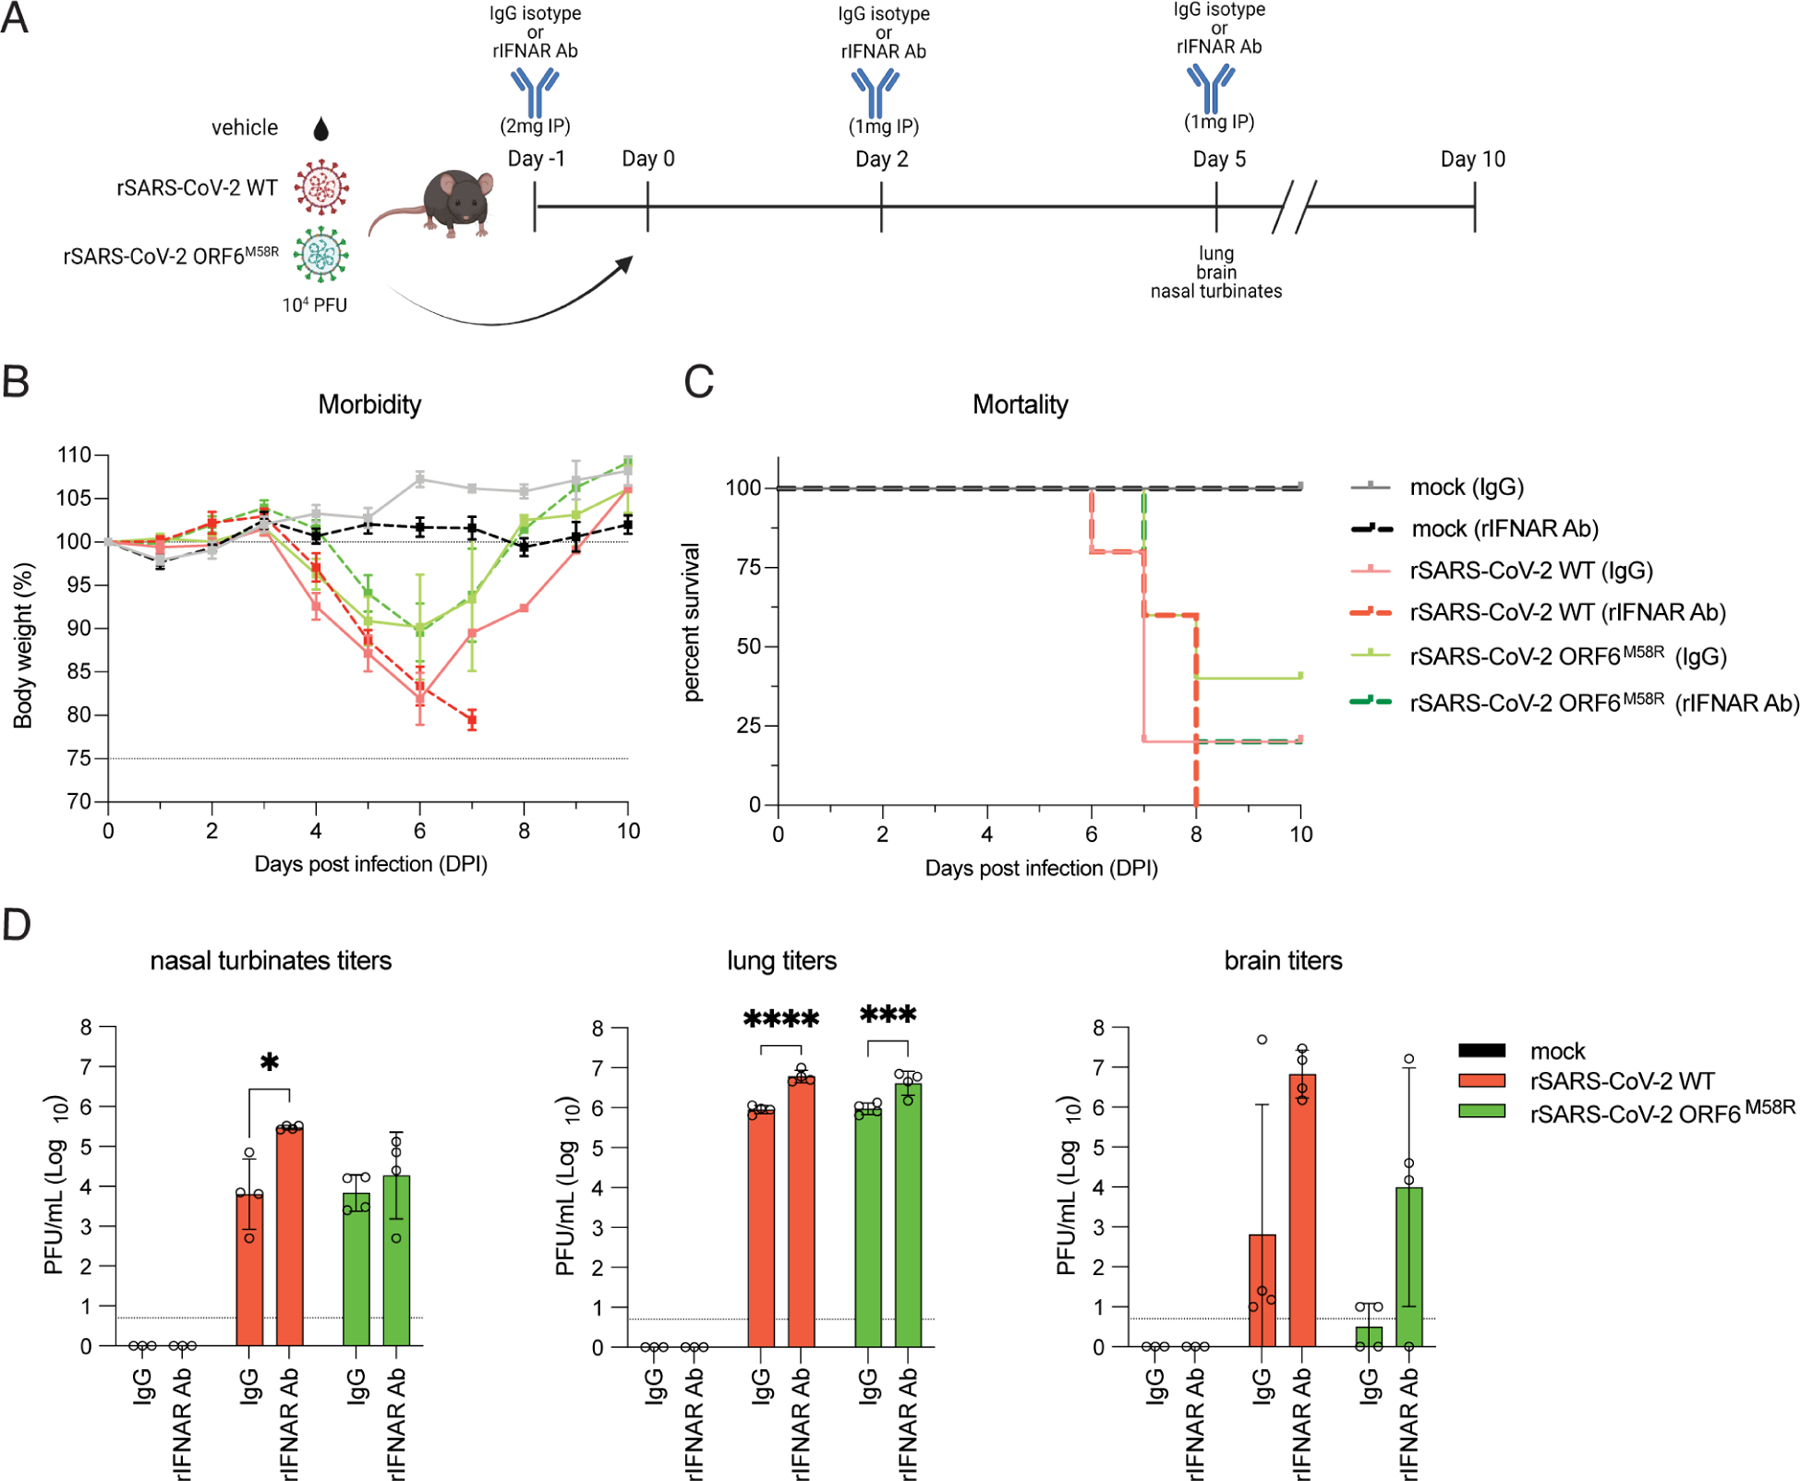
Severe acute respiratory syndrome coronavirus 2 (SARS-CoV-2) encodes several proteins that inhibit host interferon responses. Among these, ORF6 antagonizes interferon signaling by disrupting nucleocytoplasmic trafficking through interactions with the nuclear pore complex components Nup98-Rae1. However, the roles and contributions of ORF6 during physiological infection remain unexplored. We assessed the role of ORF6 during infection using recombinant viruses carrying a deletion or loss-of-function (LoF) mutation in ORF6. ORF6 plays key roles in interferon antagonism and viral pathogenesis by interfering with nuclear import and specifically the translocation of IRF and STAT transcription factors. Additionally, ORF6 inhibits cellular mRNA export, resulting in the remodeling of the host cell proteome, and regulates viral protein expression. Interestingly, the ORF6:D61L mutation that emerged in the Omicron BA.2 and BA.4 variants exhibits reduced interactions with Nup98-Rae1 and consequently impairs immune evasion. Our findings highlight the role of ORF6 in antagonizing innate immunity and emphasize the importance of studying the immune evasion strategies of SARS-CoV-2.

Keywords: ORF6; Omicron variant; SARS-CoV-2; SARS-CoV-2 pathogenesis; interferon; mRNA export; nuclear import; nucleocytoplasmic trafficking; virus-host interaction.


Conflict of interest statement

Declaration of interests The A.G.-S. laboratory has received research support from Pfizer, Senhwa Biosciences, Kenall Manufacturing, Blade Therapuetics, Avimex, Johnson & Johnson, Dynavax, 7Hills Pharma, Pharmamar, ImmunityBio, Accurius, Nanocomposix, Hexamer, N-fold LLC, Model Medicines, Atea Pharma, Applied Biological Laboratories and Merck, outside of the reported work. A.G.-S. has consulting agreements for the following companies involving cash and/or stock: Castlevax, Amovir, Vivaldi Biosciences, Contrafect, 7Hills Pharma, Avimex, Vaxalto, Pagoda, Accurius, Esperovax, Farmak, Applied Biological Laboratories, Pharmamar, Paratus, CureLab Oncology, CureLab Veterinary, Synairgen and Pfizer, outside of the reported work. A.G.-S. has been an invited speaker in meeting events organized by Seqirus, Janssen, Abbott, and Astrazeneca. A.G.-S. is inventor on patents and patent applications on the use of antivirals and vaccines for the treatment and prevention of virus infections and cancer, owned by ISMMS, New York. C.Y. and L. M.-S. are co-inventors on a patent application directed to reverse genetics approaches to generate recombinant SARS-CoV-2. The Krogan Laboratory has received research support from Vir Biotechnology, F. Hoffmann-La Roche, and Rezo Therapeutics. N.J.K. has previously held financially compensated consulting agreements with the Icahn School of Medicine at Mount Sinai, New York and Twist Bioscience Corp. He currently has financially compensated consulting agreements with Maze Therapeutics, Interline Therapeutics, Rezo Therapeutics, and GEn1E Lifesciences, Inc.. He is on the Board of Directors of Rezo Therapeutics and is a shareholder in Tenaya Therapeutics, Maze Therapeutics, Rezo Therapeutics, and Interline Therapeutics. A.M. is the creator of Omics Bioinformatics and owns all the stocks of this company. ISMMS has filed patent applications relating to SARS-CoV-2 serological assays which list V.S. as co-inventor.

Figures

Figure 1.
Figure 1.. ORF6 is essential for inhibition of STAT1/2 nuclear import and optimal replication in IFN competent cells
(A) Schematic illustration of the genome organization of recombinant viruses used in our studies. (B) Growth curve in Vero E6 cells or (C) A549-ACE2 cells infected at MOI 0.1. (D) Growth curve in HTBE cultures infected with 105 PFU. (E) Vero E6 cells were infected with the indicated viruses at MOI 0.5 for 24h before treatment with universal IFN and Western blot analysis. (F) Vero E6 cells were infected with the indicated viruses and then treated with IFN universal prior to fixation. The subcellular localization of STAT2 was analyzed by confocal microscopy. STAT2 nuclear translocation in infected cells was quantified from ≥150 cells per condition (n=2). (G) A549-ACE2 cells were infected with the indicated viruses for 24h. Expression and phosphorylation status of the of the indicated proteins was determined by Western blot. (H) A549-ACE2 cells were infected with the indicated viruses for 24 hours to assess the subcellular localization of STAT2 by immunofluorescence. STAT2 nuclear translocation in in infected cells was quantified from ≥150 cells per condition (n=2). (I) A549-ACE2 cells were infected for 24h and then subjected to immunoprecipitation of endogenous Nup98 followed by Western blot analysis. Data in B-D were analyzed by two-way ANOVA Tukey’s multiple comparison test. Data in F and H were analyzed by ordinary one-way ANOVA using Tukey’s multiple comparison test. Graphs were generated with PRISM (version 9).
Figure 2.
Figure 2.. ORF6 selectively blocks nuclear import of innate immune transcription factors
(A) HEK293T cells were transfected with ORF6, ORF6-M58R or empty vector along with FLAG-RIG-I-2CARD and IRF3-GFP. Nuclear translocation of IRF3-GFP in control and ORF6/RIG-I-2CARD double-positive cells was quantified from three fields of view collected from two independent experiments. (B) HEK293T cells were transfected with plasmids expressing ORF6 or ORF6-M58R or HCV NS3/4A, along with FLAG-RIG-I-2CARD and a plasmid encoding an IRF3-firefly luciferase reporter (n=3). Cell lysates from the reporter assay were analyzed by Western blot. (C) HEK293T cells were treated with TNF-α 24h post-transfection with the indicated plasmids and the subcellular localization of p65 was assessed immunofluorescence. Nuclear translocation of p65 was quantified from four fields of view collected from two independent experiments. (D) HEK293T cells were transfected with an NFKB-firefly luciferase reporter along with the indicated plasmids. At 24h post-transfection, cells were treated with TNF-α and used for dual luciferase reporter assay (n=3). Cell lysates were analyzed by Western blot. (E) A549-ACE2 cells were infected and processed for assessment of the subcellular localization of p65 by immunofluorescence. p65 nuclear translocation in infected cells was quantified from ≥150 cells per condition (n=2). (F) Same as E but subcellular localization of IRF3 was assessed. (G) A549-ACE2 cells were infected with the indicated viruses for 24h. Expression and phosphorylation status of the indicated proteins was determined by Western blot. Data in A-D were analyzed by ordinary one-way ANOVA using Tukey’s multiple comparison test. Data in E-F were analyzed by two-tailed unpaired Students t-test. Graphs were generated with Graphpad PRISM (version 9).
Figure 3.
Figure 3.. ORF6 disrupts mRNA nuclear export and contributes to host translational shutdown during infection.
(A) HEK293T were transfected with the indicated plasmids and subjected to poly(A) RNA immune-FISH analysis. (B) A549-ACE2 cells were infected with the indicated viruses for 24h and then subject to subcellular fractionation. Total RNA was isolated and subjected to RT-qPCR. Graph shows N/C ratio of indicated transcripts after normalization to respective compartment markers. (C) A549-ACE2 cells were infected 24 h before fixation and processed for smRNA-FISH to determine subcellular localization of NFKB1 transcripts. Transcript localization in infected cells was quantified from ≥30 cells per condition from three biological replicates. Data are shown as violin plots, solid line marks median, dashed lines mark quartiles. (D) Same as C but localization of NUAK2 transcripts was quantified. (E-G) A549-ACE2 cells were infected and processed for mass spectrometry analysis (see Methods). The quantity of each protein was statistically compared between each condition generating a log2 fold change (log2FC) and adjusted p-values. (E) Volcano plots of abundance proteomics depicting changes in protein expression for indicated comparisons (e.g. ΔORF6-WT indicates log2(ΔORF6/WT)), with log2 fold change (log2FC) on the x-axis and adjusted p-values on the y-axis. (F) The number of proteins that significantly decrease (absolute value log2FC > 1 and adjusted p < 0.05) between each mutant and wildtype condition (blue dots from E), as indicated. (G) Gene Ontology (GO) Biological Process gene set overrepresentation analysis using proteins either significantly up- or down-regulated (blue dots from E) between each mutant and wild type condition, as indicated. Numbers indicate the number of proteins mapping to each term, red numbers indicate a significant (adjusted p-value < 0.05) enrichment whereas grey numbers indicate a non-significant enrichment. Additionally, background colors in heatmap denote the -log10 adjusted p-values (see colorbar). Data in A-D were analyzed by ordinary one-way ANOVA using Tukey’s multiple comparison test. Data in E-G were analyzed as described in methods.
Figure 4.
Figure 4.. ORF6 plays a critical role in SARS-CoV-2 pathogenesis in Syrian hamsters.
(A) Schematic of the in vivo experiment using Golden Syrian hamsters. (B) Hamster weight as a percentage of their weight on day 0. Weight loss data is shown as mean ± SEM. (C) Lung and nasal turbinates titers. Dashed line indicates the limit of detection for plaque assay (50 PFU/mL) (n=4). (D) Lung to body weight ratio for animals sacrificed at the indicated days post-infection. Line indicates mean value (n=4). (E) Representative images of lung H&E staining for all three groups of animals at day 6 post-infection. Graph shows the consolidated lung area at the indicated time points (n=4). Scale bars in histology slides = 500 μm. (F) Tissue sections from animals at day 6 post-infection were stained for DAPI and Ki67 (n=4). Ki67-positive nuclei were quantified as described in methods. (G) Tissue sections from indicated animals were stained for DAPI, pSTAT1, and SARS-CoV-2 Spike. pSTAT1 nuclear translocation was quantified as described in methods. Images show representative staining from day 4 post-infection. (H) Tissue sections from indicated animals were stained for DAPI and Mx1. Images show representative Mx1 staining from day 6 post-infection. Data in B were analyzed using mixed-effects model analysis (REML) Šídák’s multiple comparisons test. Data in C-E and H were analyzed by two-way ANOVA using Šídák’s multiple comparisons test. Data in F and G were analyzed by ordinary one-way ANOVA using Tukey’s multiple comparison test. Graphs were generated with PRISM (version 9).
Figure 5.
Figure 5.. Comparison of viral RNA and protein expression between rSARS-CoV-2 WT and rSARS-CoV-2 ΔORF6.
(A) Expression of viral proteins from mass spectrometry abundance proteomics. Graph shows log2 ratio of summed peptide intensities per viral protein of ΔORF6-infected over WT-infected cells. (B) Abundance of the indicated viral proteins assessed by Western blot. (C) Viral gRNA and sgRNA abundance in A549-ACE2 cells infected with indicated viruses. Data are shown as ratio of mapped reads of indicated viral RNA species over the sum of viral reads per sample. (D) Viral gRNA copy number per μg of total RNA and ratio of indicated sgRNAs over gRNA per sample from samples described in C as determined by qRT-PCR. (E) Vero E6 cells were infected as indicated and viral protein expression was assessed by Western blot. Quantification of viral protein expression from three biological replicates is shown on the right panels. Data in A-B were analyzed by two-tailed unpaired Students multiple T-test. Data in C-D were analyzed by Man-Whitney test with a false detection rate of 5%. Data in E were analyzed by ordinary one-way ANOVA using Tukey’s multiple comparison test. Graphs were generated with PRISM (version 9).
Figure 6.
Figure 6.. ORF6 contributes to SARS-CoV-2 pathogenesis in K18 human ACE2 transgenic mice.
(A) Schematic of the in vivo experiment using K18 human ACE2 mice treated with IgG isotype control or rIFNAR blocking antibodies. (B) Weight loss data for the duration of the experiment is shown as mean ± SEM. (C) Mouse survival data for the duration of the experiment. (D) Nasal turbinates, lung, and brain viral titers at 5 days post-infection. Dashed line indicates the limit of detection for plaque assay (5 PFU/mL) (n=4). Data in D were analyzed by two-way ANOVA using Tukey’s multiple comparison test. Graphs were generated with PRISM (version 9).
Figure 7.
Figure 7.. Characterization of the ORF6 D61L mutation.
(A) HEK293T cells were transfected with the indicated plasmids and lysates subjected to HA-tag immuno-precipitation as described in methods (IP: HA = eluate after immunoprecipitation, WCE = whole cell extract). (B) HEK293T cells were transfected with the indicated plasmids and then treated with IFN. The subcellular localization of STAT2 was analyzed by immunofluorescence. STAT2 nuclear translocation was quantified from ≥150 cells per condition from two biological replicates. (C) HEK293T cells were transfected with the indicated plasmids and then processed for assessment of the subcellular localization of IRF3-GFP. Nuclear translocation of IRF3-GFP in control and ORF6/RIG-I-2CARD double-positive cells was quantified from four fields of view collected from two independent experiments. (D) Vero E6 cells were infected with the indicated viruses and then treated with IFN. STAT2 nuclear translocation in infected cells was quantified from ≥150 cells per condition (n=2). (E) A549-ACE2 cells were infected with indicated viruses and processed for smRNA-FISH to determine subcellular localization of NUAK2 transcripts. Transcript localization in infected cells was quantified from ≥15 cells per condition. Data are shown as violin plots, solid line marks median, dashed lines mark quartiles. (F) Growth curve of indicated viruses in A549-ACE2 cells. Data in B-E were analyzed by ordinary one-way ANOVA using Tukey’s multiple comparison test. Graphs were generated with PRISM (version 9).

Update of

References

    1. Blanco-Melo D, Nilsson-Payant BE, Liu WC, Uhl S, Hoagland D, Moller R, Jordan TX, Oishi K, Panis M, Sachs D, et al. (2020). Imbalanced Host Response to SARS-CoV-2 Drives Development of COVID-19. Cell 181, 1036–1045 e1039. 10.1016/j.cell.2020.04.026. - DOI - PMC - PubMed
    1. Morens DM, and Fauci AS (2020). Emerging Pandemic Diseases: How We Got to COVID-19. Cell 182, 1077–1092. 10.1016/j.cell.2020.08.021. - DOI - PMC - PubMed
    1. Park A, and Iwasaki A (2020). Type I and Type III Interferons - Induction, Signaling, Evasion, and Application to Combat COVID-19. Cell Host Microbe 27, 870–878. 10.1016/j.chom.2020.05.008. - DOI - PMC - PubMed
    1. Boudewijns R, Thibaut HJ, Kaptein SJF, Li R, Vergote V, Seldeslachts L, Van Weyenbergh J, De Keyzer C, Bervoets L, Sharma S, et al. (2020). STAT2 signaling restricts viral dissemination but drives severe pneumonia in SARS-CoV-2 infected hamsters. Nat Commun 11, 5838. 10.1038/s41467-020-19684-y. - DOI - PMC - PubMed
    1. Bastard P, Rosen LB, Zhang Q, Michailidis E, Hoffmann HH, Zhang Y, Dorgham K, Philippot Q, Rosain J, Beziat V, et al. (2020). Autoantibodies against type I IFNs in patients with life-threatening COVID-19. Science 370. 10.1126/science.abd4585. - DOI - PMC - PubMed