. 2024;17(1):131-148.
doi: 10.1016/j.jcmgh.2023.09.005. Epub 2023 Sep 20.

Enterobacteriaceae Growth Promotion by Intestinal Acylcarnitines, a Biomarker of Dysbiosis in Inflammatory Bowel Disease

Affiliations

Enterobacteriaceae Growth Promotion by Intestinal Acylcarnitines, a Biomarker of Dysbiosis in Inflammatory Bowel Disease

Johanna M S Lemons et al. Cell Mol Gastroenterol Hepatol. 2024.

Abstract

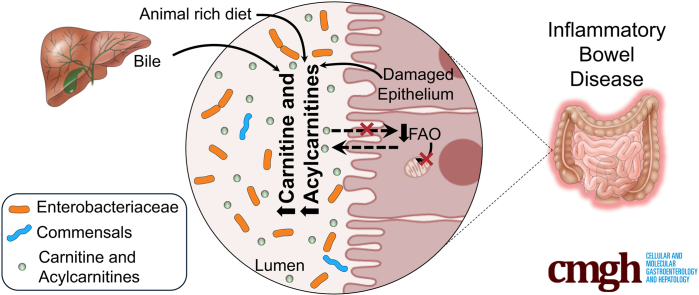
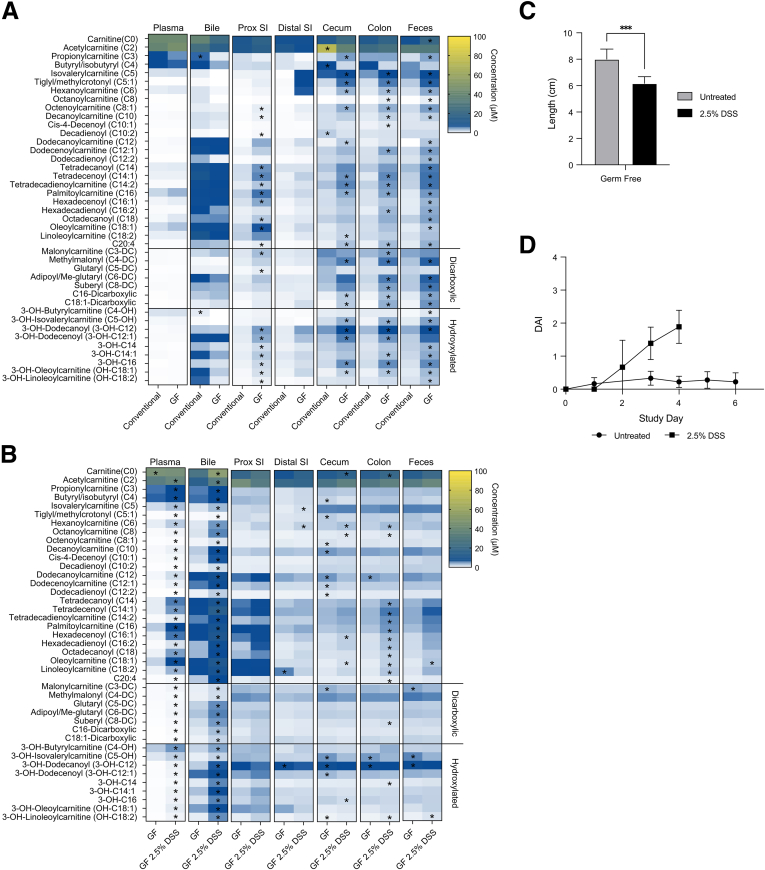
Background & aims: Altered plasma acylcarnitine levels are well-known biomarkers for a variety of mitochondrial fatty acid oxidation disorders and can be used as an alternative energy source for the intestinal epithelium when short-chain fatty acids are low. These membrane-permeable fatty acid intermediates are excreted into the gut lumen via bile and are increased in the feces of patients with inflammatory bowel disease (IBD).

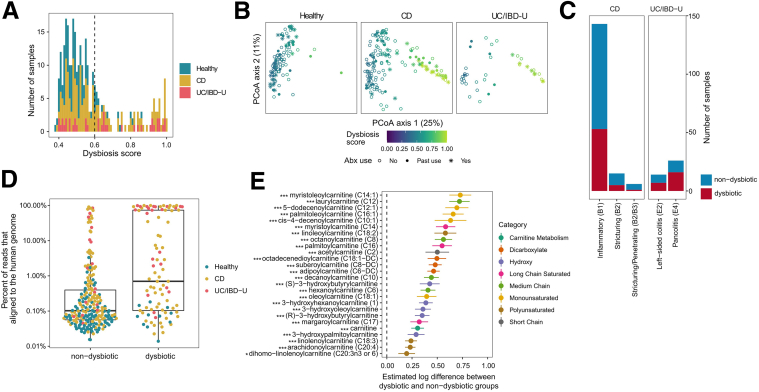
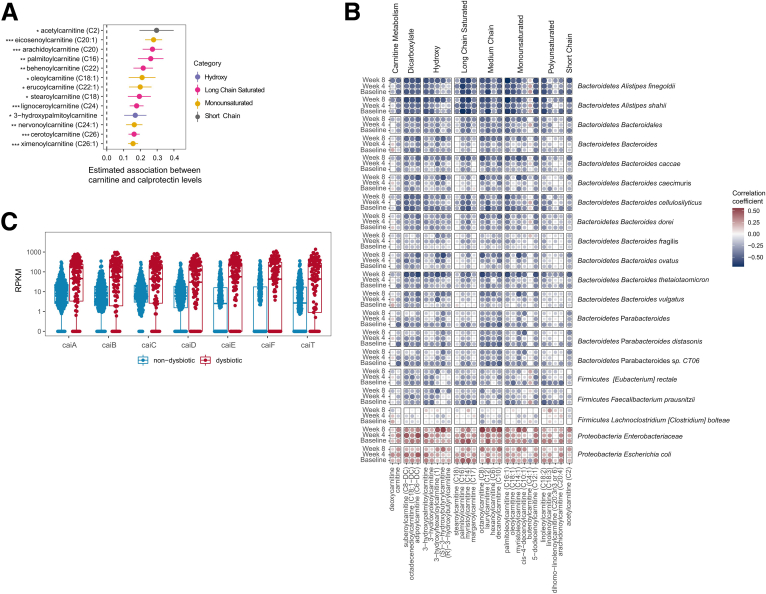
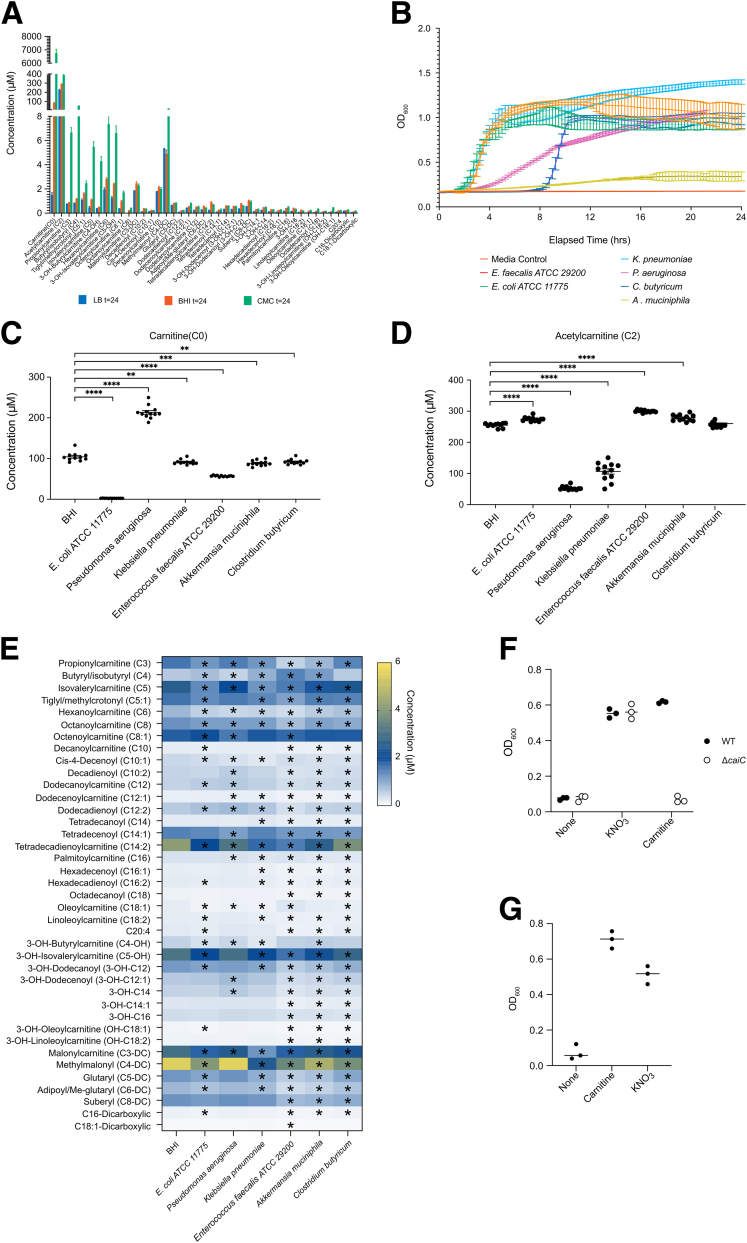
Methods: Herein, based on studies in human subjects, animal models, and bacterial cultures, we show a strong positive correlation between fecal carnitine and acylcarnitines and the abundance of Enterobacteriaceae in IBD where they can be consumed by bacteria both in vitro and in vivo.

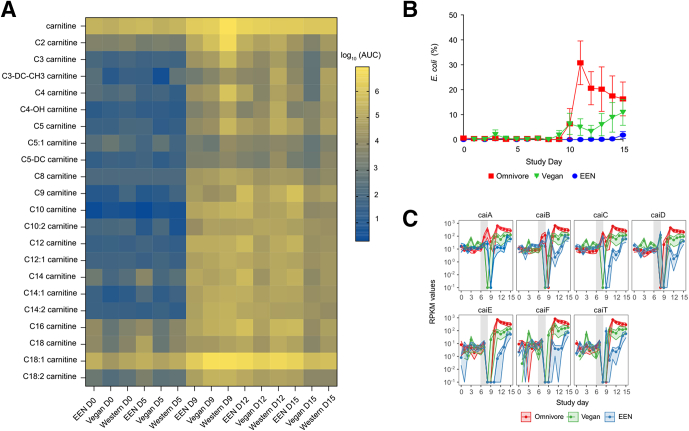
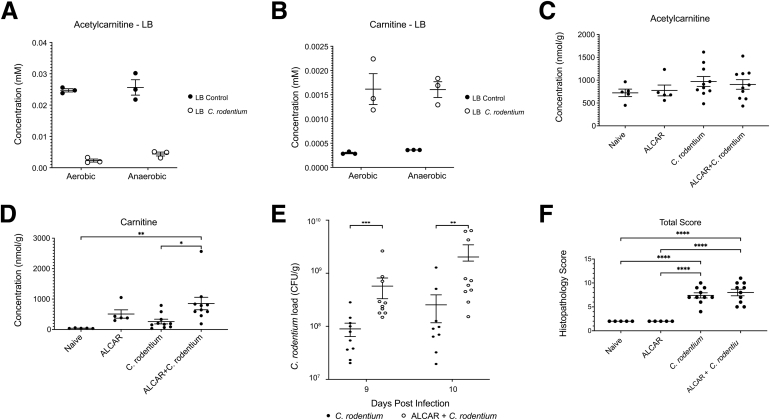
Results: Carnitine metabolism promotes the growth of Escherichia coli via anaerobic respiration dependent on the cai operon, and acetylcarnitine dietary supplementation increases fecal carnitine levels with enhanced intestinal colonization of the enteric pathogen Citrobacter rodentium.

Conclusions: In total, these results indicate that the increased luminal concentrations of carnitine and acylcarnitines in patients with IBD may promote the expansion of pathobionts belonging to the Enterobacteriaceae family, thereby contributing to disease pathogenesis.

Keywords: Carnitine; IBD; Metabolism; Microbiota.


Figures

None
Graphical abstract
Figure 1
Figure 1
Correlation analysis of dysbiosis in IBD and fecal acylcarnitines levels. (A) Distribution of microbial dysbiosis scores among all patient samples by diagnosis: CD, UC, and IBD-U. Dotted line denotes the threshold above which samples are classified as dysbiotic. (B) Principal component analysis (PCoA) plots based on the Bray–Curtis dissimilarity of the gut microbiome. All samples were used to make a common plot, then samples by diagnosis are each displayed separately. Dysbiosis scores are color coded, and symbols reflect antibiotic use. (C) Association between dysbiosis and IBD clinical phenotypes. (D) Association between the percentage sequencing reads aligned to the human genome and the presence of dysbiosis. (E) The 26 metabolites increased significantly in dysbiotic samples as compared with nondysbiotic samples. The x-axis is the estimated log difference of metabolite levels between dysbiotic and nondysbiotic groups. Various structural categories of acylcarnitines have been color coded. False discovery rate: ∗P < .05 and ∗∗∗P < .001. Abx, antibiotics.
Figure 2
Figure 2
Acylcarnitine levels are correlated with fecal calprotectin and bacterial taxa. (A) Association between acylcarnitines and calprotectin in pediatric patients with IBD with acylcarnitines. Various structural categories of acylcarnitines have been color coded. False discovery rate: ∗P < .05, ∗∗P < .01, and ∗∗∗P < .001. (B) Spearman correlation between fecal acylcarnitines with bacterial taxa at individual time points among all pediatric subjects. The size of each circle indicates the strength of correlation and the correlations have been color coded as shown in the panel. Blue indicates a negative correlation and red indicates a positive correlation. (C) Reads per kilobase million (RPKM) of genes in the cai operon across samples labeled as nondysbiotic and dysbiotic.
Figure 3
Figure 3
Fecal acylcarnitines over the course of a human dietary intervention study and corresponding changes in E coli abundance. (A) Heatmap of log-transformed average acylcarnitine levels in the FARMM study. Values below the limit of detection were imputed as one half of the lowest detected level for each carnitine species. (B) Average relative abundance of E coli over the course of the FARMM study. Data are expressed as means ± SEM. (C) Reads per kilobase million (RPKM) of genes in the cai operon throughout the course of the FARMM study in which the 3 diets consumed have been color coded as indicated. AUC, area under the curve.
Figure 4
Figure 4
Quantification of acylcarnitine levels in conventional and germ-free mice. (A) Heatmap of carnitine and acylcarnitine concentrations in various biospecimens from conventionally raised and germ-free (GF) mice, n = 4–5 for conventional mice and n = 5 for germ-free mice. (B) Heatmap of carnitine and acylcarnitine concentrations in various biospecimens from GF mice with and without treatment with 2.5% DSS to induce colitis, n = 4–6 for GF mice and n = 5–6 for GF mice with 2.5% DSS. ∗Significant P value using unpaired t tests with false discovery rate corrections. (C) Colonic length of germ-free mice treated with 2.5% DSS in drinking water to induce colitis as well as germ-free controls. n = 6. ∗∗∗P < .001. (D) Time-dependent Disease Activity Index (DAI) in germ-free mice treated with 2.5% DSS in drinking water to induce colitis as well as germ-free controls. n = 6 in each group. DSS-treated mice met the threshold for euthanasia by day 4 of the study. Prox, proximal; SI, small intestine.
Figure 5
Figure 5
Consumption of carnitine and acylcarnitines by various bacterial species and the effect of the cai operon on anaerobic respiration. (A) Concentration of acylcarnitines naturally present in rich bacterial culture media, LB, BHI, and chopped meat carbohydrate (CMC) broth. (B) Growth curves for bacterial strains under anaerobic conditions at 37°C in BHI, n = 12. Concentrations of (C) carnitine, (D) acetylcarnitine, and (E) longer-chain acylcarnitines in BHI media after a 24-hour incubation with or without bacteria under anaerobic conditions at 37°C. n = 12. ∗P < .05, ∗∗P < .01, ∗∗∗P < .001, and ∗∗∗∗P < .0001 after unpaired t test with false discovery rate correction. (F) Anaerobic growth of wild-type (WT) E coli MP1 and a mutant of the cai operon (ΔcaiC) in M9 minimal medium with glycerol as the sole carbon source in the presence of either nitrate or carnitine. (G) Growth of the adherent invasive E coli strain NRG 857C in M9 minimal medium with glycerol as the sole carbon source in the presence of either nitrate or carnitine. OD600, optical density at 600 nm.
Figure 6
Figure 6
The effect of carnitine and acetylcarnitine metabolism on the growth of Enterobacteriaceae in vitro and in vivo. (A) Acetylcarnitine levels before and after overnight aerobic and anaerobic culture of C rodentium in LB broth. (B) Carnitine levels before and after overnight aerobic and anaerobic culture of C rodentium in LB broth. (C) Cecal acetylcarnitine levels in naïve and C rodentium–infected mice without and with acetylcarnitine dietary supplementation (P = .43, 1-way analysis of variance [ANOVA]). (D) Cecal carnitine levels in naïve and C rodentium–infected mice without and with acetylcarnitine dietary supplementation (P = .006, 1-way ANOVA; P = .02 and P = .009, ALCAR + C rodentium vs C rodentium alone and naïve, respectively; Tukey multiple comparisons tests). (E) C rodentium load on days 9 and 10 postinfection in mice with and without acetylcarnitine dietary supplementation, n = 10 per condition. ∗∗P < .01, ∗∗∗P < .001 by unpaired t test. (F) Effect of C rodentium infection and 15 mmol/L acetylcarnitine supplementation in drinking water on histologic disease activity, n = 5 for naïve and ALCAR, n = 10 for C rodentium and ALCAR + C rodentium. ∗∗∗∗P < .0001 by unpaired t test. ALCAR, acetylcarnitine; CFU, colony-forming unit.

References

    1. Winter S.E., Lopez C.A., Baumler A.J. The dynamics of gut-associated microbial communities during inflammation. EMBO Rep. 2013;14:319–327. - PMC - PubMed
    1. Bushman F.D., Conrad M., Ren Y., et al. Multi-omic analysis of the interaction between Clostridioides difficile infection and pediatric inflammatory bowel disease. Cell Host Microbe. 2020;28:422–433 e427. - PMC - PubMed
    1. Burrello C., Garavaglia F., Cribiu F.M., et al. Therapeutic faecal microbiota transplantation controls intestinal inflammation through IL10 secretion by immune cells. Nat Commun. 2018;9:5184. - PMC - PubMed
    1. Koves T.R., Ussher J.R., Noland R.C., et al. Mitochondrial overload and incomplete fatty acid oxidation contribute to skeletal muscle insulin resistance. Cell Metab. 2008;7:45–56. - PubMed
    1. Zhu W., Winter M.G., Byndloss M.X., et al. Precision editing of the gut microbiota ameliorates colitis. Nature. 2018;553:208–211. - PMC - PubMed

Publication types

LinkOut - more resources