. 2023 Nov 1:332:122113.
doi: 10.1016/j.lfs.2023.122113. Epub 2023 Sep 20.

The role of ferroptosis in cell-to-cell propagation of cell death initiated from focal injury in cardiomyocytes

Affiliations

The role of ferroptosis in cell-to-cell propagation of cell death initiated from focal injury in cardiomyocytes

Nicholas K Kawasaki et al. Life Sci. .

Abstract

Aims: Ferroptosis has grown in importance as a key factor in ischemia-reperfusion (I/R) injury. This study explores the mechanism underlying fibrotic scarring extending along myofibers in cardiac ischemic injury and demonstrates the integral role of ferroptosis in causing a unique cell death pattern linked to I/R injury.

Main methods: Cadaveric hearts from individuals who had ischemic injury were examined by histological assays. We created a novel model of inducing cell death in H9c2 cells, and used it to demonstrate ferroptotic cell death extending in a cell-to-cell manner. Ex vivo Langendorff-perfused hearts were used alongside the model to replicate cell death extension along myofibers while also demonstrating protective effects of a ferroptosis inhibitor, ferrostatin-1 (Fer-1).

Key findings: Human hearts from individuals who had I/R injury demonstrated scarring along myofibers that was consistent with mouse models, suggesting that cell death extended from cell-to-cell. Treatment with Ras-selective lethal 3 (RSL3), a ferroptosis inducer, and exposure to excess iron exacerbated cell death propagation in in vitro models, and inhibition of ferroptosis by Fer-1 blunted this effect in both settings. In ex vivo models, Fer-1 was sufficient to reduce cell death along the myofibers caused by external injury.

Significance: The unique I/R injury-induced pattern of cell death along myofibers requires novel injury models that mimic this phenomenon, thus we established new methods to replicate it. Ferroptosis is important in propagating injury between cells and better understanding this mechanism may lead to therapeutic responses that limit I/R injury.

Keywords: Cardiomyocytes; Cell death; Ferroptosis; Myocardial infarction; Reperfusion injury.


Conflict of interest statement

Declaration of competing interest We declare that we have no financial and personal relationships with other people or organizations that can inappropriately influence our work, there is no professional or other personal interest of any nature or kind in any product, service and/or company that could be construed as influencing the position presented in, or the review of, the manuscript entitled “The role of ferroptosis in cell-to-cell propagation of cell death initiated from focal injury in cardiomyocytes”.

Figures

Fig. 1.
Fig. 1.. Contrasting myocardial scarring patterning in human hearts.
(A) Gross view of a 72-year-old male heart displaying a large scar in the inferior wall near the septum (Left Panel). LV, left ventricle; RV, right ventricle. Masson’s trichrome staining (Right Panel). Cardiac tissue sample prepared from the area indicated by the white arrow in A. (B) Gross view of a 66-year-old female heart displaying a large scar in the inferior lateral wall. (C) Gross view of a 75-year-old male heart that suffered from an acute myocardial infarction with scarring in the lateral wall of the LV. (D) Gross view of a heart from a 67-year-old male that received a cardiac stent with scarring along the myofibers in the inferior wall (Left Panel). Masson’s trichrome staining (Right Panels). Cardiac tissue sample prepared from the area indicated by the yellow arrow in D. Scale bars are attached. (E) Gross view of a heart from an 83-year-old male that received a cardiac stent with scarring along the myofibers in the inferior wall. (F) Gross view of a heart from a 83-year-old male that received a cardiac stent with scarring along the myofibers in the anterior wall. (G) Representative graphic displaying the wavefront phenomenon with scarring originating from the endocardium (Endo.) and extending towards the epicardium (Epi.). The yellow arrow indicates the path of fibrotic scarring runs along the arterial distribution. (H) Quantitative analysis depicting the myocardial scarring of hearts (A through C) as a function of its placement along the axis from endocardium to epicardium. (I) Representative graphic displaying the concept of myocardial scarring running along the myofibers. The double-sided yellow arrow suggests scarring runs along the myofibers perpendicular to arterial distribution. (J) Quantitative analysis depicting the myocardial scarring of hearts (D through F) as a function of its placement along the axis from endocardium to epicardium.
Fig. 2.
Fig. 2.. Myocardial scarring runs along the myofibers in mice after I/R injury.
(A) Representative photos of Masson’s trichrome staining in cardiac sections from mouse hearts 3 days, 1 week, and 4 weeks after undergoing I/R injury due to LAD ligation. The X indicates the position of coronary ligation on the LAD artery. (B) Magnified images of the regions indicated by the white dotted lined squares in each heart section of the images in A.
Fig. 3.
Fig. 3.. Ferroptosis activation increases lipid peroxidation while maintaining cell viability.
(A) Representative western blot images (upper panels) and densitometric quantitation (lower panel) of GPX4 expression in H9c2 cells treated with 100 ng/mL RSL3 or vehicle control in the presence or absence of 1 μM Fer-1 for 5 hours. n=3 (B) Relative levels of Ptgs2 mRNA in H9c2 cells treated with 100 ng/mL RSL3 or vehicle control in the presence or absence of 1 μM Fer-1 for 5 hours. n=4 # P<0.05, ** P<0.0005 (C) Representative images (left panels) and quantitative analysis (right panel) of H9c2 cells stained with LiperFluo (1 μM) after exposure to 100 ng/mL RSL3 or control vehicle in the presence or absence of 1 μM Fer-1 for 5 hours. n=3. The graph is created using data from 3 independent experiments. *** P<0.0001 (D) Level of lipid peroxides assessed by C11-BODIPY staining. H9c2 cells was stained with C11-BODIPY for 30 minutes after exposure to 100 ng/mL RSL3 or control vehicle in the presence or absence of 1 μM Fer-1 for 4 hours and analyzed using Flow Cytometry. Upper panels, representative images displaying cell viability. Scale bars, 200 μm. Lower left panel, representative data of oxidized C11-BODIPY fluorescence. Each plot is from 20,000 nucleated cells. Lower right panel, quantifying the oxidized C11-BODIPY fluorescence from flow cytometry analysis. n=3 Representative data from one of four independent experiments are shown. * P<0.005, *** P<0.0001
Fig. 4.
Fig. 4.. Cell-to-cell death patterning in ferroptosis activated cells after application of a localized injury.
(A) Representative image displaying the acid gel induced injury apparatus with the acid gel lodged in the center of a 30 mm tissue culture dish. (B) Representative image of H9c2 cells stained with Evans Blue after application of the acid gel. Cells situated directly under the acid gel undergo cell death for 1 hour and then were stained with 0.1% Evans Blue. The dotted red line demarcates the borderline of the acid gel (Gel) placement. Scale bars, 200 μm (C) The effects of RSL3 in acid gel induced injury models. H9c2 cells stained with 0.1% Evans blue after treatment with 100 ng/mL RSL3 for 3 hours and application of the acid gel during the final 1 hour of RSL3 treatment. The red dotted line denotes the borderline of the acid gel (Gel) application. The set of images are representative of results from 4 independent experiments. Scale bars, 200 μm (D) Visual diagram of the scratch induced cell-to-cell death model with the yellow dotted line representing the physical injury caused by an 18-gauge needle. (E) The effects of RSL3 in the scratch induced cell-to-cell death model. Left panels, representative images. H9c2 cells were treated with 100 ng/mL RSL3 in the presence or absence of 1 μM Fer-1 for 5 hours and then application of a localized injury using an 18-gauge needle down the midline. To assess cell-to-cell propagation of cell death, cells were stained with Calcein-AM (4 μM) and Ethidium Homodimer-1 (2 μM) for 30 minutes. Right panel, quantitative analysis of cell death. Scale bars, 200 μm; n=5. The graph was created from 5 independent experiments. *** P<0.0001
Fig 5.
Fig 5.. Ferroptosis is the dominant cell death form for cell-to-cell death propagation of cell death.
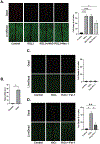
(A) The effect of apoptotic and necroptotic inhibitors on ferroptosis-mediated cell-to-cell death propagation. Left panels, representative images. H9c2 cells were treated with 100 ng/mL RSL3 in the presence or absence of 20 μM zVAD or 20 μM Nec-1 for 5 hours, and subsequent induction of a localized injury using an 18-gauge needle down the midline. To assess cell-to-cell propagation of cell death, cells were stained with Calcein-AM (4 μM) and Ethidium Homodimer-1 (2 μM) for 30 minutes. Right panel, quantitative analysis of cell death. Scale bars, 200 μm; n=7. The graph was made using 7 independent experiments. * P<0.005 *** P<0.0001 (B) Relative levels of Ptgs2 mRNA in H9c2 cells treated with 25 μM H2O2 or vehicle control for 3 hours. n=3 * P<0.005. (C-D) Left panels, representative images. H9c2 cells were treated with 50 μM of H2O2 in the presence or absence of 1 μM Fer-1 for 5 hours and then either given an application of a localized injury (D) using an 18-gauge needle down the midline or a lack of said injury (C). To assess cell-to-cell propagation of cell death, cells were stained with Calcein-AM (4 μM) and Ethidium Homodimer-1 (2 μM) for 30 minutes. Scale bars, 200 μm. Right panels, quantitative analysis of cell death. n=3. Both graphs were formed from the results of 3 independent experiments * P<0.005
Fig. 6.
Fig. 6.. Excess iron exacerbates cell-to-cell death propagation of cell death.
Left panels, representative images. H9c2 cells were treated with 1mM ferric iron in the presence or absence of 1 μM Fer-1 for 5 hours and then application of a localized injury using an 18-gauge needle down the midline. To assess cell-to-cell propagation of cell death, then the cells were stained with Calcein-AM (4 μM) and Ethidium Homodimer-1 (2 μM) for 30 minutes. Scale bars, 200 μm. Right panel, quantitative analysis of cell death. n=5. The graph was created from the results of 5 independent experiments. *** P<0.0001.
Fig. 7.
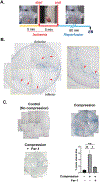
Fig. 7.. Cell-to-cell death patterning is displayed in an ex vivo model of I/R injury alongside intramyocardial compression.
(A) Representative image along with timeline showing a murine heart undergoing I/R injury using the Langendorff apparatus. The timeline displays 10 minutes of ischemia alongside 5 minutes of intramyocardial compression induced by a 6–0 suture followed by 60 minutes of reperfusion and lastly stained with 0.1% Evans blue. (B) Representative images of a cross section of a murine heart after 60 minutes of I/R injury and 5 minutes of compression stained with Evans blue. The area within the yellow box is displayed in the right panel. (C) Representative images and quantitative analysis (lower right panel) of cross sections of murine hearts in control (upper left panel), compression (upper right panel), or compression alongside perfusion with 10 μM Fer-1 (lower left panel). Scale bars, 0.5 mm; n=4 mice per group. The graphs were created from 4 sets of independent experiments. # P<0.05, ## P<0.01

Similar articles

Cited by

References

    1. Bhatt AS, Ambrosy AP, Velazquez EJ, Adverse Remodeling and Reverse Remodeling After Myocardial Infarction, Curr Cardiol Rep 19(8) (2017) 71. 10.1007/s11886-017-0876-4 - DOI - PubMed
    1. Shirani J, Lee J, Quigg R, Pick R, Bacharach SL, Dilsizian V, Relation of thallium uptake to morphologic features of chronic ischemic heart disease: evidence for myocardial remodeling in noninfarcted myocardium, J Am Coll Cardiol 38(1) (2001) 84–90. 10.1016/s0735-1097(01)01320-1 - DOI - PubMed
    1. Mitchell GF, Lamas GA, Vaughan DE, Pfeffer MA, Left ventricular remodeling in the year after first anterior myocardial infarction: a quantitative analysis of contractile segment lengths and ventricular shape, J Am Coll Cardiol 19(6) (1992) 1136–44. 10.1016/0735-1097(92)90314-d - DOI - PubMed
    1. Kusakari Y, Xiao CY, Himes N, Kinsella SD, Takahashi M, Rosenzweig A, Matsui T, Myocyte injury along myofibers in left ventricular remodeling after myocardial infarction, Interactive cardiovascular and thoracic surgery 9(6) (2009) 951–955. 10.1510/icvts.2009.206524 - DOI - PMC - PubMed
    1. Katz MY, Kusakari Y, Aoyagi H, Higa JK, Xiao CY, Abdelkarim AZ, Marh K, Aoyagi T, Rosenzweig A, Lozanoff S, Matsui T, Three-dimensional myocardial scarring along myofibers after coronary ischemia-reperfusion revealed by computerized images of histological assays, Physiol Rep 2(7) (2014). 10.14814/phy2.12072 - DOI - PMC - PubMed

LinkOut - more resources