. 2023 Oct 27;51(19):e99.
doi: 10.1093/nar/gkad761.

High-throughput, fluorescent-aptamer-based measurements of steady-state transcription rates for the Mycobacterium tuberculosis RNA polymerase

Affiliations

High-throughput, fluorescent-aptamer-based measurements of steady-state transcription rates for the Mycobacterium tuberculosis RNA polymerase

Drake Jensen et al. Nucleic Acids Res. .

Abstract

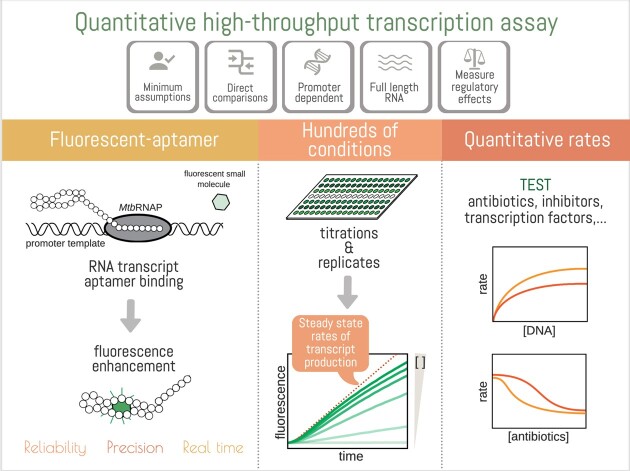
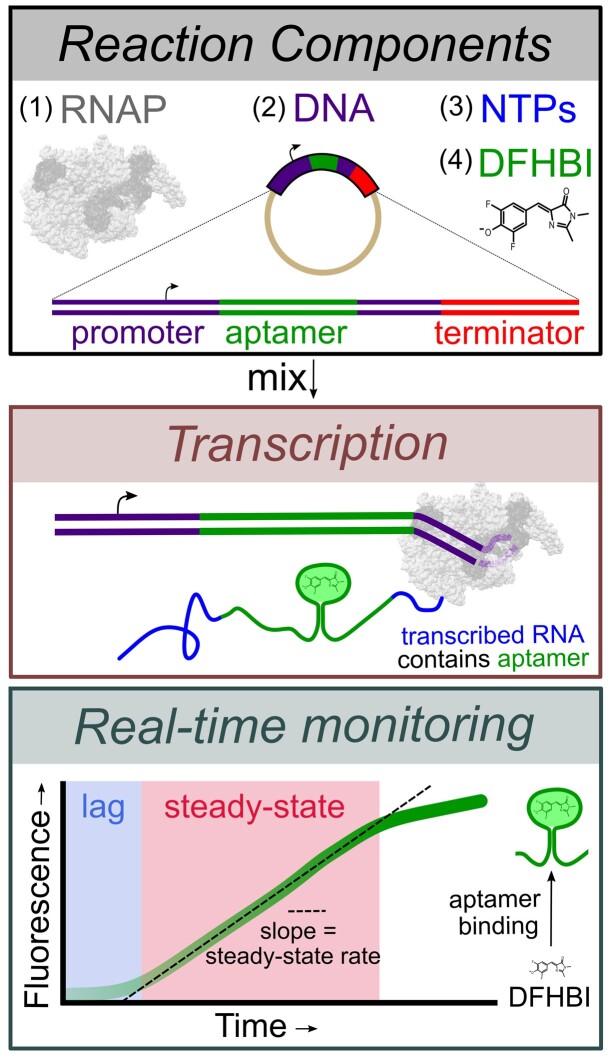
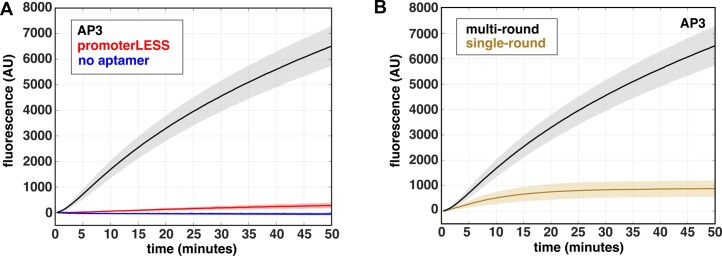
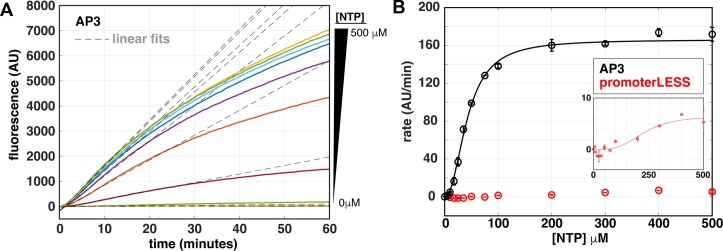
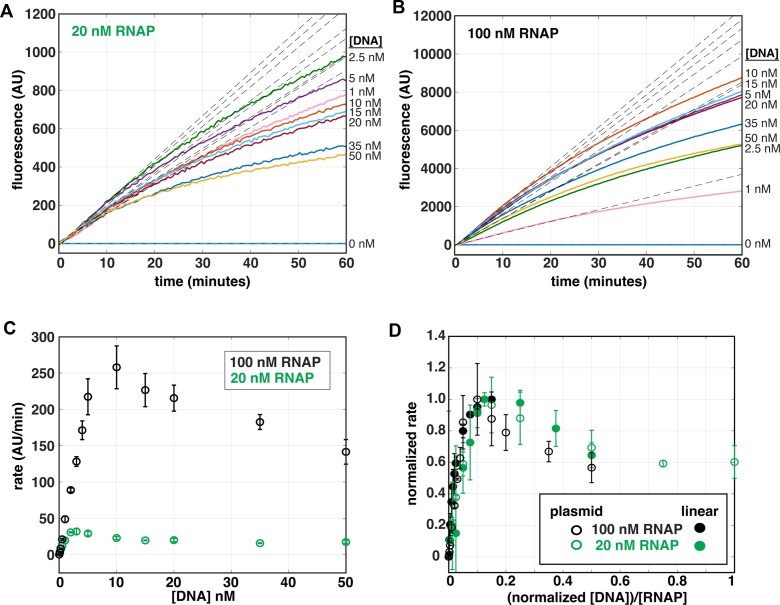
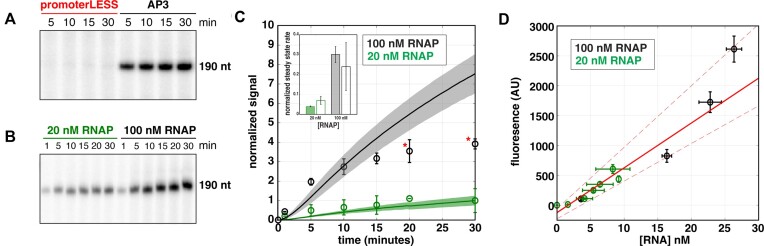
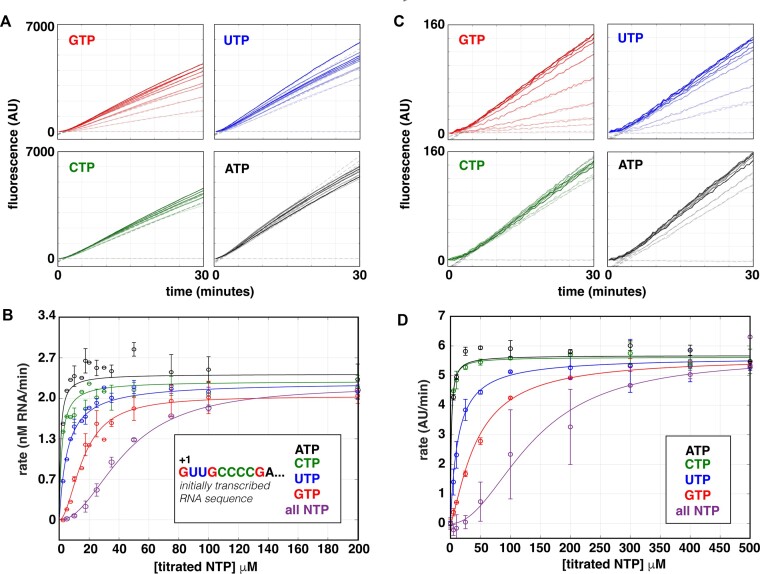
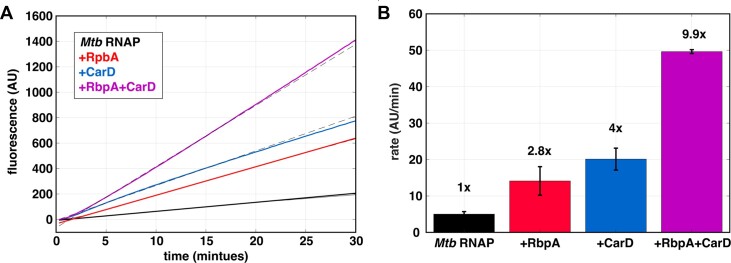
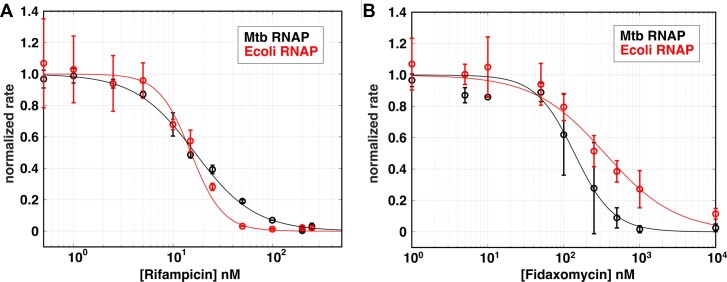
The first step in gene expression is the transcription of DNA sequences into RNA. Regulation at the level of transcription leads to changes in steady-state concentrations of RNA transcripts, affecting the flux of downstream functions and ultimately cellular phenotypes. Changes in transcript levels are routinely followed in cellular contexts via genome-wide sequencing techniques. However, in vitro mechanistic studies of transcription have lagged with respect to throughput. Here, we describe the use of a real-time, fluorescent-aptamer-based method to quantitate steady-state transcription rates of the Mycobacterium tuberculosis RNA polymerase. We present clear controls to show that the assay specifically reports on promoter-dependent, full-length RNA transcription rates that are in good agreement with the kinetics determined by gel-resolved, α-32P NTP incorporation experiments. We illustrate how the time-dependent changes in fluorescence can be used to measure regulatory effects of nucleotide concentrations and identity, RNAP and DNA concentrations, transcription factors, and antibiotics. Our data showcase the ability to easily perform hundreds of parallel steady-state measurements across varying conditions with high precision and reproducibility to facilitate the study of the molecular mechanisms of bacterial transcription.


Figures

Graphical Abstract
Graphical Abstract
Figure 1.
Figure 1.
Overview of the fluorescent-aptamer-based assay. This assay requires RNAP, a DNA template containing the sequence for the Spinach-mini RNA aptamer (33), NTPs and the fluorescent dye DFHBI. Upon initiating the reaction, full-length RNAs containing the Spinach-mini aptamer capable of binding DFHBI are synthesized. The fluorescent signal change, monitored in real-time, results from the unbound to aptamer-bound dye transition and is used as a reporter of full-length transcription rates. An initial lag time is observed, followed by a steady-state regime where the slope of the linear phase represents the steady-state rate of full-length RNA synthesis.
Figure 2.
Figure 2.
Real-time fluorescent signal is promoter dependent and due to multiple rounds of initiation. All experiments were performed using 100 nM Mtb RNAP, 5 nM DNA circular plasmid templates, and 500 μM NTPs. (A) Comparison of time courses of RNA synthesis from an Mtb plasmid template containing either both the rrnAP3 and aptamer sequences (black), the rrnAP3 sequence with no aptamer sequence (blue), or the ‘promoterLESS’ template, containing the aptamer, but lacking the rrnAP3 sequence (red). (B) Real-time traces comparing multi-round (black) and single-round conditions (gold) on the rrnAP3 circular plasmid template. Error shading indicates the standard deviation of 3 independent experiments.
Figure 3.
Figure 3.
Quantification of the NTP-dependence of steady-state rates for full-length multi-round transcription. (A) Titration of the concentration of all NTPs with 100 nM Mtb RNAP and 5 nM rrnAP3 circular plasmid DNA results in an increase in the rate and amplitude of the fluorescent traces (solid, coloured lines). The unbiased linear fits of the early times are shown in grey dotted lines for each trace. (B) Quantification of steady-state rates on rrnAP3 (black) and promoterLESS (red) circular plasmid DNA templates plotted as a function of NTP concentration and fit to a modified Michaelis-Menten model (Equation 2) to account for the apparent sigmoidal behaviour.
Figure 4.
Figure 4.
Steady-state rates exhibit a biphasic DNA-concentration-dependence at multiple RNAP concentrations. Real-time data obtained at 500 μM all NTPs, titrating Mtb rrnAP3 circular plasmid DNA template (0.1–50 nM) at either (A) 20 nM or (B) 100 nM Mtb RNAP concentrations. The unbiased linear fits of the early times are shown in grey dotted lines for each trace. (C) Steady-state rates obtained from the linear fits in (A) and (B) for 20 nM (green) and 100 nM (black) RNAP, plotted as a function of rrnAP3 circular plasmid DNA concentration. (D) Steady-state rates, normalized from zero to one based on the lowest and highest rate obtained at each RNAP concentration, plotted as a function of the normalized [DNA]:[RNAP] concentration ratios. Included titrations of steady-state rate data are those obtained from the circular plasmids templates (open circles) and from linear PCR templates (Supplementary Figure S7, closed circles). Linear PCR DNA template concentration was normalized to that of the plasmid by dividing by a factor of ten to account for the template length (linear PCR template = 250 bp; circular plasmid template = 2557 bp).
Figure 5.
Figure 5.
Comparison and calibration of gel- and fluorescence-based kinetics. Transcription gels showing the increase in amount of the specific, full-length 32P-labeled transcript with time (see Supplementary Figure S8 for full gel images) obtained with (A) 100 nM Mtb RNAP and 5 nM of the promoterLESS or rrnAP3 circular plasmid templates and (B) 20 nM and 100 nM Mtb RNAP with 5 nM rrnAP3 circular plasmid template. (C) Comparison of time-dependent signals from the fluorescent-aptamer-based assay (lines) and the gel assay (open circles) as a function of time for 20 nM and 100 nM RNAP. Both gel data sets were divided by the signal at 30 min obtained with the 20 nM RNAP concentration, thus normalizing that signal to a value of 1. The fluorescent data sets were then normalized using a factor determined by the ratio of the fluorescent and gel data at the same timepoint. The two gel data points that deviate from the fluorescent time course are indicated with red asterisks. The inset shows a comparison of normalized steady state rates from the gel (open bars) and fluorescence (filled bars) data with 20 nM (green) and 100 nM (black) RNAP concentrations. (D) Fluorescent signal plotted against RNA concentration from the data shown in (B) excluding the 20 and 30 minute time points obtained with 100 nM RNAP. A linear fit (solid red line) along with 95% confidence regions (dashed red lines) are indicated. The best fit line has a slope of 75 ± 17 AU/nM RNA and an y-intercept of –125 ± 70 AU. Error bars indicate the standard deviations from 3 to 4 independent experiments for fluorescence data and 2–3 independent experiments for gel-based data in all sub-plots.
Figure 6.
Figure 6.
Titrations of individual NTPs reveal incorporation of the initiating nucleotide is rate limiting. (A) Real-time fluorescent traces and linear fits obtained using 100 nM Mtb RNAP, 5 nM rrnAP3 circular plasmid DNA, and individually titrating GTP, UTP, CTP, or ATP in the presence of 500 μM of the other three, non-titrated NTPs. (B) Rate dependence on the concentration of individual NTPs from the data in (A) as well as the titration of all NTPs equally. Note that for clarity, only the titration data out to 200 μM NTPs is shown. The y-axis was converted to RNA concentrations using the calibration presented in Figure 5D. (C) Real-time fluorescent traces and fits as in (A), except using 25 nM of the rrnAP3 linear PCR DNA template. (D) Rate dependence on the concentration of individual NTPs from the data in (C) as well as the titration of all NTPs equally. Error bars in (C) and (D) represent standard deviations of 2–4 independent experiments each with 2–3 technical replicates. Rate dependencies in (C) and (D) were fit to Equation 1 or 2 depending on the identity of the titrated NTP, and fitted parameters are summarized in Supplementary Table S3.
Figure 7.
Figure 7.
Factor-dependent effects on steady-state transcription rates. (A) Real-time fluorescent traces collected by pre-incubating 100 nM Mtb RNAP and 500 μM NTPs in the presence of saturating Mtb CarD (1 μM) and RbpA (2 μM) (solid curves) prior to addition of 25 nM rrnAP3 linear PCR template. Raw traces are shown with associated linear fits (dotted lines). (B) Comparison of steady-state rates (average of 2–5 independent experiments) reveals the extent of transcriptional activation by RbpA (red), CarD (blue), and the combination of RbpA and CarD (purple). Fold changes in the steady-state rate relative to Mtb RNAP alone are indicated above each condition.
Figure 8.
Figure 8.
Quantification of antibiotic IC50 values based on changes in observed steady-state rates. Normalized steady-state rates plotted as a function of (A) Rifampicin and (B) Fidaxomicin concentrations for Mtb (black) and E. coli (red) RNAP. All experiments were performed using 1 mM of each NTP and 5 nM rrnAP3 plasmid DNA. See Supplementary Figure S11 for the corresponding real-time data, linear fits, and un-normalized rates. The normalized steady-state rates are based on the associated fits using Equation 3 (Supplementary Figure S11E, F).

Update of

Similar articles

Cited by

References

    1. Balakrishnan R., Mori M., Segota I., Zhang Z., Aebersold R., Ludwig C., Hwa T.. Principles of gene regulation quantitatively connect DNA to RNA and proteins in bacteria. Science. 2022; 378:eabk2066. - PMC - PubMed
    1. Ruff E.F., Record M.T., Artsimovitch I.. Initial events in bacterial transcription initiation. Biomol. 2015; 5:1035–1062. - PMC - PubMed
    1. Jensen D., Galburt E.A.. The context-dependent influence of promoter sequence motifs on transcription initiation kinetics and regulation. J. Bacteriol. 2021; 203:e00512-20. - PMC - PubMed
    1. McClure W.R. Mechanism and control of transcription initiation in prokaryotes. Annu. Rev. Biochem. 1985; 54:171–204. - PubMed
    1. Henderson K.L., Felth L.C., Molzahn C.M., Shkel I., Wang S., Chhabra M., Ruff E.F., Bieter L., Kraft J.E., Record M.T.. Mechanism of transcription initiation and promoter escape by E. coli RNA polymerase. Proc Natl. Acad. Sci. U.S.A. 2017; 114:E3032–E3040. - PMC - PubMed

Publication types

MeSH terms