. 2023 Sep 22;6(12):e202302156.
doi: 10.26508/lsa.202302156. Print 2023 Dec.

Themis controls T cell activation, effector functions, and metabolism of peripheral CD8+ T cells

Affiliations

Themis controls T cell activation, effector functions, and metabolism of peripheral CD8+ T cells

Namrata Gautam et al. Life Sci Alliance. .

Abstract

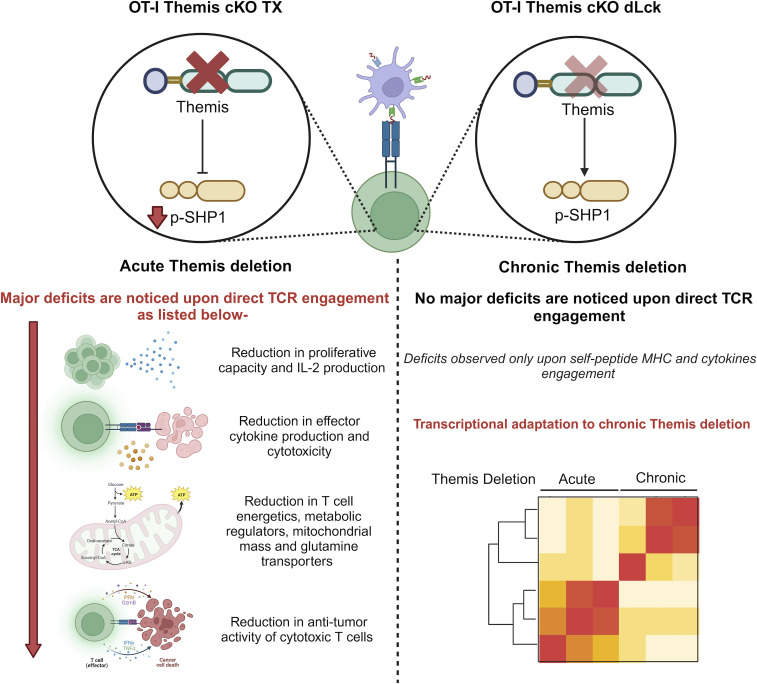
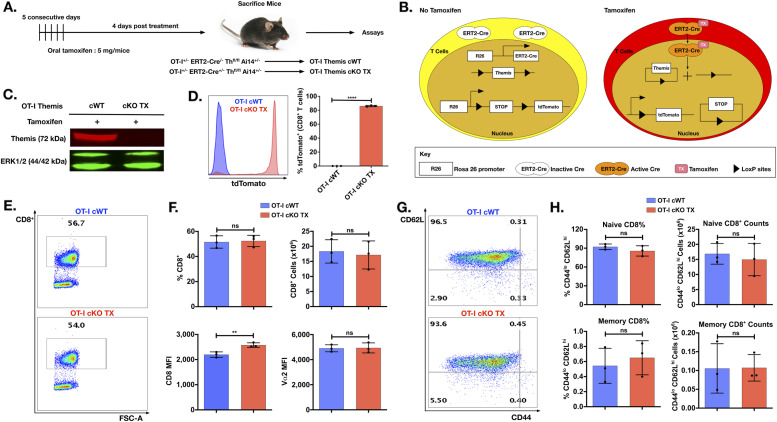
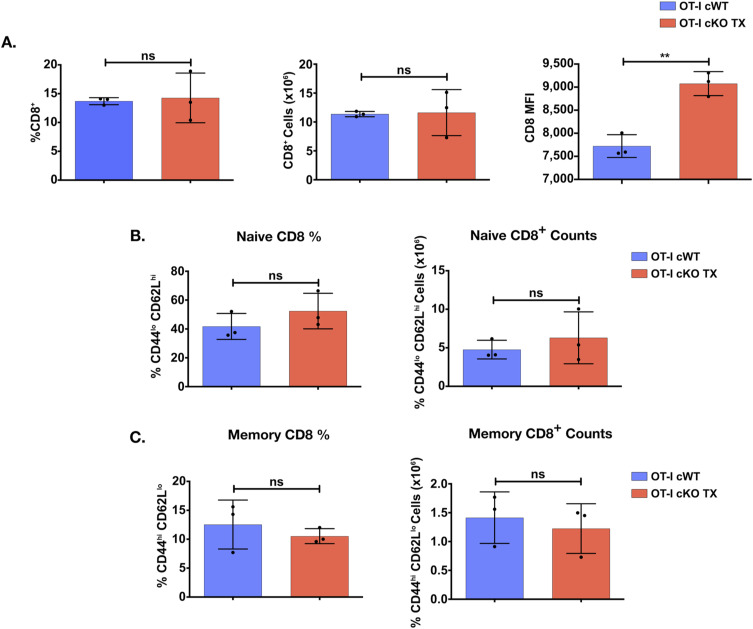
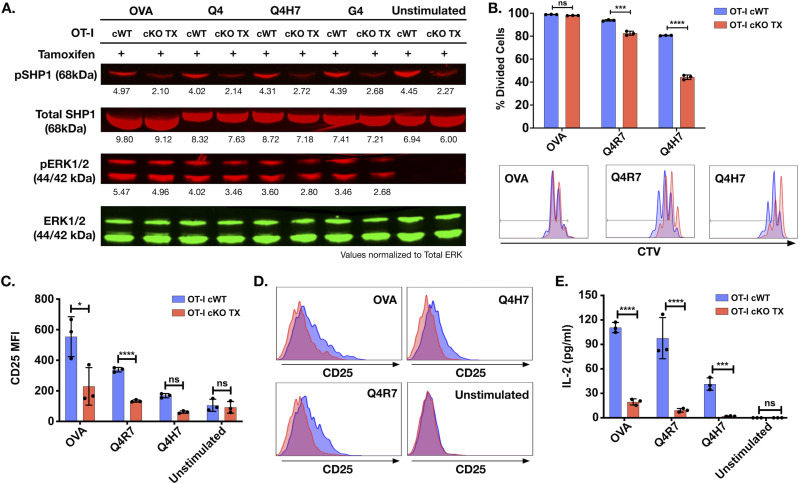
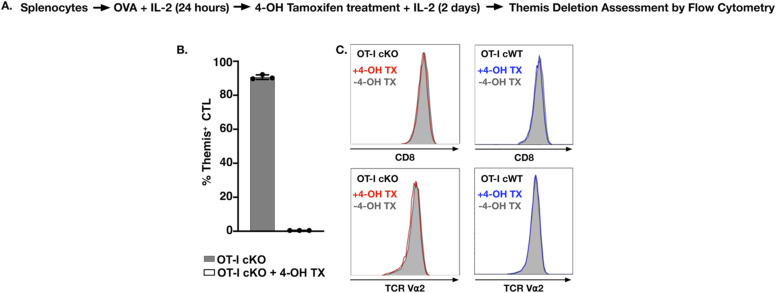
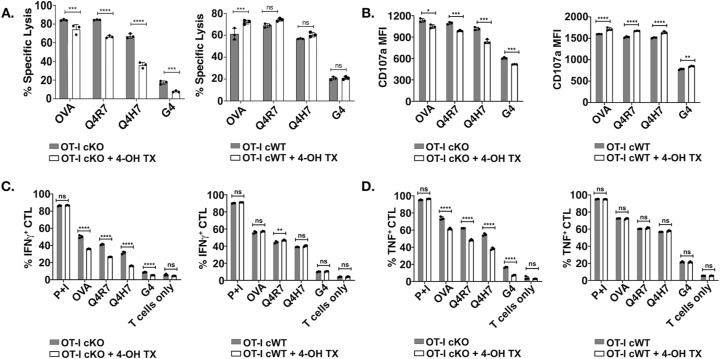
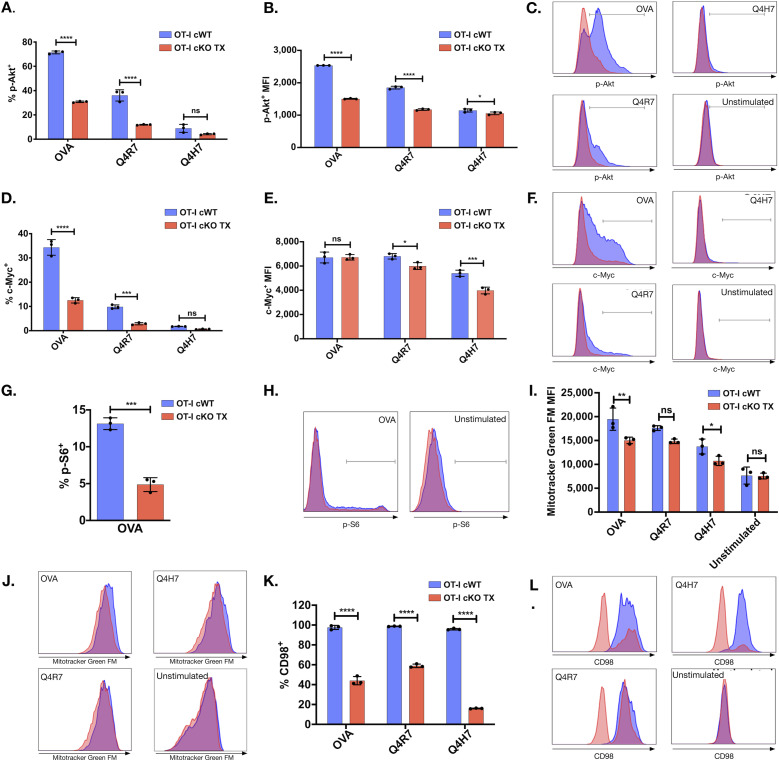
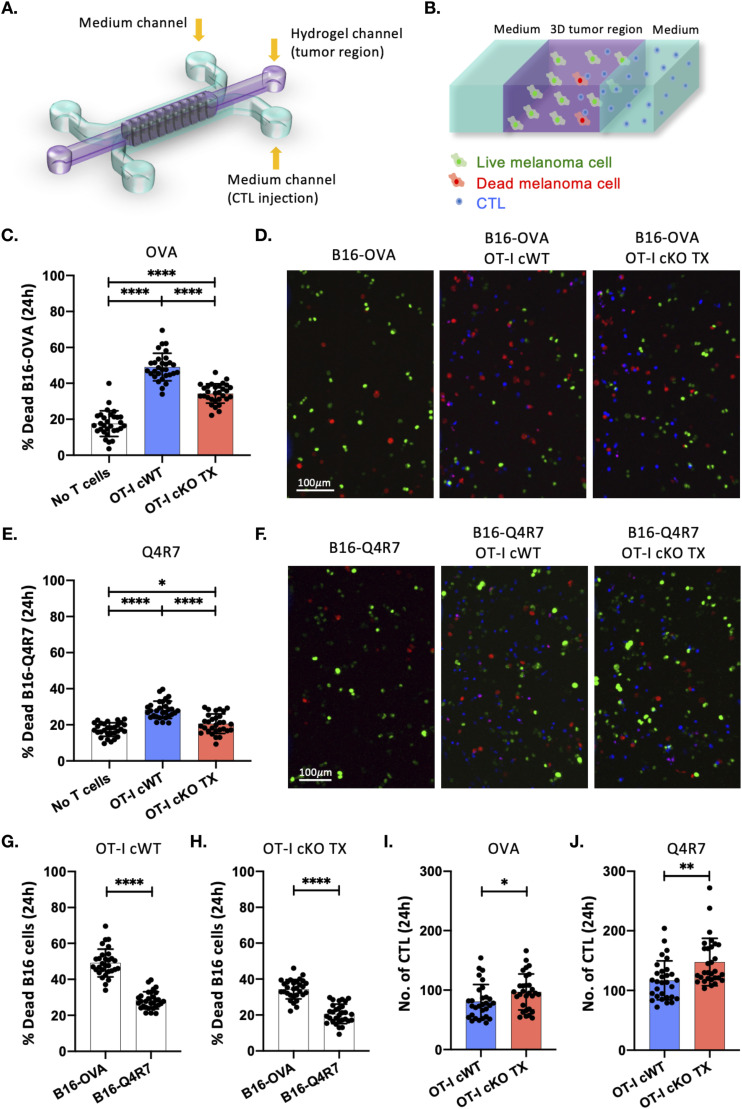
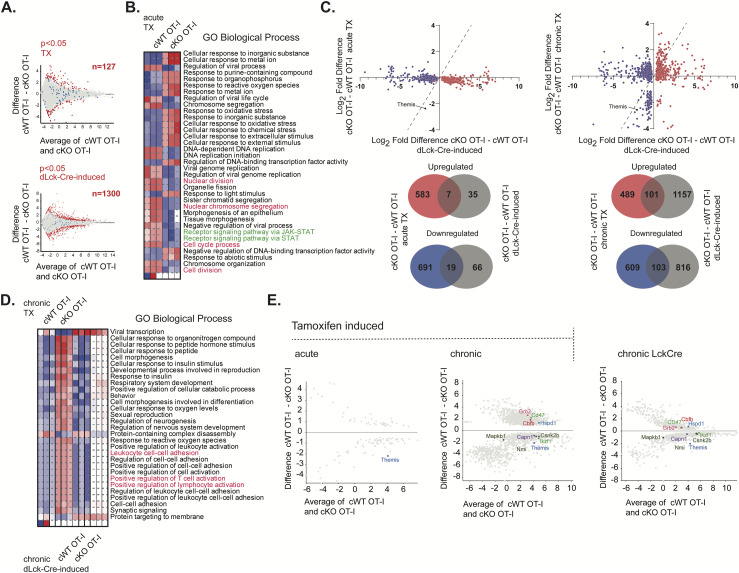
Themis is important in regulating positive selection of thymocytes during T cell development, but its role in peripheral T cells is less understood. Here, we investigated T cell activation and its sequelae using a tamoxifen-mediated, acute Themis deletion mouse model. We find that proliferation, effector functions including anti-tumor killing, and up-regulation of energy metabolism are severely compromised. This study reveals the phenomenon of peripheral adaptation to loss of Themis, by demonstrating direct TCR-induced defects after acute deletion of Themis that were not evident in peripheral T cells chronically deprived of Themis in dLck-Cre deletion model. Peripheral adaptation to long-term loss was compared using chronic versus acute tamoxifen-mediated deletion and with the (chronic) dLck-Cre deletion model. We found that upon chronic tamoxifen-mediated Themis deletion, there was modulation in the gene expression profile for both TCR and cytokine signaling pathways. This profile overlapped with (chronic) dLck-Cre deletion model. Hence, we found that peripheral adaptation induced changes to both TCR and cytokine signaling modules. Our data highlight the importance of Themis in the activation of CD8+ T cells.


Conflict of interest statement

The authors declare that they have no conflict of interest.

Figures

None
Graphical abstract
Figure 1.
Figure 1.. In vivo Themis deletion using tamoxifen-induced Cre recombinase and phenotype of Themis-deficient CD8+ cells.
(A) Schematic representation of tamoxifen dose regimen followed to induce Themis deletion in peripheral T cells. (B) Schematic representation of mechanism of action of Cre ER–tamoxifen to induce simultaneous deletion of Themis and expression of tdTomato in OT-I CD8+ T cells. (C, D) Expression of Themis and tdTomato, ERT2 activity reporter, in tamoxifen-treated OT-I Themis cWT and cKO TX. (E, F, G, H) Quantification by flow cytometry of CD8+ T cells in the lymph nodes of B6 OT-I Themis cWT and cKO TX mice aged 7–12 wk upon tamoxifen treatment. (E) Dot plot showing the CD8+ population in OT-I Themis cWT and cKO TX. (F) Average frequency, numbers, and CD8 expression and average surface expression of Vα2 of the CD8+ population from the two groups. (G) Dot plot showing the naïve and memory of CD8+ population in OT-I Themis cWT and cKO TX. (H) Average frequencies and numbers of naïve and memory subsets of CD8+ T cells from two groups. Data from three mice per genotype. Data are representative of five experiments. OT-I Themis cWT and cKO TX samples were compared using t test, with **** indicating P-value < 0.0001 and ** indicating P-values from 0.001 to 0.01. Values shown here are mean ± SD. Source data are available for this figure.
Figure S1.
Figure S1.. Phenotype of Themis-deficient OT-I CD8+ cells in the spleen.
(A, B, C) Quantification of CD8+ T cells in the spleen of B6 OT-I Themis cWT and cKO TX mice aged between 7–12 wk upon tamoxifen treatment. (A) Average frequency, numbers, and CD8 expression of CD8+ population. (B) Average surface expression of Vα2 on CD8+ T cells from the two groups. (C) Average frequencies and numbers of naïve and memory subsets of CD8+ T cells. Data from three mice per genotype. Data are representative of five experiments. Themis cWT and cKO TX samples were compared using t test, with ** indicating P-values from 0.001 to 0.01. Values shown here are mean ± SD.
Figure 2.
Figure 2.. Impaired activation, proliferative responses, and IL-2 production in OT-I CD8+ Themis-deficient T cells upon TCR engagement.
(A) Western blot analysis of Shp1 and ERK1/2 phosphorylation in tamoxifen treated OT-I Themis cWT and cKO TX CTL upon OVA APL tetramer stimulation for 2 min. Total ERK was used as loading control. Cells were pooled from three mice per genotype. Data are representative of three experiments. (B) Themis cWT and cKO TX OT-I CD8+ T cells were CTV labeled and stimulated with OVA APLs for 3 d. After 3 d, proliferation was measured by analyzing CTV dilution. Percentage-divided cells and histograms showing CTV dilution of Themis cWT (blue) and cKO TX (red) OT-I CD8+ T cells are shown. (C) Quantification of CD25 expression after 3 d of stimulation. (D) Overlaid histograms of Themis cWT (blue) and cKO TX (red) CD8+ T cells showing CD25 expression. (E) IL-2 secretion by Themis cWT and cKO TX CD8+ T cells after 3 d of stimulation. Cells were pooled from three mice per genotype. Data are representative of three experiments. Themis cWT and cKO TX samples were compared using two-way ANOVA with multiple comparison test, with **** indicating P-value < 0.0001, *** P-values from 0.0001 to 0.001, ** P-values from 0.001 to 0.01, and * P-values from 0.01 to 0.05. Values shown here are mean ± SD. Source data are available for this figure.
Figure S2.
Figure S2.. Western blot analysis of Shp1 and ERK1/2 phosphorylation in tamoxifen treated OT-I Themis cWT and cKO TX CTL upon OVA APL tetramer stimulation for 2 min.
The bar graphs represent the values from LI-COR Odyssey infrared imaging system used for detection. The values were normalised to total ERK1/2 for phosphorylated (A) Shp1 and (B) ERK1/2 in cKO TX CTL as compared with the OT-I Themis cWT CTL.
Figure S3.
Figure S3.. Up-regulation of CD8 expression in Themis-deficient OT-I T cells.
CD8+ T cells from OT-I Themis cWT and Themis cKO TX were stimulated with OVA APLs. (A, B, C) Quantification of (A) CD69 up-regulation, (B) Vα2 down-regulation, and (C) surface expression of CD8+ after 3 h of stimulation. Cells were pooled from three mice per genotype. Data are representative of two experiments. Samples were compared using two-way ANOVA with multiple comparison test, with *** indicating P-values from 0.0001 to 0.001, ** values from 0.001 to 0.01, and * values from 0.01 to 0.05. Values shown here are mean ± SD.
Figure 3.
Figure 3.. Themis-deficient CTL have reduced cytolytic activity and cytokine production.
In vitro cytotoxicity was assessed by co-culturing the OT-I CTL (effector) and OVA APL-pulsed EL4 (target) at a ratio of 10:1 (effector: target) for 4 h followed by live/dead staining and flow cytometry analysis. Cytokine production was induced by stimulating OT-I CTL (effector) with EL4 APCs (target) pulsed with OVA APLs at a ratio of 3:1 (effector:target) for 6 h. IFNγ and TNF expression was assessed via intracellular staining and analyzed by flow cytometry. Cells were also stained for degranulation marker, CD107a (after 6 h). (A, B) Specific lysis of antigen-pulsed EL4 by OT-I Themis cWT (blue) and Themis cKO TX (red) CTL represented using bar graph and histogram overlays. (C, D) CD107a expression on OT-I CTL from the same samples displayed using bar graphs and histograms. (E, F, G) Quantification of IFNγ, (F) TNF, and (G) double-positive OT-I CTL from Themis cWT and Themis cKO TX mice. CTL were pooled from three mice per genotype. Data are representative of three experiments. OT-I Themis cWT and cKO TX samples were compared using two-way ANOVA with multiple comparison test, with **** indicating P-value < 0.0001, *** P-values from 0.0001 to 0.001, ** P-values from 0.001 to 0.01, and * P-values from 0.01 to 0.05. Values shown here are mean ± SD.
Figure S4.
Figure S4.. Gating strategy of flow cytometry samples for analysing cytotoxicity, cytokine production and CD107a expression.
(A, B) Gating strategy for analyzing in vitro cytotoxicity. Cytotoxicity was assessed by co-culturing the OT-I CTL (effector) and OVA APL-pulsed EL4 (target) + EL4 (VSV). VSV is one of the least responsive OVA APLs and was used as an internal control. Effector: target were cultured at a ratio of 10:1 (effector: target) for 4 h followed by live/dead staining and flow cytometry analysis. A big gate was created including the entire population which was further gated using cell trace violet (CTV). EL4 (VSV) cells were stained with 1/10th of the CTV concentration as compared with the target APL, here Q4R7. Hence, CTV high is the EL4 (Q4R7) gate, CTV low is the EL4 (VSV) gate and CTV negative is the T cell gate. The respective populations were stained for live/dead to calculate the cytotoxicity. (B) Another control i.e., target EL4 APL alone, here EL4 (Q4R7), was also included to show no killing of the target cells in the absence of T cells. Hence, all the EL4 APLs were run individually. (C) Gating strategy for analyzing cytokine production. Cytokine production and CD107a expression were induced by stimulating OT-I CTL (effector) with EL4 APCs (target) pulsed with OVA APLs at a ratio of 3:1 (effector: target) for 6 h.
Figure S5.
Figure S5.. Themis deletion mediated using in vitro 4-OH tamoxifen in CTL.
Cells were obtained from Themis cKO mice on the OT-I background. The corresponding OT-I Themis cWT mice were also treated with tamoxifen and used as controls. (A) Schematic representation of treatment of CTL with 4-OH tamoxifen. (B) Percentage of Themis+ cells in tamoxifen-treated and untreated CTL and naïve cells from OT-I Themis cKO mice. Percentage of Themis+ cells are shown in the bar graphs. (C) CD8 and Vα2 expression in tamoxifen-treated (red/blue) and untreated (grey) OT-I Themis cWT and Themis cKO CTL. CTL were pooled from three mice per genotype. Data are representative of three experiments. Values shown are mean ± SD.
Figure S6.
Figure S6.. In vitro 4-OH tamoxifen-generated Themis-deficient CTL exhibit reduced cytolytic activity and cytokine production.
The cytotoxic activity of Themis-deficient CTL generated using tamoxifen was assessed using a cell-based cytotoxicity assay. Antibody to CD107a was also added before stimulation to measure degranulation. (A) Specific lysis of peptide-loaded EL4 cells by tamoxifen-treated and untreated OT-I Themis cWT (right panel) and Themis cKO (left panel). (B) Surface expression of CD107a from the same samples in (A). Cytokine production was induced by stimulating CTL with EL4 cells loaded with different OVA APLs for 6 h before intracellular cytokine staining. (C) Intracellular IFNγ levels in tamoxifen-treated and untreated OT-I Themis cWT and cKO CTL. Percentage of IFNγ-positive cells. (D) Intracellular TNF expression of the same samples in (C). Percentage of TNF-positive cells. CTL were pooled from three mice per genotype. Data are representative of three experiments. Samples were compared using two-way ANOVA with multiple comparison test, with **** indicating P-value < 0.0001, *** P-values from 0.0001 to 0.001, ** values from 0.001 to 0.01, and * values from 0.01 to 0.05. Values shown here are mean ± SD.
Figure 4.
Figure 4.. Decreased energetics post activation in Themis-deficient CD8+ T cells.
CD8+ T cells from OT-I Themis cWT and OT-I Themis cKO TX were stimulated with OVA for 24 h and mitochondrial and glycolytic parameters were quantified. (A) OCR of indicated cells at baseline and in response to oligomycin (Oligo), FCCP, and rotenone plus antimycin A (Rot/AA). (B, C, D, E, F) Quantification of basal respiration, ATP production, maximal (Max) respiration, spare capacity, and non-mitochondrial respiration in indicated cells. (G) ECAR of indicated cells at baseline and in response to glucose, oligomycin (Oligo), and 2-deoxy-D-glucose (2-DG). (H, I, J, K) Quantification of glycolysis, glycolytic capacity, glycolytic reserve, and non-glycolytic acidification in indicated cells. Cells were pooled from three mice per genotype. Data are representative of two experiments. Samples were compared using t test, with **** indicating P-value < 0.0001, *** indicating P-values from 0.0001 to 0.001, ** indicating P-values from 0.001 to 0.01, and * indicating P-values from 0.01 to 0.05. Values shown here are mean ± SEM.
Figure 5.
Figure 5.. Reduced metabolic regulators in activated Themis-deficient OT-I CD8+ T cells.
(A, B, C, D, E, F, G, H) Naïve Themis cWT (blue) and Themis cKO TX (red) OT-I CD8+ T cells were stimulated with OVA APLs. After 24 h, p-Akt, c-Myc, and p-S6 were measured by flow cytometry in these groups. (A) Proportions of p-Akt-positive cells. (B, C) Bar graph summary of p-Akt MFI in p-Akt-positive cells and histogram showing the levels of p-Akt. (D) Proportions of p-Myc–positive cells. (E, F) Bar graph summary of p-Myc MFI in p-Myc–positive cells and histogram showing the levels of p-Myc. (G) Proportions of p-S6–positive cells. (H) Histogram showing levels of p-S6. Cells were pooled from 3 mice per genotype. (I-L) Naïve Themis cWT and Themis cKO TX OT-I CD8+ T cells were stimulated with OVA APLs for 3 d. (I) Quantification of mitochondrial mass by measuring MFI of MitoTracker Green FM by flow cytometry. (J) Overlaid histograms of Themis OT-I cWT (blue) and cKO TX (red) CD8+ T cells displaying amount of MitoTracker Green FM in the indicated cells. (K) Percentage of CD98 CD8+ T cells in Themis cWT and Themis cKO TX samples. (L) Overlaid histograms of Themis cWT (blue) and OT-I Themis cKO TX (red) CD8+ T cells showing CD98 expression. Cells were pooled from three mice per genotype. Data are representative of three experiments. Samples were compared using two-way ANOVA with multiple comparison test (all graphs except g) and t test (g), with **** indicating P-value < 0.0001, *** P-values from 0.0001 to 0.001, ** P-values from 0.001 to 0.01, and * P-values from 0.01 to 0.05. Values shown here are mean ± SD.
Figure 6.
Figure 6.. 3D functional assay of CTL from Themis cWT and cKO TX OT-I mice.
(A) Schematic layout of the microfluidic device to perform 3D co-culture of B16 melanoma cells and T cells from Themis cWT or cKO OT-I mice treated with tamoxifen (TX). The central channel (in purple) represents the tumor region, whereas the lateral channels (in cyan) provide nutrients and allow for CTL injection. (B) Zoomed-in schematic of the microfluidic system. Target melanoma cells were embedded in an extracellular matrix-like hydrogel and inserted in the central microchannel flanked by two lateral channels containing cell culture medium and CTL. Live and dead B16 melanoma cells are shown in green and red, respectively. CTL are shown in blue. (C) Scatter plot of the percentage of dead B16–OVA cells after 24 h from the injection of OT-I Themis cWT or cKO TX CTL in the fluidic microchannel. ****P < 0.0001. (D) Representative images of the 3D tumor region after 24 h from the injection of CTL (in blue) into the system. Live and dead B16–OVA cells are shown in green and red, respectively. (E) Scatter plot of the percentage of dead B16-Q4R7 cells after 24 h from the injection of OT-I Themis cWT or cKO TX CTL in the fluidic microchannel. *P = 0.0231, ****P < 0.0001. (F) Representative images of the 3D tumor region after 24 h from the injection of CTL (in blue) into the system. Live and dead B16-Q4R7 cells are shown in green and red, respectively. (G) Scatter plot of the percentage of dead B16-OVA and B16-Q4R7 cells after 24 h from the injection of OT-I Themis cWT CTL in the fluidic microchannel. ****P < 0.0001. (H) Scatter plot of the percentage of dead B16-OVA and B16-Q4R7 cells after 24 h from the injection of OT-I Themis cKO TX CTL in the fluidic microchannel. ****P < 0.0001. (I) Scatter plot of the number of OT-I Themis cWT and cKO TX CTL infiltrated after 24 h in the 3D tumor region with B16-OVA. *P = 0.0369. (J) Scatter plot of the number of OT-I Themis cWT and cKO TX CTL infiltrated after 24 h in the 3D tumor region with B16-Q4R7. **P = 0.0019. Mean ± SD values are shown. Each data point in the graphs represent the value for one region of interest. Data are from n = 5 regions of interest per device, n = 3 devices per condition and n = 2 independent experiments. Samples were compared by one-way ANOVA with multiple comparisons (C, E) and by unpaired two-tailed t test (G, H, I, J).
Figure 7.
Figure 7.. Analysis of Themis-associated DEGs in mouse models in different Themis deletion models.
(A) Analysis of Themis-associated DEGs in mouse models representing acute (Upper panel: cWT or cKO OT-I mice treated with tamoxifen [TX] after 4 d TX treatment) and chronic (Lower panel: dLck-Cre–induced Themis deficiency compared with Themis sufficient dLck-Cre-negative model) Themis deficiency scenarios. The DEGs between experimental groups were estimated using DESeq2 (Love et al, 2014) with P < 0.05, and the Themis-associated DEGs are highlighted in red. Blue dots represent DEGs between transcriptomes from Cre-negative animals that were treated or non-treated with TX. Three mice per group were used, and n indicates the number of DEGs identified. (B) Functional analysis of the transcriptomic changes induced in CD8+ T cells by acute TX-driven Themis deletion in OT-I cKO. Themis-associated signatures from the experiment depicted in (A) (upper panel) were investigated for biological function using iDEP.96 platform (Ge et al, 2018) and GO Biological Process gene set as a reference. Blue indicates the negative effect of transcriptomic changes on a given process. (C) Upper panel: 3-dimensional comparison of DEGs between TX-induced acute Themis deficiency (left), TX-induced chronic (4 wk after start of TX treatment) Themis deficiency (right) to the DEGs from dLck-Cre model. The analysis was narrowed down into the Themis-associated 1,300 DEGs identified in the dLck-Cre model. Lower panel: Venn diagrams representing comparison of up-regulated and down-regulated genes from acute and chronic TX-induced Themis-deficient CD8+ T cells in relation to Themis-associated signatures identified in dLck-Cre–induced Themis deficiency model. (D) Functional comparison of transcriptomic changes associated with chronic Themis deficiency induced by TX (in Cre-ERT2 model) and dLck-Cre. Analysis was done using iDEP.96 platform and GO Biological Process gene set. Blue and red indicate negative and positive effects, respectively. (E) MA plots representing DEGs in acute and chronic TX-induced models together with Themis-associated genes from chronic Lck-Cre group as TCR signaling regulators (according to the GO Biological Process gene set).

Similar articles

Cited by

References

    1. Adriani G, Pavesi A, Tan AT, Bertoletti A, Thiery JP, Kamm RD (2016) Microfluidic models for adoptive cell-mediated cancer immunotherapies. Drug Discov Today 21: 1472–1478. 10.1016/j.drudis.2016.05.006 - DOI - PMC - PubMed
    1. Alam SM, Travers PJ, Wung JL, Nasholds W, Redpath S, Jameson SC, Gascoigne NRJ (1996) T cell receptor affinity and thymocyte positive selection. Nature 381: 616–620. 10.1038/381616a0 - DOI - PubMed
    1. Albakova Z, Mangasarova Y, Sapozhnikov A (2022) Impaired heat shock protein expression in activated T cells in B-cell lymphoma. Biomedicines 10: 2747. 10.3390/biomedicines10112747 - DOI - PMC - PubMed
    1. Autio A, Wang H, Velazquez F, Newton G, Parkos CA, Engel P, Engelbertsen D, Lichtman AH, Luscinskas FW (2022) SIRPα - CD47 axis regulates dendritic cell-T cell interactions and TCR activation during T cell priming in spleen. PLoS One 17: e0266566. 10.1371/journal.pone.0266566 - DOI - PMC - PubMed
    1. Avitahl N, Winandy S, Friedrich C, Jones B, Ge Y, Georgopoulos K (1999) Ikaros sets thresholds for T cell activation and regulates chromosome propagation. Immunity 10: 333–343. 10.1016/s1074-7613(00)80033-3 - DOI - PubMed

Publication types