Recommendations Emerging from Carbon Emissions Estimations of the Society for Neuroscience Annual Meeting
- PMID: 37739787
- PMCID: PMC10580811
- DOI: 10.1523/ENEURO.0476-22.2023
Recommendations Emerging from Carbon Emissions Estimations of the Society for Neuroscience Annual Meeting
Abstract
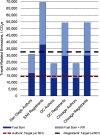
The annual Society for Neuroscience (SfN) meeting yields significant, measurable impacts that conflict with the environmental commitment of the Society and the Intergovernmental Panel on Climate Change (IPCC) recommendations to address the climate emergency (IPCC, 2018). We used 12,761 presenters' origins, two online carbon calculators, and benchmark values to estimate 2018 meeting-related travel, event venue operations, and hotel accommodation emissions. Presenters' conference travel resulted in between 17,298 and 8690 tons of atmospheric carbon dioxide (t CO2), with or without radiative forcing index factors. Over 92% of authors traveled by air and were responsible for >99% of total travel-related emissions. Extrapolations based on 28,691 registrants yielded between 69,592.60 metric tons of carbon dioxide equivalents (t CO2e) and 38,010.85 t CO2 from travel. Comparatively, authors' and registrants' hotel accommodation emissions equaled 429 and 965 t CO2e, whereas operation of the San Diego Convention Center equaled ∼107 t CO2e. We relate SfN meeting-related emissions to potential September Arctic Sea ice loss, labor productivity loss in lower-income equatorial countries, and future temperature-related deaths. We estimate emissions reductions of between 23% and 78% by incentivizing between 10% and 50% of the most distant registrants to attend virtually or connecting between two and seven in-person hubs virtually. Completely virtual meetings may yield a reduction of >99% relative to centralized in-person meetings and increase participation of women, queer and transgender scientists, and scientists from low- and middle-income countries. We strongly recommend adopting alternative meeting modes such as four or more in-person global hubs connected virtually by 2030 and fully virtual by 2050.
Keywords: climate change; global warming; hybrid conference; multiple-site conference; virtual conference.
Copyright © 2023 Kay et al.
Conflict of interest statement
The authors declare no competing financial interests.
Figures


Similar articles
-
Assessing Strategies to Reduce the Carbon Footprint of the Annual Meeting of the American Academy of Ophthalmology.JAMA Ophthalmol. 2023 Sep 1;141(9):862-869. doi: 10.1001/jamaophthalmol.2023.3516. JAMA Ophthalmol. 2023. PMID: 37561509 Free PMC article.
-
The carbon footprint of American Academy of Orthopaedic Surgeons and Pediatric Orthopaedic Society of North America national meetings.J Pediatr Soc North Am. 2024 Feb 28;6:100011. doi: 10.1016/j.jposna.2024.100011. eCollection 2024 Feb. J Pediatr Soc North Am. 2024. PMID: 40433246 Free PMC article.
-
Reducing the Carbon Footprint of Academic Conferences: The Example of the American Society of Tropical Medicine and Hygiene.Am J Trop Med Hyg. 2020 Nov;103(5):1758-1761. doi: 10.4269/ajtmh.20-1013. Am J Trop Med Hyg. 2020. PMID: 33069267 Free PMC article.
-
The Minderoo-Monaco Commission on Plastics and Human Health.Ann Glob Health. 2023 Mar 21;89(1):23. doi: 10.5334/aogh.4056. eCollection 2023. Ann Glob Health. 2023. PMID: 36969097 Free PMC article. Review.
-
Medical conferences in the era of environmental conscientiousness and a global health crisis: The carbon footprint of presenter flights to pre-COVID pediatric urology conferences and a consideration of future options.J Pediatr Surg. 2021 Aug;56(8):1312-1316. doi: 10.1016/j.jpedsurg.2020.07.013. Epub 2020 Jul 16. J Pediatr Surg. 2021. PMID: 32782130 Free PMC article. Review.
Cited by
-
[Pediatric rheumatology, a highly active field of pediatrics with close ties to adult rheumatology].Z Rheumatol. 2024 Feb;83(1):1-3. doi: 10.1007/s00393-023-01467-7. Epub 2024 Feb 6. Z Rheumatol. 2024. PMID: 38319361 German. No abstract available.
References
-
- Achten WMJ, Almeida J, Muys B (2013) Carbon footprint of science: more than flying. Ecol Indic 34:352–355. 10.1016/j.ecolind.2013.05.025 - DOI
-
- Astudillo MF, Azari Jafari H (2018) Estimating the global warming emissions of the LCAXVII conference: connecting flights matter. Int J Life Cycle Assess 23:1512–1516. 10.1007/s11367-018-1479-z - DOI
-
- Barron AR, Parker BJ, Sayre SS, Weber SS, Weisbord DJ (2020) Carbon pricing approaches for climate decisions in U.S. higher education: proxy carbon prices for deep carbonization. Elementa (Wash D C) 8:42.
-
- Berné O, Agier L, Hardy A, Lellouch E, Aumont O, Mariette J, Ben-Ari T (2022) The carbon footprint of scientific visibility. Environ Res Lett 17:124008. 10.1088/1748-9326/ac9b51 - DOI
MeSH terms
Substances
LinkOut - more resources
Full Text Sources
Medical
Research Materials
Miscellaneous
