. 2024 Jan 17;388(2):432-450.
doi: 10.1124/jpet.123.001710.

Preventing Long-Term Brain Damage by Nerve Agent-Induced Status Epilepticus in Rat Models Applicable to Infants: Significant Neuroprotection by Tezampanel Combined with Caramiphen but Not by Midazolam Treatment

Affiliations

Preventing Long-Term Brain Damage by Nerve Agent-Induced Status Epilepticus in Rat Models Applicable to Infants: Significant Neuroprotection by Tezampanel Combined with Caramiphen but Not by Midazolam Treatment

Marcio De Araujo Furtado et al. J Pharmacol Exp Ther. .

Abstract

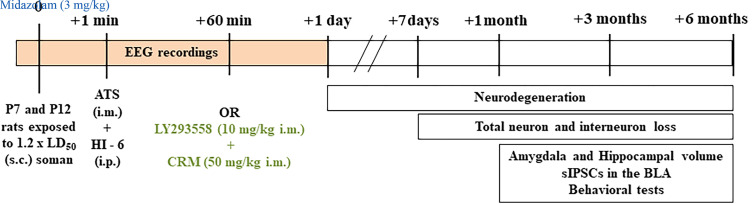
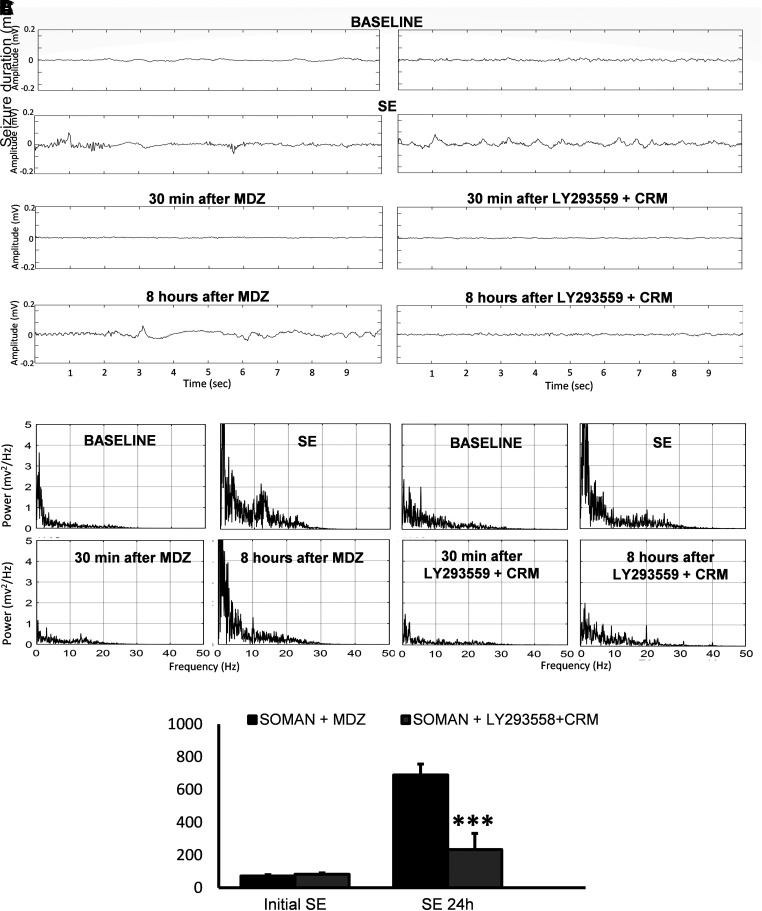
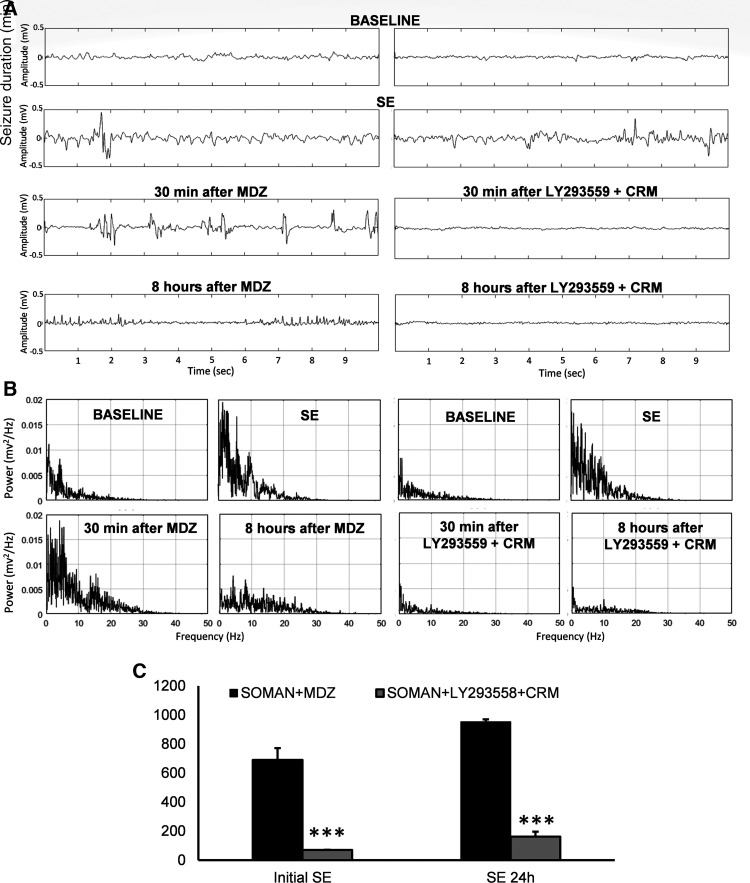
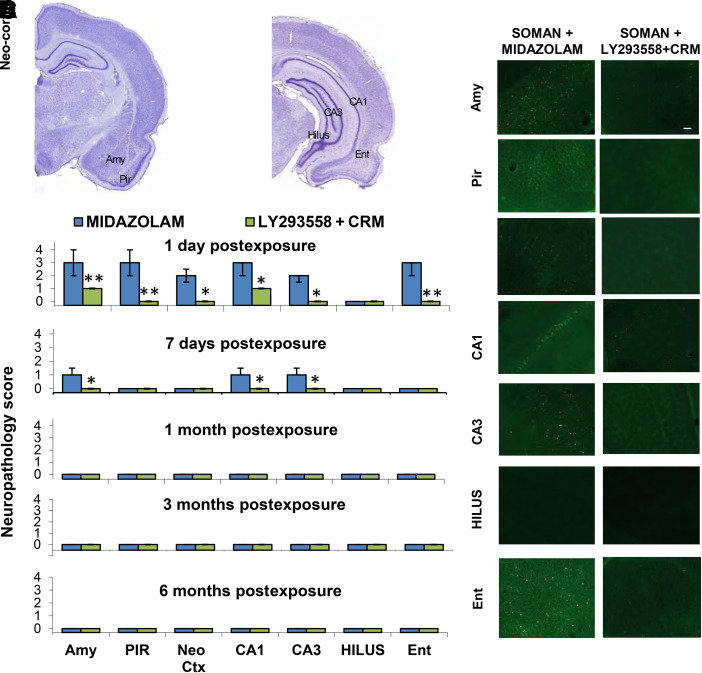
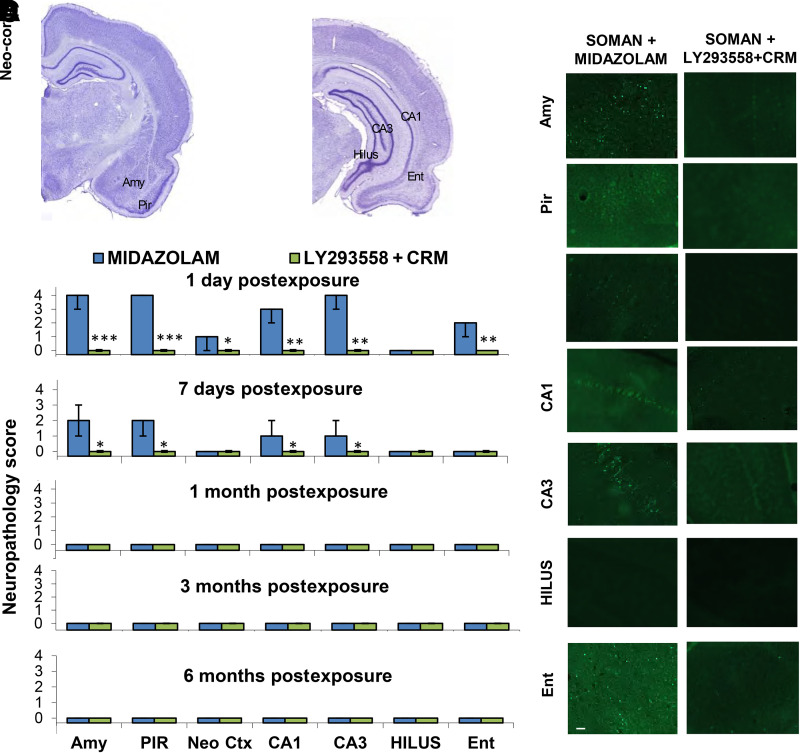
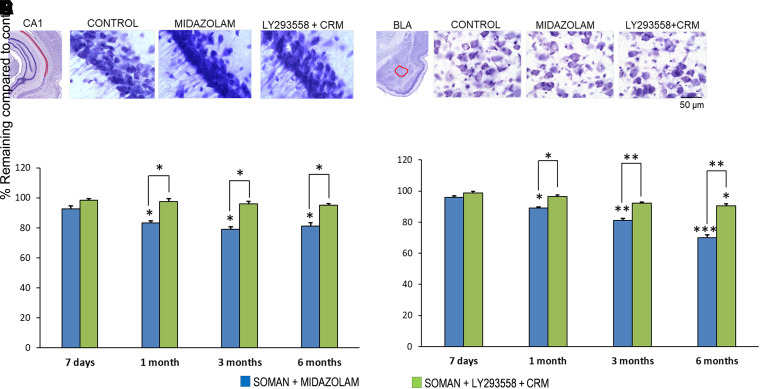
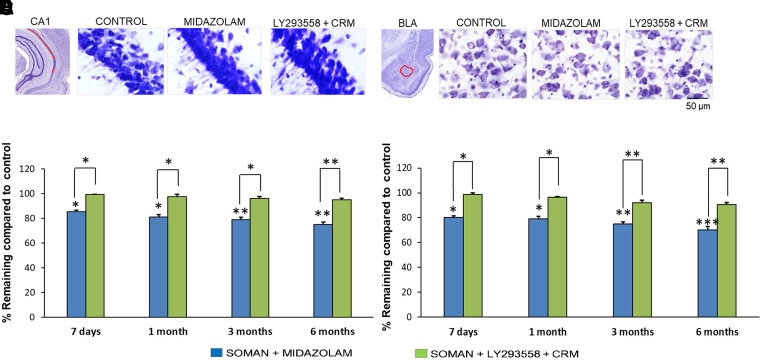
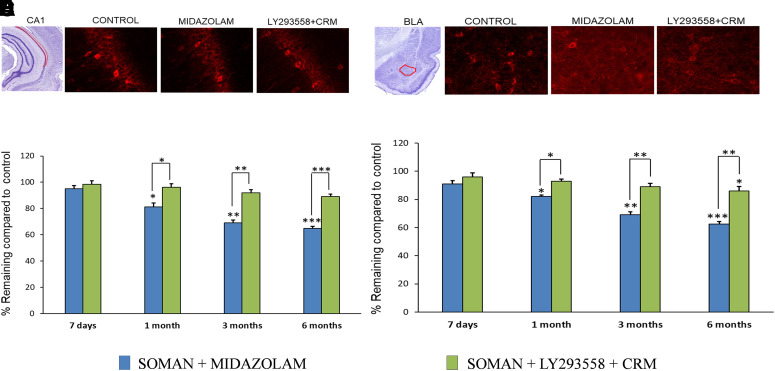
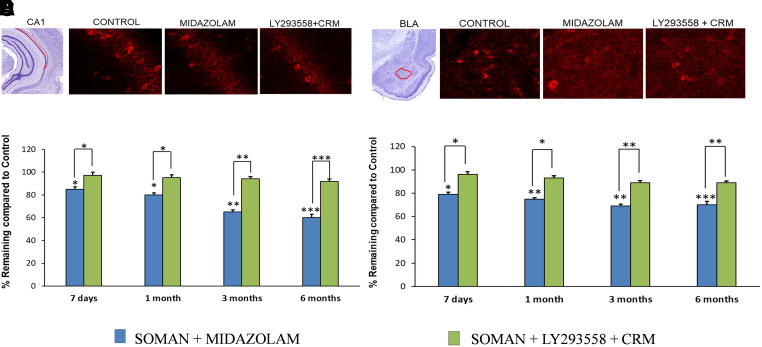
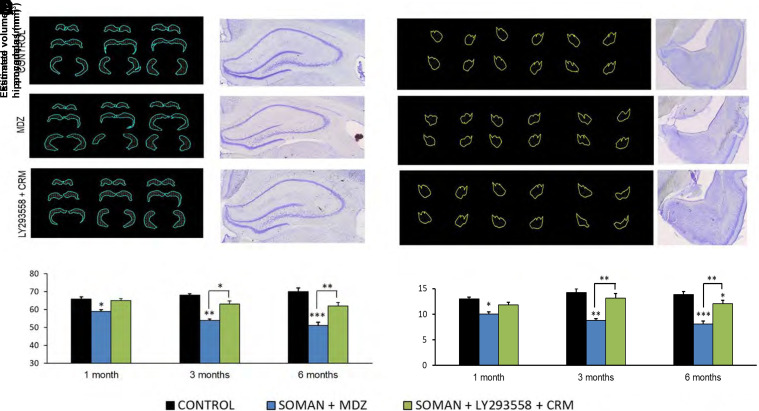
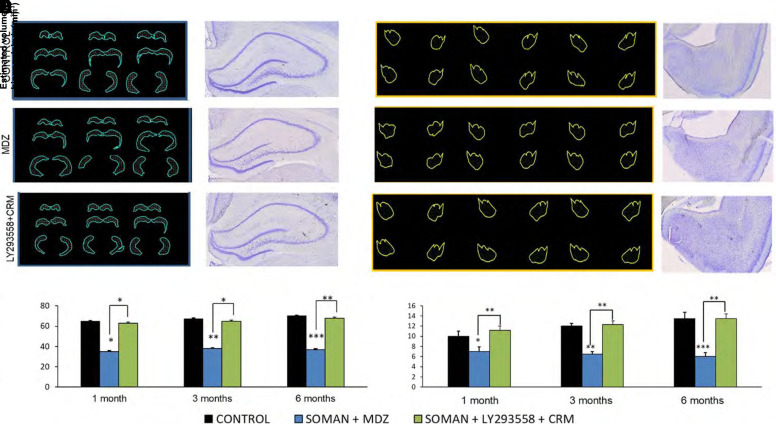
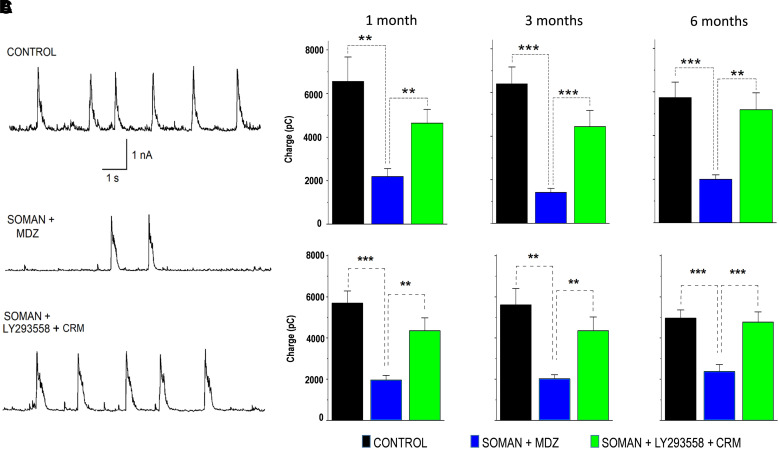
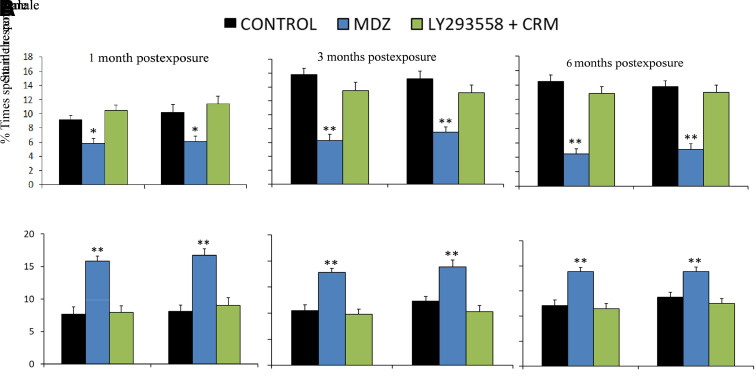
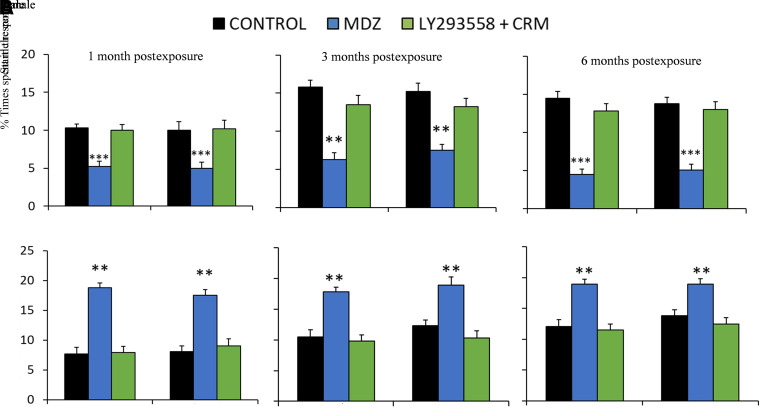
Acute exposure to nerve agents induces a peripheral cholinergic crisis and prolonged status epilepticus (SE), causing death or long-term brain damage. To provide preclinical data pertinent to the protection of infants and newborns, we compared the antiseizure and neuroprotective effects of treating soman-induced SE with midazolam (MDZ) versus tezampanel (LY293558) in combination with caramiphen (CRM) in 12- and 7-day-old rats. The anticonvulsants were administered 1 hour after soman exposure; neuropathology data were collected up to 6 months postexposure. In both ages, the total duration of SE within 24 hours after soman exposure was significantly shorter in the LY293558 plus CRM groups compared with the MDZ groups. Neuronal degeneration was substantial in the MDZ-treated groups but absent or minimal in the groups treated with LY293558 plus CRM. Loss of neurons and interneurons in the basolateral amygdala and CA1 hippocampal area was significant in the MDZ-treated groups but virtually absent in the LY293558 plus CRM groups. Atrophy of the amygdala and hippocampus occurred only in MDZ-treated groups. Neuronal/interneuronal loss and atrophy of the amygdala and hippocampus deteriorated over time. Reduction of inhibitory activity in the basolateral amygdala and increased anxiety were found only in MDZ groups. Spontaneous recurrent seizures developed in the MDZ groups, deteriorating over time; a small percentage of rats from the LY293558 plus CRM groups also developed seizures. These results suggest that brain damage can be long lasting or permanent if nerve agent-induced SE in infant victims is treated with midazolam at a delayed timepoint after SE onset, whereas antiglutamatergic treatment with tezampanel and caramiphen provides significant neuroprotection. SIGNIFICANCE STATEMENT: To protect the brain and the lives of infants in a mass exposure to nerve agents, an anticonvulsant treatment must be administered that will effectively stop seizures and prevent neuropathology, even if offered with a relative delay after seizure onset. The present study shows that midazolam, which was recently approved by the Food and Drug Administration for the treatment of nerve agent-induced status epilepticus, is not an effective neuroprotectant, whereas brain damage can be prevented by targeting glutamate receptors.


Figures

Fig. 1.
Fig. 1.
A diagrammatic overview of the study design. Male and female rats were exposed to soman on postnatal day 7 or 12 (time 0). Atropine sulfate (ATS) and 1-(2-hydroxyiminomethylpyridinium)-3-(4-carbamoylpyridinium)-2-oxapropane dichloride (HI-6) were administered within 1 minute after soman injection. Sixty minutes after soman injection, the rats were injected intramuscularly with MDZ or LY293558 + CRM. EEG recordings were obtained from a group of rats starting from baseline to 24 hours after soman exposure. Neuronal degeneration was assessed 1 day after soman exposure to 6 months postexposure at the timepoints indicated. Neuronal and interneuronal loss was estimated at 1 week and 1, 3, and 6 months postexposure. Amygdala and hippocampal volume, spontaneous inhibitory activity in the BLA, and the level of anxiety were examined at 1, 3, and 6 months postexposure.
Fig. 2.
Fig. 2.
Both MDZ and LY293558 plus CRM promptly suppressed the initial SE in P12 rats exposed to soman, but the total duration of SE was significantly shorter in the LY293558 plus CRM group. Anticonvulsant treatments were administered 1 hour after soman injection. Results from male and female rats have been grouped. (A) Representative EEG traces from a rat treated with MDZ (left set of four traces) and a rat treated with LY293558 plus CRM (right set of four traces) at baseline, during SE, and 30 minutes and 8 hours after anticonvulsant administration. (B) Fast Fourier transforms from 10-second EEG samples from the same rats as in (A) during baseline, SE, and 30 minutes and 8 hours after administration of MDZ (left set of graphs) or LY293558 plus CRM (right set of graphs). During SE, there is an overall increase in the power of the EEG signal, particularly in the lower frequencies. Thirty minutes after anticonvulsant treatment, EEG power decreased to baseline values in both the MDZ and the LY293558 plus CRM groups, but 8 hours after treatment, EEG power had returned to high levels only in the MDZ group. (C) Group data for the duration of the initial SE and the total duration of SE within 24 hours after soman exposure; n = 6 in each of the two treatment groups; ***P < 0.001 (Student’s t -test).
Fig. 3.
Fig. 3.
LY293558 plus CRM was more effective than MDZ in suppressing seizures in P7 rats exposed to soman. Anticonvulsant treatments were administered 1 hour after soman injection. Results from male and female rats have been grouped. (A) Representative EEG traces from a rat treated with MDZ (left set of 4 traces) and a rat treated with LY293558 plus CRM (right set of 4 traces) at baseline, during SE, and 30 minutes or 8 hours after anticonvulsant treatment. (B) Fast Fourier transforms from 10-second EEG samples from the same rats as in (A) during baseline, SE, and 30 minutes and 8 hours after administration of MDZ (left set of graphs) or LY293558 plus CRM (right set of graphs). LY293558 plus CRM is more effective than MDZ in suppressing and maintaining the power of EEG close to baseline levels. (C) Group data for the duration of the initial SE and the total duration of SE within 24 hours after soman exposure; n = 9 for the MDZ group, and n = 8 for the LY293558 plus CRM group; ***P < 0.001 (Student’s t -test).
Fig. 4.
Fig. 4.
Greater protection against neuronal degeneration by LY293558 plus CRM compared with MDZ treatment in rats exposed to soman on P12. Anticonvulsant treatments were administered 1 hour after soman injection; data from males and females under each treatment group have been combined. (A and B) Panoramic photomicrographs of Nissl-stained sections indicating the brain regions evaluated by FJB staining. (C) Representative photomicrographs of FJB-stained sections from the brain regions where neurodegeneration was studied. The sections are from animals evaluated 1 day after soman exposure. Total magnification is 100×. Scale bar is 50 μm. (D) Neuropathology scores (median and interquartile range) in the amygdala (Amy), piriform cortex (Pir), neocortical region (Neo-Ctx), hippocampal areas (CA1, CA3, and HILUS), and entorhinal cortex (Ent) 1 day, 7 days, and 1, 3, and 6 months postexposure. *P < 0.05, **P < 0.01 (Mann-Whitney U test, n = 10 rats per group).
Fig. 5.
Fig. 5.
Complete protection against neuronal degeneration by LY293558 plus CRM but not by MDZ treatment in rats exposed to soman on P7. Anticonvulsant treatments were administered 1 hour after soman injection; data from males and females under each treatment group have been combined. (A and B) Panoramic photomicrographs of Nissl-stained sections indicating the brain regions evaluated by FJB staining. (C) Representative photomicrographs of FJB-stained sections from the brain regions where neurodegeneration was studied. The sections are from animals evaluated 1 day after soman exposure. Total magnification is 100×. Scale bar is 50 μm. (D) Neuropathology scores (median and interquartile range) in the amygdala (Amy), piriform cortex (Pir), neocortical region (Neo-Ctx), hippocampal areas (CA1, CA3, and HILUS), and entorhinal cortex (Ent) at 1 day, 7 days, and 1, 3, and 6 months postexposure. *P < 0.05, **P < 0.01, ***P < 0.001 (Mann-Whitney U test, n = 16 rats per group).
Fig. 6.
Fig. 6.
Protection against neuronal loss in the CA1 hippocampal area and the BLA by LY293558 plus CRM, but not by MDZ, in rats exposed to soman on P12. Neuronal loss was assessed at 7 days and 1, 3, and 6 months postexposure (data from male and female rats are combined). (A and D) Panoramic photomicrographs of Nissl-stained sections showing the CA1 area (A) and the BLA (D) where neuronal loss was assessed. (B and E) Photomicrographs of Nissl-stained sections from the CA1 area (B) and the BLA (E) of representative animals from the control group (not exposed to soman), the MDZ-treated group, and the LY293558 plus CRM–treated group taken at 1 month (B) and 3 months (E) postexposure. Total magnification is 630×. Scale bar is 50 μm. (C and F) Group data of stereological estimation of the total number of neurons in the CA1 area (C) and the BLA (F) as the percentage of the control group. *P < 0.05; **P < 0.01; ***P < 0.001 for comparisons between the control, the MDZ, and the LY293558 plus CRM groups [n = 10 rats per group (5 males and 5 females); ANOVA, least significant difference post hoc test]. There was also an effect of time (deterioration over time) for the neuronal loss in both the CA1 area and the BLA of the MDZ group (P < 0.05; ANOVA, Tukey Honestly Significant Difference post hoc test).
Fig. 7.
Fig. 7.
LY293558 plus CRM but not MDZ provides full protection against neuronal loss in the CA1 hippocampal area and in the BLA in rats exposed to soman on P7. Neuronal loss was assessed at 7 days and 1, 3, and 6 months postexposure (data from male and female rats are combined). (A and D) Panoramic photomicrographs of Nissl-stained sections showing the CA1 area (A) and the BLA (D) where neuronal loss was assessed. (B and E) Photomicrographs of Nissl-stained sections from the CA1 area (B) and the BLA (E) of representative animals from the control group (not exposed to soman), the MDZ group, and the LY293558 plus CRM group taken at 3 months postexposure. Total magnification is 630×. Scale bar is 50 μm. (C and F) Group data of stereological estimation of the total number of neurons in the CA1 area (C) and the BLA (F) as the percentage of the control group. *P < 0.05; **P < 0.01; ***P < 0.001 for comparisons between the control, the MDZ, and the LY293558 plus CRM groups [n = 20 rats per group (10 males and 10 females); ANOVA, Tukey HSD post hoc test]. There was also an overall effect of time (deterioration over time) for the neuronal loss in the BLA of MDZ-treated animals, with a significant reduction in neuronal count from 7 days to 6 months (P < 0.05; ANOVA, Tukey Honestly Significant Difference post hoc test).
Fig. 8.
Fig. 8.
LY293558 plus CRM but not MDZ provides full protection against interneuronal loss in the CA1 hippocampal area and the BLA in rats exposed to soman on P12. Loss of GABAergic interneurons was assessed at 7 days and 1, 3, and 6 months postexposure (data from male and female rats are combined). (A and D) Panoramic photomicrographs of Nissl-stained sections indicating the CA1 area (A) and the BLA (D) where neuronal loss was assessed. (B and E) Photomicrographs of GAD-67 immuno-stained sections from the CA1 area (B) and the BLA (E) of representative animals from the control group (not exposed to soman), the MDZ group, and the LY293558 plus CRM group taken at 3 months postexposure. Total magnification is 630×. (C and F) Group data of stereological estimation of the total number of neurons in the CA1 area (C) and the BLA (F) as the percentage of the control group. *P < 0.05; **P < 0.01; and ***P < 0.001 for comparisons between the control, the MDZ, and the LY293558 plus CRM groups [n = 10 rats per group (5 males and 5 females); ANOVA, Tukey HSD post hoc test]. There was also an overall effect of time (deterioration over time) for the reduction in interneuronal numbers in both the CA1 area and the BLA of MDZ-treated animals (P < 0.05; ANOVA, Tukey Honestly Significant Difference post hoc test).
Fig. 9.
Fig. 9.
LY293558 plus CRM but not MDZ provides full protection against interneuronal loss in the CA1 hippocampal area and the BLA in rats exposed to soman on P7. Loss of interneurons was assessed at 7 days and 1, 3, and 6 months postexposure (data from male and female rats are combined). (A and D) Panoramic photomicrographs of Nissl-stained sections indicating the CA1 area (A) and the BLA (D) where interneuron loss was assessed. (B and E) Photomicrographs of GAD-67 immuno-stained sections from the CA1 area (B) and the BLA (E) of representative animals from the control group (not exposed to soman), the MDZ group, and the LY293558 plus CRM group taken at 3 months postexposure. Total magnification is 630×. (C and F) Group data of stereological estimation of the number of interneurons in the CA1 area (C) and the BLA (F) as the percentage of the control group. *P < 0.05; **P < 0.01; and ***P < 0.001 for comparisons between the control, the MDZ, and the LY293558 plus CRM groups [n = 20 rats per group (10 males and 10 females); ANOVA, Tukey HSD post hoc test]. Interneuronal loss in the CA1 area was significantly greater at 3 and 6 months in comparison with the 7-day and 1-month timepoints, and in the BLA, it was significantly greater at 6 months than at 7 days (P < 0.05; ANOVA, Tukey Honestly Significant Difference post hoc test).
Fig. 10.
Fig. 10.
Protection against atrophy of the hippocampus and the amygdala by LY293558 plus CRM but not by MDZ in rats exposed to soman on P12. Hippocampal and amygdala volumes were examined at 1, 3, and 6 months postexposure. (A and D) Tracings of the hippocampus (A) and the amygdala (D) in a series of slices. (B and E) Representative photomicrographs of Nissl-stained sections of the hippocampus (B) and the amygdala (E) from control rats, soman-exposed rats that received MDZ, and soman-exposed rats that received LY293558 plus CRM (from 6 months postexposure). (C and F) Group data showing the estimated volume of the hippocampus (C) and the amygdala (F) in the control group and the two experimental groups at 1, 3, or 6 months postexposure. Sample size: n = 10 rats (five males and five females) per group. *P < 0.05; **P < 0.01; ***P < 0.001 (one-way ANOVA with least significant difference post hoc). There was also a significant time effect (deterioration of atrophy over time) for both the hippocampus and the amygdala of the MDZ group (P < 0.05; ANOVA, Tukey Honestly Significant Difference post hoc test).
Fig. 11.
Fig. 11.
LY293558 plus CRM but not MDZ provides full protection against atrophy of the hippocampus and the amygdala in rats exposed to soman on P7. Hippocampal and amygdala volumes were examined at 1, 3, and 6 months postexposure. (A and D) Tracings of the hippocampus (A) and the amygdala (D) in a series of slices. (B and E) Representative photomicrographs of Nissl-stained sections of the hippocampus (B) and the amygdala (E) from control rats, soman-exposed rats that received MDZ, and soman-exposed rats that received LY293558 plus CRM (from 6 months postexposure). (C and F) Group data showing the estimated volume of the hippocampus (C) and the amygdala (F) in the control group and the two experimental groups at 1, 3, or 6 months postexposure. Sample size: n = 20 rats (10 males and 10 females) per group. *P < 0.05; **P < 0.01; ***P < 0.001 (one-way ANOVA with least significant difference post hoc).
Fig. 12.
Fig. 12.
LY293558 plus CRM but not MDZ protects against reduction of inhibitory activity in the BLA in rats exposed to soman on P12 or P7. (A) Representative traces of sIPSC “bursts” recorded from BLA principal neurons of a control rat (not exposed to soman), a soman-exposed rat treated with MDZ, and a soman-exposed rat treated with LY293558 plus CRM (the example is from female rats exposed to soman on P12; the IPSCs were recorded 1 month postexposure). Holding potential is +30 mV. There are no receptor antagonists present in the slice medium. (B) Group data of the total charge transferred by sIPSCs (during a 40-second time window) at the three postexposure timepoints for rats exposed to soman on P12 (sample size is n = 13 for each group at each timepoint). (C) Group data as in (B) for rats exposed to soman on P7. Sample sizes at 1 month postexposure: control, n = 40; MDZ group, n = 28; LY293558 plus CRM group, n = 18. At 3 months postexposure: control, n = 15; MDZ group, n = 19; LY293558 plus CRM group, n = 15. At 6 months postexposure: control, n = 24; MDZ group, n = 20; LY293558 plus CRM group n = 19. *P < 0.05; **P < 0.01; ***P < 0.001 (Mann-Whitney U test).
Fig. 13.
Fig. 13.
LY293558 plus CRM but not MDZ protected against an increase in anxiety-like behavior in rats exposed to soman on P12. (A) Group data of the percentage of the total movement time that was spent in the center of the open field by male and female control rats (not exposed to soman), MDZ-treated rats, and LY293558 plus CRM–treated rats at 1, 3, and 6 months postexposure. (B) Group data of the amplitude of the startle responses to 120 dB acoustic stimulus bursts for the male and female control groups and the two experimental groups at the three postexposure timepoints. Sample size n ranges from 8 to 10 rats per group. *P < 0.05; **P < 0.01 in comparison with the control group and the LY293558 plus CRM group (one-way ANOVA with Dunnett’s T post hoc).
Fig. 14.
Fig. 14.
LY293558 plus CRM but not MDZ protected against an increase in anxiety-like behavior in rats exposed to soman on P7. (A) Group data of the percentage of the total movement time that was spent in the center of the open field by male and female control rats (not exposed to soman), MDZ-treated rats, and LY293558 plus CRM–treated rats at 1, 3, and 6 months postexposure. (B) Group data of the amplitude of the startle responses to 120 dB acoustic stimulus bursts for the male and female control groups and the two experimental groups at the three postexposure timepoints. Sample size: n = 10 rats per group. *P < 0.05; **P < 0.01; ***P < 0.001 in comparison with the control group and the LY293558 plus CRM group (one-way ANOVA with Dunnett’s T post hoc).

Similar articles

Cited by

References

    1. Andersen SL (2003) Trajectories of brain development: point of vulnerability or window of opportunity? Neurosci Biobehav Rev 27:3–18. - PubMed
    1. Andreollo NA, Santos EF, Araújo MR, Lopes LR (2012) Rat’s age versus human’s age: what is the relationship? Arq Bras Cir Dig 25:49–51. - PubMed
    1. Apland JP, Aroniadou-Anderjaska V, Figueiredo TH, Rossetti F, Miller SL, Braga MF (2014) The limitations of diazepam as a treatment for nerve agent-induced seizures and neuropathology in rats: comparison with UBP302. J Pharmacol Exp Ther 351:359–372. - PMC - PubMed
    1. Apland JP, Figueiredo TH, Qashu F, Aroniadou-Anderjaska V, Souza AP, Braga MF (2010) Higher susceptibility of the ventral versus the dorsal hippocampus and the posteroventral versus anterodorsal amygdala to soman-induced neuropathology. Neurotoxicology 31:485–492. - PMC - PubMed
    1. Aroniadou-Anderjaska V, Apland JP, Figueiredo TH, De Araujo Furtado M, Braga MF (2020) Acetylcholinesterase inhibitors (nerve agents) as weapons of mass destruction: History, mechanisms of action, and medical countermeasures. Neuropharmacology 181:108298. - PubMed

Publication types

MeSH terms

LinkOut - more resources