. 2023 Sep 22;10(6):e200166.
doi: 10.1212/NXI.0000000000200166. Print 2023 Nov.

Natalizumab Treatment Induces Proinflammatory CD4 T Cells Preferentially in the Integrin β7+ Compartment

Affiliations

Natalizumab Treatment Induces Proinflammatory CD4 T Cells Preferentially in the Integrin β7+ Compartment

Mélanie Nguyen Ky et al. Neurol Neuroimmunol Neuroinflamm. .

Erratum in

  • Corrections to Preprint Server Information.
    [No authors listed] [No authors listed] Neurol Neuroimmunol Neuroinflamm. 2024 Jul;11(4):e200267. doi: 10.1212/NXI.0000000000200267. Epub 2024 May 16. Neurol Neuroimmunol Neuroinflamm. 2024. PMID: 38754048 Free PMC article. No abstract available.

Abstract

Background and objectives: Natalizumab, a monoclonal humanized antibody targeting integrin α4, inhibits the transmigration of lymphocytes into the CNS by preventing the interaction of integrin α4β1 with V-CAM expressed on brain vascular endothelial cells. Although natalizumab treatment reduces the clinical relapse rate in patients with relapsing-remitting MS, its discontinuation after reactivation of the JC virus is associated with a rebound of the disease in 20% of patients. The mechanisms of this rebound are not elucidated, but natalizumab increases the frequencies of circulating CD4 T cells expressing proinflammatory cytokines as well as the proportion of circulating Th17/Th1 cells (Th1-like Th17 cells). Gut-derived memory CD4 T cells are a population of growing interest in the pathogenesis of MS, but whether and how their properties are affected by natalizumab is not known. Here, we studied the phenotype and cytokine expression profile of circulating gut-derived memory CD4 T cells in patients with relapsing-remitting MS under natalizumab.

Methods: We identified gut-derived memory CD4 T cells by their expression of integrin β7 and compared their properties and those of integrin β7- memory CD4 T cells across healthy donors and patients with relapsing-remitting MS treated or not with natalizumab. We also compared the capacity of integrin β7- and integrin β7+ CD4 T-cell subsets to transmigrate in vitro across a model of blood-brain barrier.

Results: The proportions of proinflammatory Th17/Th1 cells as well as of IL-17A+IFNγ+ and IL-17A+GM-CSF+ cells were higher in memory CD4 T cells expressing integrin β7 in patients receiving natalizumab compared with healthy donors and patients with relapsing-remitting MS not receiving natalizumab. By contrast, integrin β7 negative memory CD4 T cells only presented a modest increased in their proportion of Th17/Th1 cells under natalizumab. We further observed that integrin β7+ Th17/Th1 cells migrated as efficiently as integrin β7- Th17/Th1 across a monolayer of brain microvascular endothelial cells.

Discussion: Our study shows that circulating integrin β7+ memory CD4 T cells of patients with relapsing-remitting MS under natalizumab are enriched in proinflammatory cells supporting the hypothesis that integrin β7+ memory CD4 T cells could play a pathogenic role in the disease rebound observed at natalizumab discontinuation.


Conflict of interest statement

B. Brochet reports grants, research support, personal fees or nonfinancial support from Genzyme, Bayer, Medday, Actelion, Roche, Biogen, Celgene, Novartis, and Merck outside the submitted work; A. Ruet or her institution reports grants, research support, personal fees or nonfinancial support from Genzyme, Bayer, Roche, Biogen, Novartis, and Merck outside the submitted work. Go to Neurology.org/NN for full disclosures.

Figures

Figure 1
Figure 1. Integrin β7+ Memory CD4 T Cells Comprised a Higher Proportion of Th17/Th1 Cells Than Integrin β7− Memory CD4 T Cells
(A) Representative flow cytometry plots of the expression of int.α4 in memory CD4 T cells. (B) Representative flow cytometry plot showing the expression of int.β1 and int.β7 on int.α4+ memory CD4 T cells. (C) MFI of int.β1 on int.α4+int.β7− and int.α4+int.β7+ memory CD4 T cells in healthy individuals (n = 61). (D) Percentages of Th1 (CXCR3+CCR6-), Th2 (CXCR3-CCR6-), Th17 (CXCR3-CCR6+), and Th17/Th1(CXCR3+CCR6+) cells in int.β7− and int.β7+ CXCR5- memory CD4 T cells from healthy donors (n = 61). The paired Student t test.
Figure 2
Figure 2. Integrin β7+ Memory CD4 T Cells Display a Higher Proinflammatory Profile Compared With Integrin β7− Memory CD4 T Cells
Percentages of int.β7− and int.β7+ memory CD4 T cells expressing IFNγ (Α), MIP-1β (B), IL-22 (C), and IL-10 (D) in healthy donors (n = 35–36) after PMA and ionomycin stimulation. The paired Student t test.
Figure 3
Figure 3. Natalizumab Treatment Decreases the Expression of Brain Homing Molecules at the Surface of Integrin β7+ Memory CD4 T Cells and Induces Their Retention in Periphery
(A and B) Absolute numbers per μl of blood of int.β7− (A) and int.β7+ (B) memory CD4 T cells in healthy individuals (n = 57) and patients with RRMS not treated (NTZ−, n = 32) or treated (NTZ+, n = 34) with natalizumab. (C and D) Median of fluorescence intensity of int.α4 (C) and int.β1 (D) expressed by int.β7+ memory CD4 T cells in heathy donors (n = 61), RRMS NTZ− (n = 19) and RRMS NTZ+ (n = 29) groups. One-way ANOVA followed by the Tukey multiple comparison test.
Figure 4
Figure 4. Integrin β7+ Memory CD4 T Cells From Patients With RRMS Treated With Natalizumab Contain an Increased Proportion of Th17/Th1
Percentages of Th1 (A), Th2 (B), Th17 (C), and Th17/Th1 (D) in int.β7− CXCR5- and int.β7+ CXCR5- memory CD4 T cells in healthy donors (n = 61), RRMS NTZ− (n = 21), and RRMS NTZ+ (n = 29) groups. One-way ANOVA followed by the Tukey multiple comparison test.
Figure 5
Figure 5. Integrin β7+ Memory CD4 T Cells From Patients With RRMS Treated With Natalizumab Display Higher Expression of Markers Associated With Pathogenicity
(A–C) Percentages of CD226 (A), PD-1 (B), and ICOS (C) expressing cells in int.β7− and int.β7+ memory CD4 T cells of healthy donors (n = 61–62), RRMS NTZ− (n = 24–33), and RRMS NTZ+ (n = 32–38) groups. (D) Percentages of CD146 expressing cells in int.β7− and int.β7+ memory CD4 T cells of healthy donors (n = 17), RRMS NTZ− (n = 14), and RRMS NTZ+ (n = 16) groups. One-way ANOVA followed by the Tukey multiple comparison test.
Figure 6
Figure 6. Integrin β7+ Memory CD4 T Cells From Patients With RRMS Under Natalizumab Display an Increased Capacity to Express GM-CSF, IL-17A, IL-17F, and IL22
Percentages of int.β7− and int.β7+ memory CD4 T cells expressing GM-CSF (A), IL-17A (B), IL-17F (C), and IL-22 (D) after PMA and ionomycin stimulation in healthy controls (n = 32–36), RRMS NTZ− (n = 10–13), and RRMS NTZ+ (n = 31–36) groups. One-way ANOVA followed by the Tukey multiple comparison test.
Figure 7
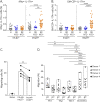
Figure 7. Integrin β7+ Memory CD4 T Cells Are Enriched in IFNγ+IL-17A+ and GM-CSF+IL-17A+ Cells
(A and B) Percentages of IFNγ+IL-17A+ (A) and of GM-CSF+IL-17A+ (B) cells in int.β7− and int.β7+ memory CD4 T cells in healthy donors (n = 32), RRMS NTZ− (n = 10), and RRMS NTZ+ (n = 31) groups. One-way ANOVA followed by the Tukey multiple comparison test. (C) Percentages of naive CD4 T cells, integrin α4+ integrin β7−, and integrin α4+ integrin β7+ memory CD4 T cells migrating across a monolayer of hCMEC/D3 prestimulated during 24 h with TNFα. Data from one experiment performed in quadruplicate representative of 5 experiments performed with different healthy donor. Data points are paired per transwell. Paired Student t test. (D) Percentages of migration of the indicated Th subsets expressing or not int.β7 across a monolayer of hCMEC/D3 stimulated (C). Data from 4 experiments each performed in triplicate with different healthy donor are shown in scattered dot plot. Floating bars (min and max) with line at median are indicated. One-way ANOVA followed by the Tukey multiple comparison test.

References

    1. Lassmann H. Multiple sclerosis pathology. Cold Spring Harb Perspect Med. 2018;8(3):a028936. doi:10.1101/cshperspect.a028936 - DOI - PMC - PubMed
    1. van Langelaar J, van der Vuurst de Vries RM, Janssen M, et al. . T helper 17.1 cells associate with multiple sclerosis disease activity: perspectives for early intervention. Brain. 2018;141(5):1334-1349. doi:10.1093/brain/awy069 - DOI - PubMed
    1. Legroux L, Arbour N. Multiple sclerosis and T lymphocytes: an entangled story. J Neuroimmune Pharmacol. 2015;10(4):528-546. doi:10.1007/s11481-015-9614-0 - DOI - PMC - PubMed
    1. Kebir H, Ifergan I, Alvarez JI, et al. . Preferential recruitment of interferon-gamma-expressing TH17 cells in multiple sclerosis. Ann Neurol. 2009;66(3):390-402. doi:10.1002/ana.21748 - DOI - PubMed
    1. Kebir H, Kreymborg K, Ifergan I, et al. . Human TH17 lymphocytes promote blood-brain barrier disruption and central nervous system inflammation. Nat Med. 2007;13(10):1173-1175. doi:10.1038/nm1651 - DOI - PMC - PubMed

Publication types