. 2023 Sep 22;14(1):5917.
doi: 10.1038/s41467-023-41593-z.

SCARB2 drives hepatocellular carcinoma tumor initiating cells via enhanced MYC transcriptional activity

Affiliations

SCARB2 drives hepatocellular carcinoma tumor initiating cells via enhanced MYC transcriptional activity

Feng Wang et al. Nat Commun. .

Abstract

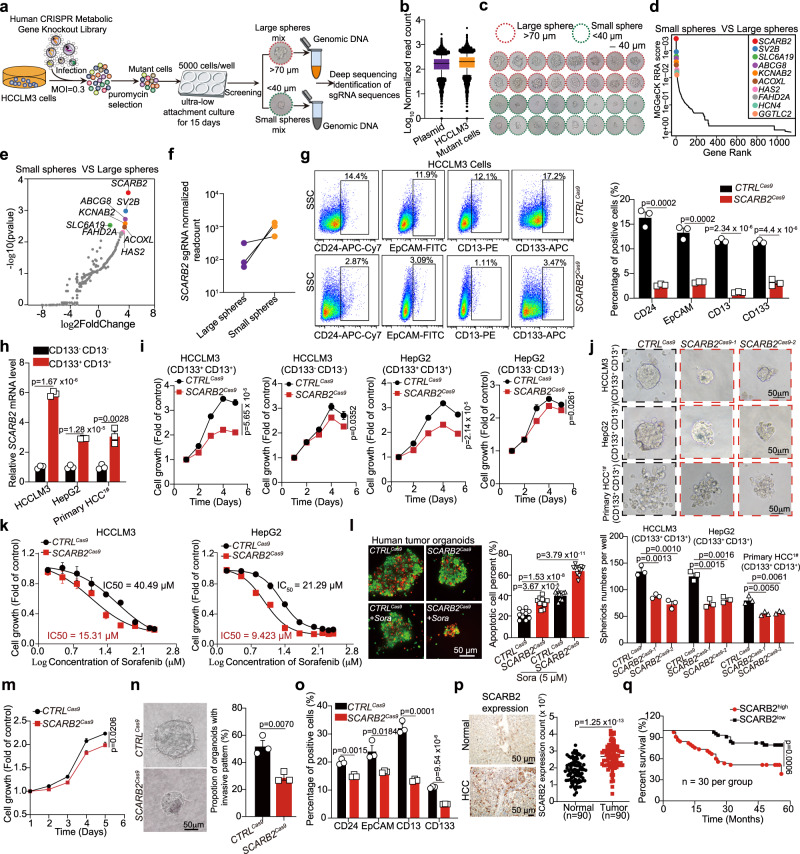
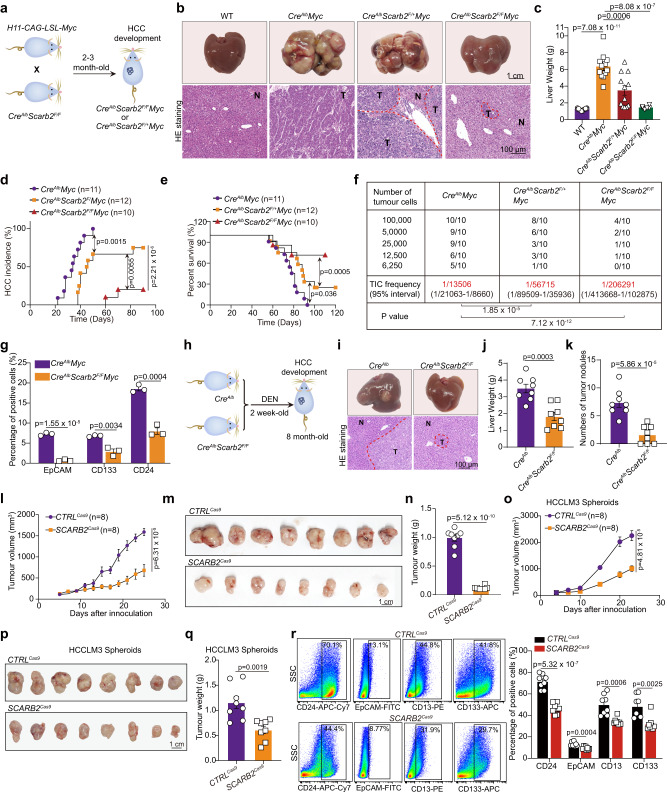
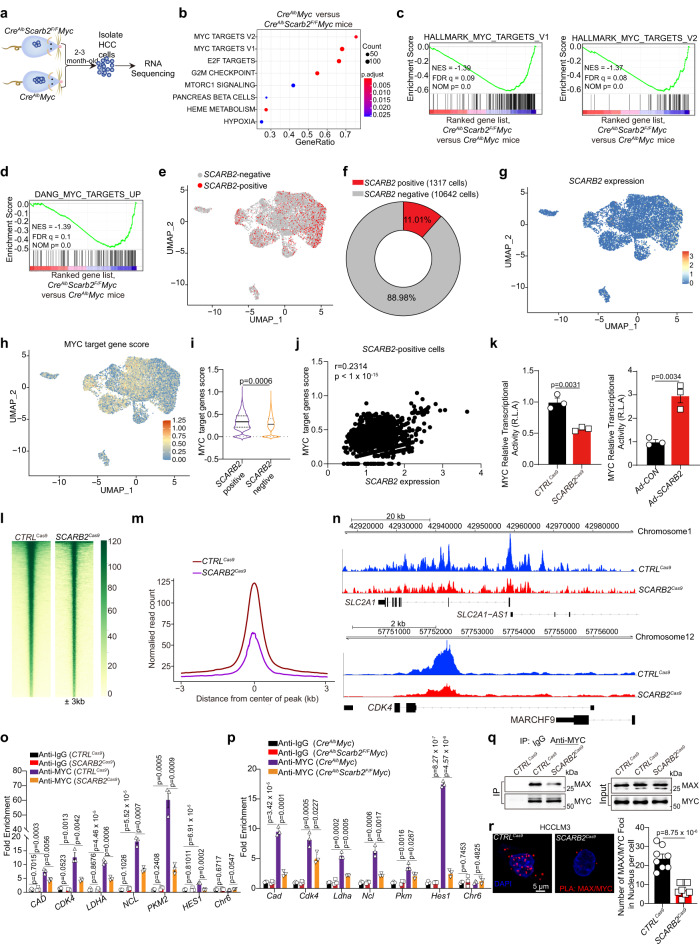
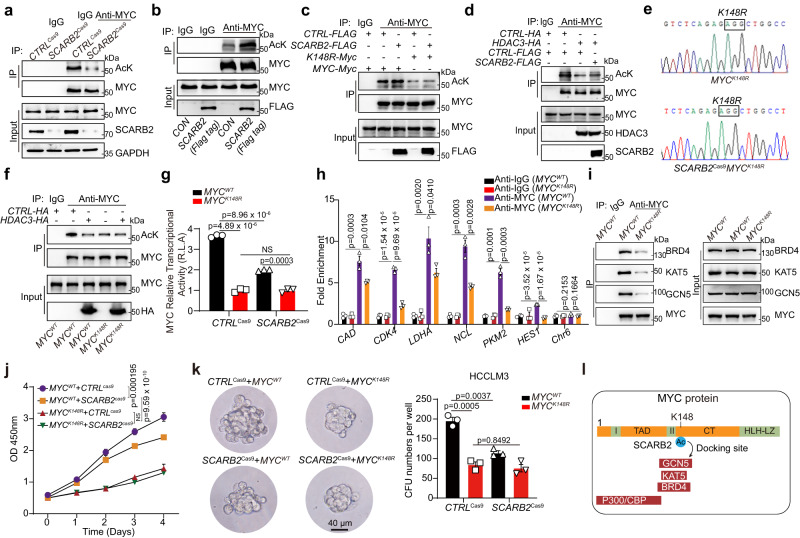
CSCs (Cancer stem cells) with distinct metabolic features are considered to cause HCC (hepatocellular carcinoma) initiation, metastasis and therapeutic resistance. Here, we perform a metabolic gene CRISPR/Cas9 knockout library screen in tumorspheres derived from HCC cells and find that deletion of SCARB2 suppresses the cancer stem cell-like properties of HCC cells. Knockout of Scarb2 in hepatocytes attenuates HCC initiation and progression in both MYC-driven and DEN (diethylnitrosamine)-induced HCC mouse models. Mechanistically, binding of SCARB2 with MYC promotes MYC acetylation by interfering with HDCA3-mediated MYC deacetylation on lysine 148 and subsequently enhances MYC transcriptional activity. Screening of a database of FDA (Food and Drug Administration)-approved drugs shows Polymyxin B displays high binding affinity for SCARB2 protein, disrupts the SCARB2-MYC interaction, decreases MYC activity, and reduces the tumor burden. Our study identifies SCARB2 as a functional driver of HCC and suggests Polymyxin B-based treatment as a targeted therapeutic option for HCC.


Conflict of interest statement

The authors declare no competing interests.

Figures

Fig. 1
Fig. 1. CRISPR/Cas9 library screening identified SCARB2 as a positive modulator of stem cell-like characteristics of HCC cells.
a Schematic diagram illustrating the workflow for human CRISPR/Cas9 library screening. b The normalized read counts of all sgRNAs in CRISPR/Cas9 library plasmid (n = 29,957) and HCCLM3 cells infected with human CRISPR/Cas9 library (n = 29,875). The center line indicates the 50th percentiles; bounds of box = 25th–75th percentiles; whiskers = 10th–90th percentiles; minima: bottom whiskers; maxima: top whiskers. c Representative images of tumorspheres. large spheres (>70 µm); smaller spheres (<40 µm). d MAGeCK analysis and RRA ranking of top enriched genes in small tumorspheres compared to large tumorspheres. e Ranked dot plots of top enriched genes in small tumorspheres compared to large tumorspheres. P value was obtained by permutation test using Benjamini-Hochberg procedure by MAGeCK. f The normalized read counts of sgRNAs targeting SCARB2 between large tumorspheres and small tumorspheres. g Flow cytometric analysis of the proportion of CD24, EpCAM, CD13, or CD133 positive cells in CTRLCas9 or SCARB2Cas9 HCCLM3 cells. h Real-time PCR analysis of SCARB2 expression in CD133+ CD13+ and CD133- CD13- HCCLM3, HepG2 and primary HCC cells. i Cell growth curves of CD133+ CD13+and CD133- CD13- HCCLM3 and HepG2 cells with or without SCARB2 deletion. j Representative images of tumorspheres of indicated cells with or without SCARB2 knockout. The number of spheres was counted. Scale bar, 50 μm. k Effect of SCARB2 depletion on sorafenib sensitivity in HCCLM3 and HepG2 cells. The data are a summary of IC50 values for sorafenib. l Representative immunofluorescence images and quantification of the viability of HCC organoids with indicated treatment. Calcein acetoxymethyl (calcein-AM) was used to mark viable cells (green) and ethidium bromide homodimer-1 to mark dead cells (red) (n = 10 organoids per group). Scale bar, 50 μm. m Relative cell viabilities of tumor organoids with or without SCARB2 knockout. n Representative images and quantification of protrusive invasion of HCC organoids. Scale bar, 50 μm. o Flow cytometric analysis of the proportion of CD133, CD13, EpCAM or CD24 positive cells in HCC organoids with or without SCARB2 knockout. p IHC staining of SCARB2 expression in human normal liver tissues and HCC specimens (n = 90 per group). q Kaplan–Meier survival curves for patients with HCC stratified by SCARB2 expression. (g, h, i, j, k, m, n, o) n = 3 biological repeats. Statistical significance was calculated by (g, h, i, j, l, m, n, o, p) two-tailed Student’s t test; (q) two-sided log-rank test; Data are presented as means ± S.E.M. Source data are provided as a Source Data file.
Fig. 2
Fig. 2. SCARB2 deletion reduces the tumor growth and metastasis.
a Scheme used to establish the model of spontaneous HCC with targeted Myc knock-in and Scarb2 knockout in the liver. b Representative photographs (top) and H&E staining (bottom) of intrahepatic tumor tissues in the indicated mice 8 weeks after birth. Scale bar, 1 cm. H&E staining Scale bar, 100 μm. c The liver weights of WT (n = 12 mice), CreAlb Myc (n = 12 mice), CreAlb Scarb2F/+Myc (n = 12 mice) or CreAlb Scarb2F/FMyc mice (n = 6 mice). d Incidence of HCC in CreAlb Myc (n = 11 mice), CreAlb Scarb2F/+Myc (n = 12 mice) or CreAlb Scarb2F/FMyc mice (n = 10 mice). e Kaplan–Meier survival curves for CreAlb Myc (n = 11 mice), CreAlb Scarb2F/+Myc (n = 12 mice) or CreAlb Scarb2F/FMyc mice (n = 10 mice). f The tumor initiation efficiency of HCC cells harvested from indicated group was evaluated by in vivo limiting dilution assay (n = 10 mice per group). g Flow cytometric analysis of the proportion of EpCAM, CD133 or CD24 positive cells in indicated group (n = 3 mice per group). h Scheme used to establish DEN-induced HCC mouse model. i Representative photographs (top) and H&E staining (bottom) of intrahepatic tumor tissue in the indicated mice 8 months after birth. j Liver weights of the CreAlb mice (n = 8 mice) and CreAlb Scarb2F/F mice (n = 8 mice) in DEN-induced HCC mouse model. k Numbers of tumor nodules in the indicated mice (n = 8 mice per group). l Effect of SCARB2 knockout in HCCLM3 cells on tumor growth (n = 8 mice per group). Representative images of tumors (m) and tumor weights (n) in the indicated group (n = 8 mice per group). o–q Effects of SCARB2 knockout in HCCLM3 spheroids on tumor growth, tumor sizes and tumor weights (n = 8 mice per group). r Flow cytometric analysis of the proportion of CD24, EpCAM, CD13, or CD133 positive cells in tumors generated from HCCLM3 spheroids with or without SCARB2 knockout (n = 8 mice per group). Statistical significance was calculated by (c, g, j, k, l, n, o, q, r) two tailed Student’s t test; (d, e) two-sided log-rank test; (f) one-sided extreme limiting dilution analysis. Data are presented as means ± S.E.M. Source data are provided as a Source Data file.
Fig. 3
Fig. 3. SCARB2 deletion inhibits MYC transcriptional activity.
a Approaches for RNA-seq of HCC cells in the indicated groups. b The top Hallmark gene sets enriched in HCC cells from CreAlb Myc mice compared to CreAlbScarb2F/FMyc mice. P value was determined by one-sided permutation test. Statistical adjustments were made for multiple comparisons. c, d GSEA showing the enrichment of MYC target genes in CreAlbScarb2F/FMyc vs CreAlbMyc groups. P value was determined by one-sided permutation test. Statistical adjustments were made for multiple comparisons. e Visualization of SCARB2 positive and negative cells in tumorspheres by UMAP. f The proportion of SCARB2 positive cells in tumorspheres was analyzed by scRNA-seq. g, h Visualization of SCARB2 and MYC target genes expression in tumorspheres by UMAP. i Violin plot showing expression levels of MYC target gene score in SCARB2 positive and negative cells. The tips of the violin plot represent minima and maxima, and the width of violin plot shows the frequency distribution of data. j Correlation expression of MYC target genes and SCARB2 expression in SCARB2 positive cells. Each data point represents the value from an individual cell. k Effects of SCARB2 deletion or overexpression on the transcriptional activity of MYC. l Heatmap showing occupancy of genome-wide MYC peaks in CTRLCas9 and SCARB2Cas9 HCCLM3 cells in a ± 3 kb window surrounding the TSS. m Metagene plots of global MYC occupancy in gene bodies in CTRLCas9 and SCARB2Cas9 HCCLM3 cells. n CUT & tag tracks showing the binding of MYC to CDK4 and SLC2A1 in CTRLCas9 and SCARB2Cas9 HCCLM3 cells. o, p CTRLCas9 and SCARB2Cas9 HCCLM3 cells (o) or HCC cells from CreAlbMyc and CreAlbScarb2F/FMyc mice (p) were analyzed by ChIP with MYC or IgG antibody. ChIP’d DNA was quantified using qPCR for MYC or IgG binding to MYC target genes promoters. q Effect of SCARB2 knockout on the interaction MYC with MAX. Extracts of CTRLCas9 and SCARB2Cas9 HCCLM3 cells were IP anti-MYC Ab and blotted with an anti-MAX Ab. r Colocalization of MYC and MAX in CTRLCas9 and SCARB2Cas9 HCCLM3 cells was detected by the Duolink PLA assay. Data are representative images of MYC/MAX foci (left) and quantification of the number of fluorescent foci (n = 8 cells per group). Scale bar, 5 μm. k, o, p, q, r n = 3 biological repeats. Statistical significance was calculated by (i, k, o, p, r) two tailed Student’s t test; (j) two-sided Pearson’s correlation test; Data are presented as means ± S.E.M. Source data are provided as a Source Data file.
Fig. 4
Fig. 4. SCARB2 disrupt HDAC3-mediated MYC deacetylation through MYC K148 site.
a The effects of SCARB2 deletion on the acetylation of MYC were assessed by Co-IP. b The effects of SCARB2 overexpression on the acetylation of MYC were assessed by Co-IP. c Effects of SCARB2 on the acetylation of MYC K148R mutants. HEK 293 T cells were transfected with the indicated plasmids for 24 h. Cell extracts were IP with an anti-MYC Ab. Acetylated MYC was detected by immunoblotting. d Effect of SCARB2 overexpression on HDAC3-mediated deacetylation. HCCLM3 cells were transfected with the indicated plasmids for 24 h. Cell extracts were IP with an anti-MYC Ab. Acetylated MYC was detected by immunoblotting. e Sequencing verification of the codon replacement by CRISPR-Cas9 resulting in MYC K148R. f Effect of HDAC3 overexpression on acetylation of MYC in MYCWT and MYCK148R HCCLM3 cells. g Effects of the MYC K148R mutation on MYC transcriptional activity in HCCLM3 cells with or without SCARB2 depletion. Data are means ± S.E.M of 3 independent experiments. h MYCWT and MYCK148R HCCLM3 cells were analyzed by ChIP with MYC or IgG antibody. ChIP’d DNA was quantified using qPCR for MYC or IgG binding to MYC target genes promoters, CAD, CDK4, LDHA, NCL, PKM2, HES1, or Chr6 (negative control). i Effects of the K148R mutation on the interaction of MYC with BRD4, KAT5, and GCN5. j Effect of the MYCK148R mutation on the proliferation of HCCLM3 cells with or without SCARB2 depletion. k Effects of the MYCK148R mutation on the sphere-forming ability of HCCLM3 cells with or without SCARB2 depletion. l Schematic showing the role of MYC K148 acetylation in providing a potential docking site for binding with GCN5, KAT5, and BRD4. a, b, c, d, f, g, h, i, j, k n = 3 biological repeats. Statistical significance was calculated by (g, h, j, k) two tailed Student’s t test. Data are presented as means ± S.E.M. Source data are provided as a Source Data file.
Fig. 5
Fig. 5. SCARB2 interacts with MYC to disrupt HDAC3-mediated MYC deacetylation.
a MS analyzed the interaction proteins of SCARB2 in HCCLM3 cells. b The interaction between MYC and SCARB2 in HCCLM3 cells was evaluated by Co-IP assays. c CO-IP analysis of SCARB2 and MYC interaction in the cytoplasm, cytomembrance and nucleus of HCCLM3 cells. d Co-localization of MYC/SCARB2 was detected in HepG2 cells with immunostaining. Scale bar, 5 μm. e The interaction between MYC and HDAC3 in CTRLCas9 and SCARB2Cas9 HCCLM3 cells was evaluated by Co-IP assays. f Co-localization of MYC and HDAC3 was detected in CTRLCas9 and SCARB2Cas9 HepG2 cells by immunostaining. Scale bar, 20 μm. g Mapping of MYC regions binding to SCARB2 and HDAC3. Left: deletion mutants of MYC. Right: HEK 293 T cells were cotransfected with the indicated constructs of MYC (GFP tag) and SCARB2 (Myc tag) or HDAC3 (HA tag). Cell extracts were IP with an anti-Myc Ab or anti-HA Ab. h Mapping of SCARB2 regions binding to MYC. HEK 293 T cells were cotransfected with the indicated constructs of SCARB2 (Myc-tagged) and MYC (Flag-tagged). Cell extracts were IP with an anti-Flag. i HCCLM3 cells treated with or without HDAC3 inhibitor (RGFP966 5μM) were analyzed by ChIP with MYC or IgG antibody. ChIP’d DNA was quantified using qPCR for MYC or IgG binding to MYC target genes promoters, CAD, CDK4, LDHA, NCL, PKM2, HES1, or Chr6 (negative control). j Relative cell viabilities of HCCLM3 SCARB2cas9 cells or HepG2 SCARB2cas9 cells with overexpression of the indicated genes for the indicated times. k Sphere-forming capacity of HCCLM3 SCARB2cas9 cells with overexpression of HDAC3 or HDAC3 R265P mutation. b, c, d, e, f, g, h, i, j, k n = 3 biological repeats. Statistical significance was calculated by (i, j, k) two tailed Student’s t test. Data are presented as means ± S.E.M. Source data are provided as a Source Data file.
Fig. 6
Fig. 6. PMB binds with SCARB2 to suppress HCC by decreasing HDAC3-mediated MYC acetylation and MYC transcriptional activity.
ab Virtual screening of FDA-approved drugs to identify small molecules binding with SCARB2 (a), top 10 hits are listed (b). c The kinetics of the SCARB2-PMB interaction were determined by surface plasmon resonance (SPR) analysis. d The highest scoring docking model of the SCARB2 and PMB complex is shown. Top: surface of the PMB-SCARB2 complex. Bottom: 3D structure of the PMB (yellow)-SCARB2 complex. e The kinetics of the SCARB2-MYC interaction with or without PMB were determined by SPR. f Structured illumination microscopic (SIM) images of vehicle- or PMB- treated HCCLM3 cells (1 h) stained for MYC and SCARB2. Scale bar, 10 μm. g The effect of PMB on the interaction of MYC and SCARB2 was evaluated by Co-IP assays. Extracts of DMSO and PMB-treated HCCLM3 cells were IP with an anti-SCARB2 Ab. h Representative images of MYC/HDAC3 colocalization foci in HCCLM3 cells before and after PMB treatment. Scale bar, 10 μm. i Effect of PMB on MYC acetylation. Extracts of DMSO and PMB-treated HCCLM3 cells were IP with an anti-MYC Ab. Acetylated MYC was detected by immunoblotting. j HCCLM3 cells treated with or without PMB were analyzed by ChIP with MYC or IgG antibody. ChIP’d DNA was quantified using qPCR for MYC or IgG binding to MYC target genes promoters. k Representative images and quantification of tumorspheres formed by HCCLM3 cells with indicated treatment. l Representative images and quantification of the viability of human-derived HCC organoids in 3D culture following the indicated treatment (10 organoids per group). m The frequency of tumor-initiating cells of HCC cells with or without PMB treatment were detected by in vitro limiting-dilution assays (n = 10 per group). no Effects of the MYCK148R mutation on the sphere-forming ability (n) and proliferation (o) of HCCLM3 cells with or without PMB treatment. pq Relative cell viabilities (p) and tumorsphere formation (q) of MYC- or SCARB2-depleted HCCLM3 cells with or without PMB treatment. f, g, h, i, j, k, n, o, p, q n = 3 biological repeats. Statistical significance was calculated by (j, k, l, n, o, q) two tailed Student’s t test; (m) one-sided extreme limiting dilution analysis. Data are presented as means ± S.E.M. Source data are provided as a Source Data file.
Fig. 7
Fig. 7. The combination of PMB with sorafenib synergistically suppresses HCC in CDX and PDX models.
a Representative images of tumors and effects of the indicated treatments on tumor growth in the HepG2, HCCLM3 and Hepa1-6 CDX mouse models (n = 8 mice per group). b Effects of the indicated treatments on tumor weights in the indicated CDX models (n = 8 mice per group). c The tumor formation efficiency of HCC cells harvested from HepG2 and HCCLM3 CDX-derived HCC tumors was evaluated by in vivo limiting dilution assay. (n = 8 mice per group). d Strategy for establishing PDX models from HCC patients. e The expression of MYC and SCARB2 were examined by WB in adjacent and HCC tissues from HCC patient of PDX model. Data are representative images from three independent experiments. f Representative images of tumors in the indicated PDX models (n = 8 mice per group). g Effects of the indicated treatments on tumor growth in the indicated PDX model (n = 8 mice per group). h Effects of the indicated treatments on the tumor weights in the indicated PDX models (n = 8 mice per group). i Flow cytometry analysis for ALDH activity using the ALDEFLUOR kit in PDX model with indicated treatments. j Schematic diagram illustrates that SCARB2 drives hepatic carcinoma initiation by supporting cancer stem cell traits and enhancing MYC transcriptional activity. e, i n = 3 biological repeats. Statistical significance was calculated by (a, b, g, h, i) two tailed Student’s t test; (c) one-sided extreme limiting dilution analysis. Data are presented as means ± S.E.M. Source data are provided as a Source Data file.

References

    1. Sung H, et al. Global cancer statistics 2020: GLOBOCAN estimates of incidence and mortality worldwide for 36 cancers in 185 countries. CA Cancer J. Clin. 2021;71:209–249. doi: 10.3322/caac.21660. - DOI - PubMed
    1. Villanueva A. Hepatocellular carcinoma. N. Engl. J. Med. 2019;380:1450–1462. doi: 10.1056/NEJMra1713263. - DOI - PubMed
    1. Nio K, Yamashita T, Kaneko S. The evolving concept of liver cancer stem cells. Mol Cancer. 2017;16:4. doi: 10.1186/s12943-016-0572-9. - DOI - PMC - PubMed
    1. Saygin C, Matei D, Majeti R, Reizes O, Lathia JD. Targeting cancer stemness in the clinic: From hype to hope. Cell Stem Cell. 2019;24:25–40. doi: 10.1016/j.stem.2018.11.017. - DOI - PubMed
    1. Yoshida M, et al. Sorafenib suppresses extrahepatic metastasis de novo in hepatocellular carcinoma through inhibition of mesenchymal cancer stem cells characterized by the expression of CD90. Sci. Rep. 2017;7:11292. doi: 10.1038/s41598-017-11848-z. - DOI - PMC - PubMed

Publication types