. 2023 Sep 22;14(1):5930.
doi: 10.1038/s41467-023-41666-z.

Epigenomic analysis of formalin-fixed paraffin-embedded samples by CUT&Tag

Affiliations

Epigenomic analysis of formalin-fixed paraffin-embedded samples by CUT&Tag

Steven Henikoff et al. Nat Commun. .

Abstract

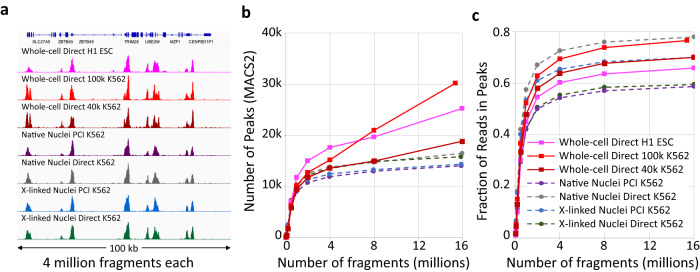
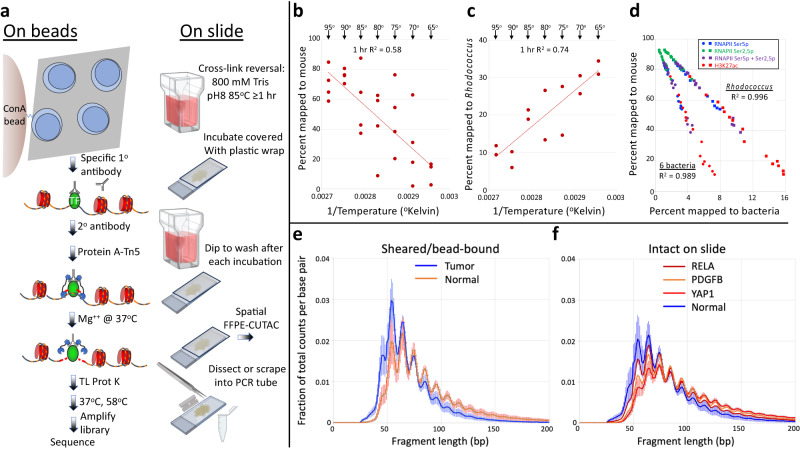
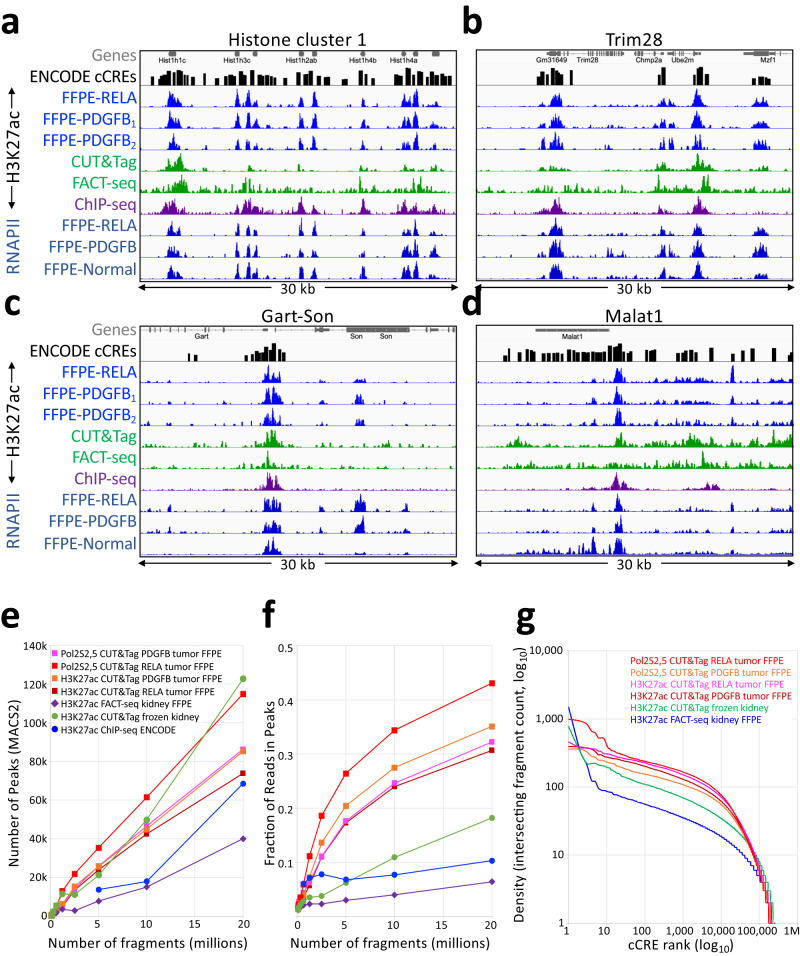
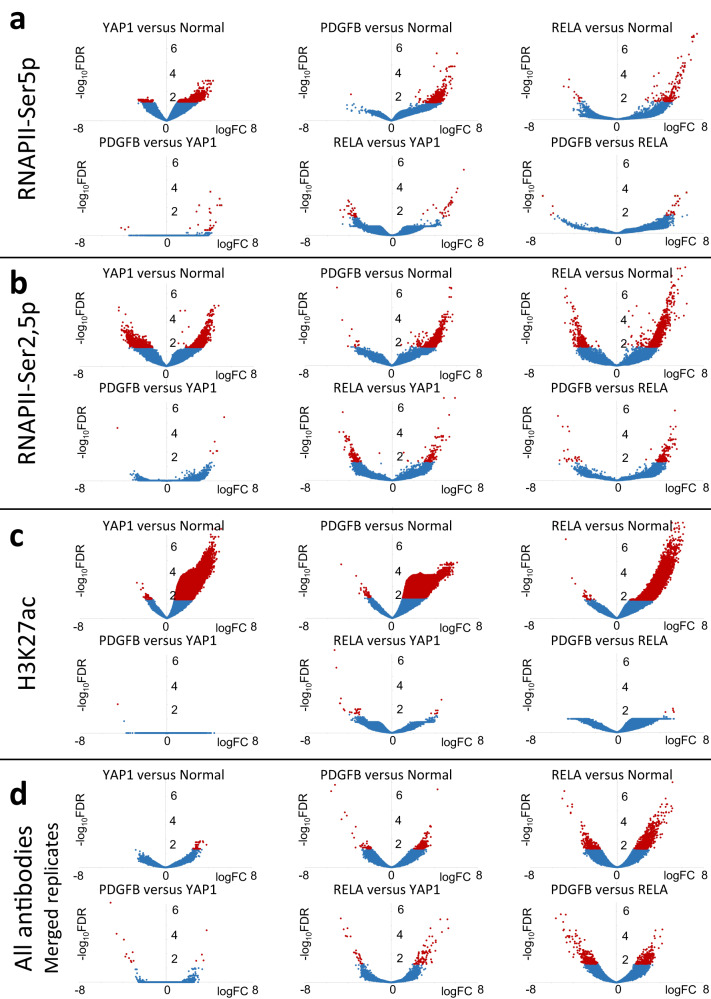
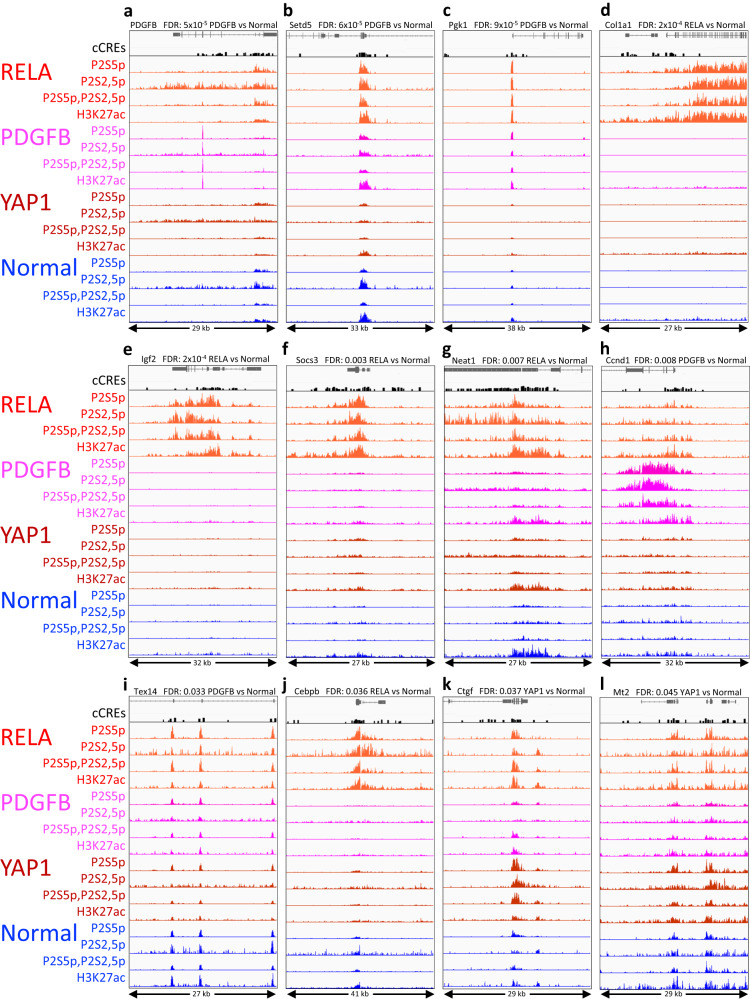
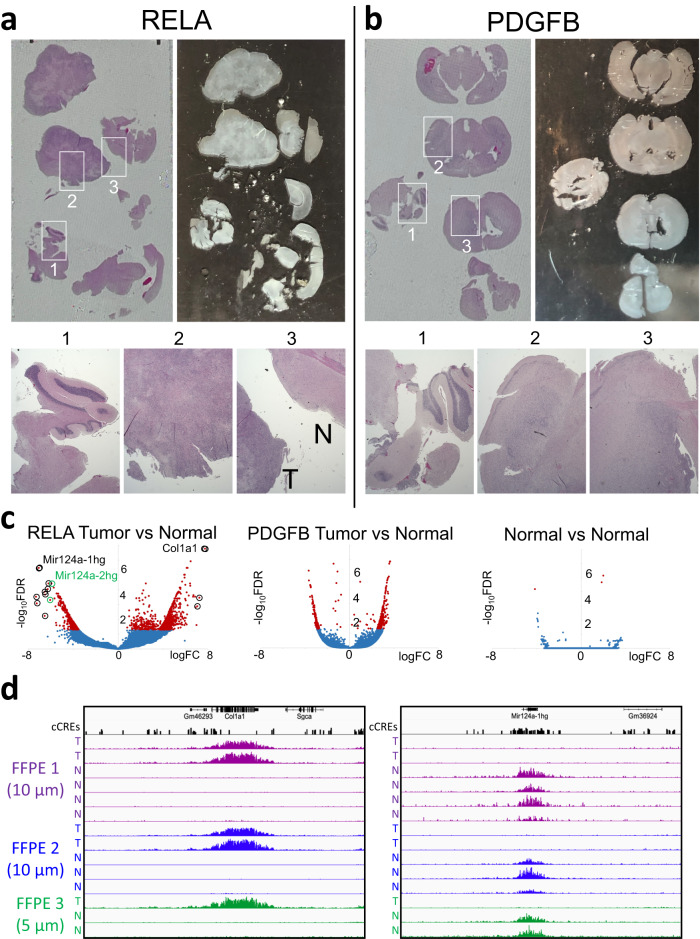
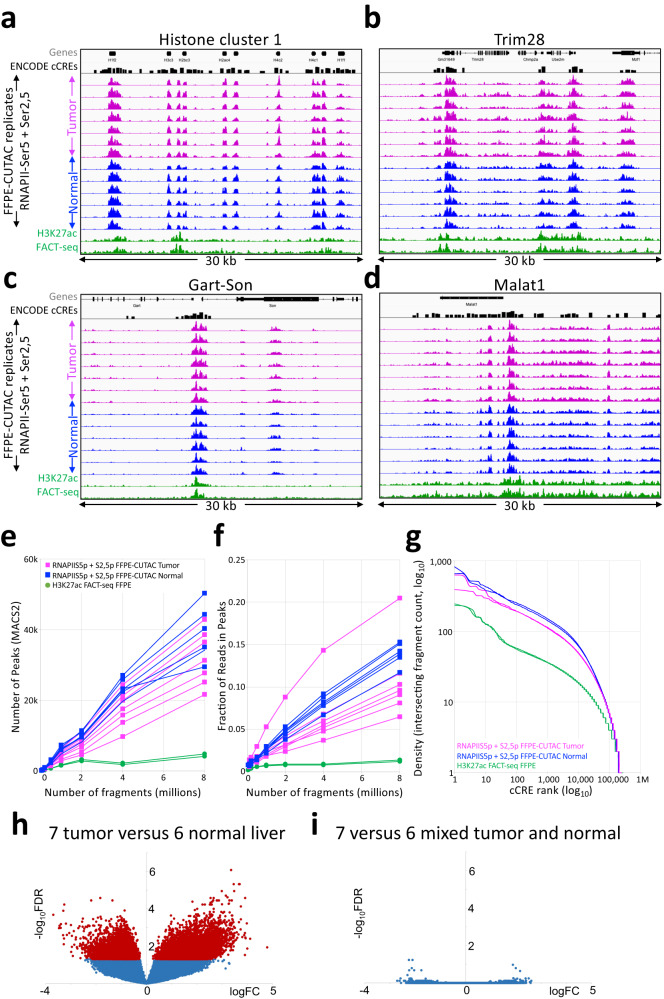
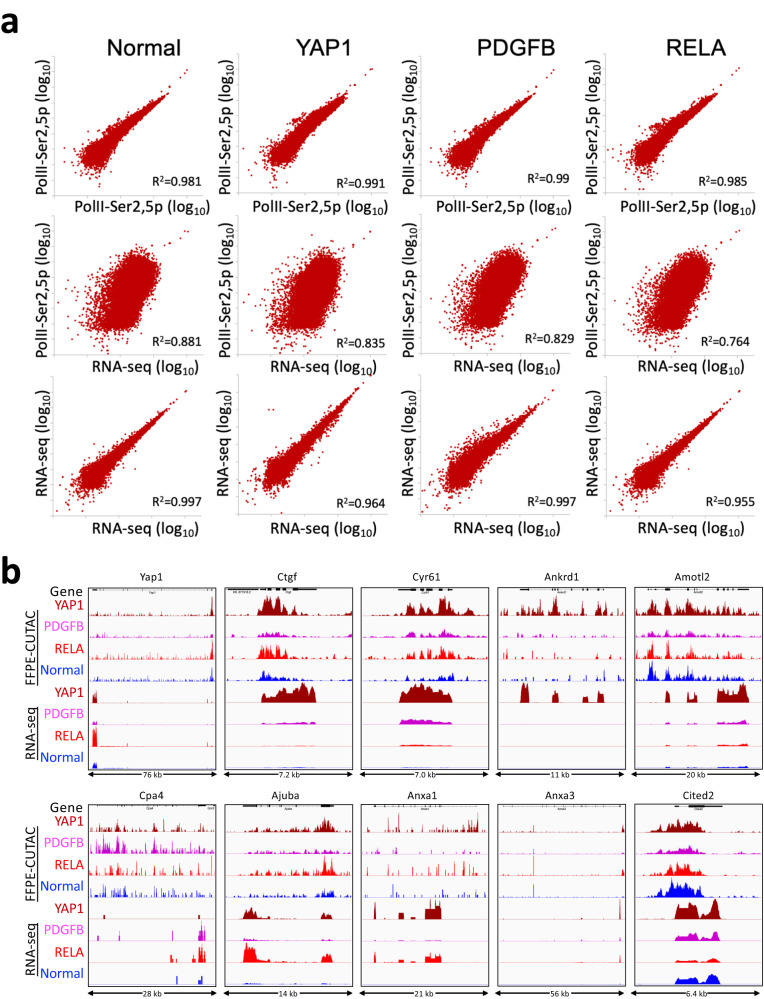
For more than a century, formalin-fixed paraffin-embedded (FFPE) sample preparation has been the preferred method for long-term preservation of biological material. However, the use of FFPE samples for epigenomic studies has been difficult because of chromatin damage from long exposure to high concentrations of formaldehyde. Previously, we introduced Cleavage Under Targeted Accessible Chromatin (CUTAC), an antibody-targeted chromatin accessibility mapping protocol based on CUT&Tag. Here we show that simple modifications of our CUTAC protocol either in single tubes or directly on slides produce high-resolution maps of paused RNA Polymerase II at enhancers and promoters using FFPE samples. We find that transcriptional regulatory element differences produced by FFPE-CUTAC distinguish between mouse brain tumors and identify and map regulatory element markers with high confidence and precision, including microRNAs not detectable by RNA-seq. Our simple workflows make possible affordable epigenomic profiling of archived biological samples for biomarker identification, clinical applications and retrospective studies.


Conflict of interest statement

S.H. is an inventor in a USPTO patent application filed by the Fred Hutchinson Cancer Center pertaining to CUTAC and FFPE-CUTAC (application number 63/505,964). The other authors declare no competing interests.

Figures

Fig. 1
Fig. 1. High data quality from CUT&Tag-direct for whole cells.
a A comparison of H3K4me3 CUT&Tag tracks for human H1 (track 1) and K562 cells (tracks 2–7) at a representative 100-kb region of housekeeping genes. Group-autoscaled profiles for 4 million mapped fragments from each sample are shown. For Whole-cell Direct K562 samples either 100,000 (red) or 40,000 (brown) cells were used. b, c Graphs of Number of Peaks (left) and Fraction of Reads in Peaks (FRiP, right) and color-coded as in (a). Random samples of mapped fragments were drawn, mitochondrial reads were removed and MACS2 was used to call peaks using the narrow peak option. The number of peaks called for each sample is a measure of sensitivity, and FRiP is a measure of specificity calculated for each sampling from 50,000 to 16 million fragments. Nuclei data are from a previously described experiment. Source data are provided as a Source Data file.
Fig. 2
Fig. 2. High temperatures improve yield of small mouse fragments with FFPE-CUTAC.
a Scheme, where TL Prot K is Thermolabile Proteinase K (New England Biolabs). Created with BioRender.com. b Arrhenius plot showing the recovery of fragments mapping to the Mm10 build of the mouse genome as a function of temperature. Deparaffinized FFPEs were scraped into cross-link reversal buffer (20) containing 0.05% Triton-X100, needle-extracted, and divided into PCR tubes for incubation in a thermocycler at the indicated temperatures. c Same as (b) except for fragments mapping to the Rhodococcus erythropolis genome. d Scatter plots and R2 correlations between total fragments recovered versus R. erythropolis and the summed totals for 6 other bacterial species discovered in BLASTN searches of unmapped reads (Escherichia coli, Leifsonia species, Deinococcus aestuarii, Mycobacterium syngnathidarum, Vibrio vulnificus, and Bacillus pumilus). e Comparison of average overall length distributions between tumor and normal brain, combining samples from all 3 brain tumors (YAP1, PDGFB and RELA). RNAPII-Ser5p: 15 samples; RNAPII-Ser2,5p: 15 samples; H3K27ac: 15 samples; 50:50 mixture of RNAPII-Ser5 and RNAPII-Ser2,5p: 14 samples. For each sample, mouse fragment lengths were divided by the total number of fragments before averaging. Lengths are plotted at single base-pair resolution. f Average length distributions for on-slide samples grouped by cancer driver transgene (YAP1: 12 samples; PDGFB: 7 samples; RELA: 12 samples) and Normal brain: 10 samples. Data are presented as mean values +/- SD in (e, f). Source data are provided as a Source Data file.
Fig. 3
Fig. 3. Comparison of H3K27ac FFPE-CUTAC to FACT-seq and CUT&Tag of frozen unfixed samples.
ad IGV tracks showing representative examples of housekeeping gene regions were chosen to minimize the effect of cell-type differences between FFPE-CUTAC (three brain tumors) and published FACT-seq and control CUT&Tag data (kidney). Forebrain H3K27ac ChIP-seq and ATAC-seq samples from the ENCODE project are shown for comparison, using the same number of fragments (20 million) for each sample. Also shown are tracks from FFPE-CUTAC samples using an antibody to RNAPII-Ser2,5p. A track for Candidate cis-Regulatory Elements (cCREs) from the ENCODE project is shown above the data tracks, which are autoscaled for clarity. e, f Number of peaks and Fraction of Reads in Peaks (FRiP) called using MACS2 on samples containing the indicated number of cells. g Cumulative log10 plots of normalized counts from 10 million mapped fragments intersecting cCREs versus log10 rank. Source data are provided as a Source Data file.
Fig. 4
Fig. 4. Volcano plots for pairwise comparisons between FFPE-CUTAC samples.
The Degust server (https://degust.erc.monash.edu/) was used with Voom/Limma defaults to generate volcano plots, where replicates consisted of a mix of samples run in parallel or on different days on FFPE slides from 8 different brain samples (3 Normal, 3 YAP1, 1 PDGFB, 1 RELA). Input for each sample was 10–25% of an FFPE slide, which ranged from ~50,000-100,000 cells per 10-micron section. a Comparisons based on RNAPII-Ser5p using average normalized counts per base-pair for each cCRE, applying the Empirical Bayes Voom/Limma algorithm for pairwise comparisons using the other datasets as pseudo-replicates to increase statistical power. Replicate numbers: Normal: 13; YAP1: 14, PDGFB: 3; RELA: 2. b Same as (a) for RNAPII-Ser2,5p. Replicate numbers: Normal: 5; YAP1: 6; PDGFB: 3; RELA: 3. c Same as (a) for H3K27ac. Replicate numbers: Normal: 10; YAP1: 12; PDGFB: 5; RELA: 7. d Datasets from multiple FFPE-CUTAC experiments for each antibody (RNAPII-Ser5p, RNAPII-Ser2,5p or H3K27ac) or antibody combination (RNAPII-Ser5p + RNAPII-Ser2,5p) were merged, then down-sampled to the same number of mapped fragments for each genotype. These 16 datasets (4 antibodies x 4 genotypes) were compared against each other with Voom/Limma using the other 14 datasets as pseudo-replicates. Top hits FDR < 0.05 (red) are listed in Supplementary Data 5.
Fig. 5
Fig. 5. Top significant differences between tumor and normal and between tumors based on RNAPII-Ser5p FFPE-CUTAC comparisons.
ae IGV tracks centered around the cCREs with the most significant difference across all pairwise comparisons (FDR = 5 × 10−5 − 2 × 10−4). To enrich for regulatory elements within the span of each cCRE, we used the maximum value. fl Tracks centered around the cCRE for each of the strongest signals with FDRs < 0.05, ordered by increasing FDR (0.003–0.045).
Fig. 6
Fig. 6. FFPE-CUTAC distinguishes tumor from normal tissue within the same FFPE section.
a RELA drives well-defined ependymomas where dissection following tagmentation and transfer of whole sections to PCR tubes after RNAPII-Ser5p FFPE-CUTAC post-tagmentation successfully separated tumor from normal tissue with volcano plot results similar to that for RELA versus Normal brains (Fig. 4). b In contrast, PDGFB-driven gliomas are relatively diffuse, and separation of sections post-tagmentation resulted in fewer significant target cCREs. c Left: Volcano plot for FFPE Slide 1 (2 tumor 4 normal sections) using two other slides with 3 tumor and 5 normal sections as pseudo-replicates. Top RELA FFPE hits based on FDR < 0.01 and greatest fold-change are circled and tabulated in (Supplementary Data 6). Middle: Volcano plot for a PDGFB slide (3 tumor, 4 normal). Right: Volcano plot for a normal brain (5 versus 5 replicates). Replicate tracks for the two top upregulated (Col1A1) and down-regulated (Mir124a-1hg) loci are shown, group-autoscaled, where red marks dots with FDR < 0.05. d Tracks for the RELA Tumor-versus-Normal experiments are shown for Col1a1 (left) and Mir124a-1hg (right) color-coded and group-autoscaled for each replicate FFPE slide dissected.
Fig. 7
Fig. 7. FFPE-CUTAC produces high-quality data from liver FFPEs.
ad Representative tracks of liver tumor and normal liver FFPE-CUTAC and FACT-seq samples at the housekeeping gene regions depicted in Fig. 3. A track for Candidate cis-Regulatory Elements (cCREs) from the ENCODE project is shown above the data tracks, which are autoscaled for clarity. e, f Number of peaks and Fraction of Reads in Peaks (FRiP) called using MACS2 on samples containing the indicated number of cells for 7 liver tumor (magenta), 6 normal liver (blue) and 2 normal liver FACT-seq (green) samples. g Cumulative log10 plots of normalized counts intersecting cCREs versus log10 rank for representative liver samples, where red marks dots with FDR < 0.05. h Voom/Limma volcano plot for the 7 liver tumors versus 6 normal liver samples. i Control volcano plot in which three liver tumor samples and 3 normal livers were exchanged for Voom/Limma analysis. Rank-ordered cCREs based on averages are tabulated in Supplementary Data 7. Source data are provided as a Source Data file.
Fig. 8
Fig. 8. Comparisons between FFPE-CUTAC and RNA-seq.
a Top panels: Scatterplots of representative FFPE-CUTAC replicate samples from RNAPII-Ser2,5p for normal brain and the three tumors. Middle panels: Scatterplots of comparisons between the RNAPII-Ser2,5p sample and the corresponding RNA-seq dataset. Lower panel: Scatterplots of RNA-seq datasets used in the comparisons. b Comparisons between FFPE-CUTAC and RNA-seq over Yap1 and previously reported Yap1 direct targets. Tracks were group-autoscaled within modalities. Rank-ordered pairwise comparisons are listed in Supplementary Data 4.

References

    1. Saqi A. The state of cell blocks and ancillary testing: past, present, and future. Arch. Pathol. Lab Med. 2016;140:1318–1322. - PubMed
    1. Blow N. Tissue preparation: tissue issues. Nature. 2007;448:959–963. - PubMed
    1. Armstrong, S. A., Henikoff, S. & Vakoc, C. R. Chromatin Deregulation in Cancer (Cold Spring Harbor Press, 2017).
    1. Amatori S, Fanelli M. The current state of Chromatin Immunoprecipitation (ChIP) from FFPE tissues. Int J. Mol. Sci. 2022;23:1103. - PMC - PubMed
    1. Kaneko S, et al. Genome-wide chromatin analysis of FFPE tissues using a dual-arm robot with clinical potential. Cancers (Basel) 2021;13:2126. - PMC - PubMed

Publication types