Clinical Trial
. 2023 Sep 22;14(1):5914.
doi: 10.1038/s41467-023-40994-4.

Guadecitabine plus ipilimumab in unresectable melanoma: five-year follow-up and integrated multi-omic analysis in the phase 1b NIBIT-M4 trial

Affiliations
Clinical Trial

Guadecitabine plus ipilimumab in unresectable melanoma: five-year follow-up and integrated multi-omic analysis in the phase 1b NIBIT-M4 trial

Teresa Maria Rosaria Noviello et al. Nat Commun. .

Abstract

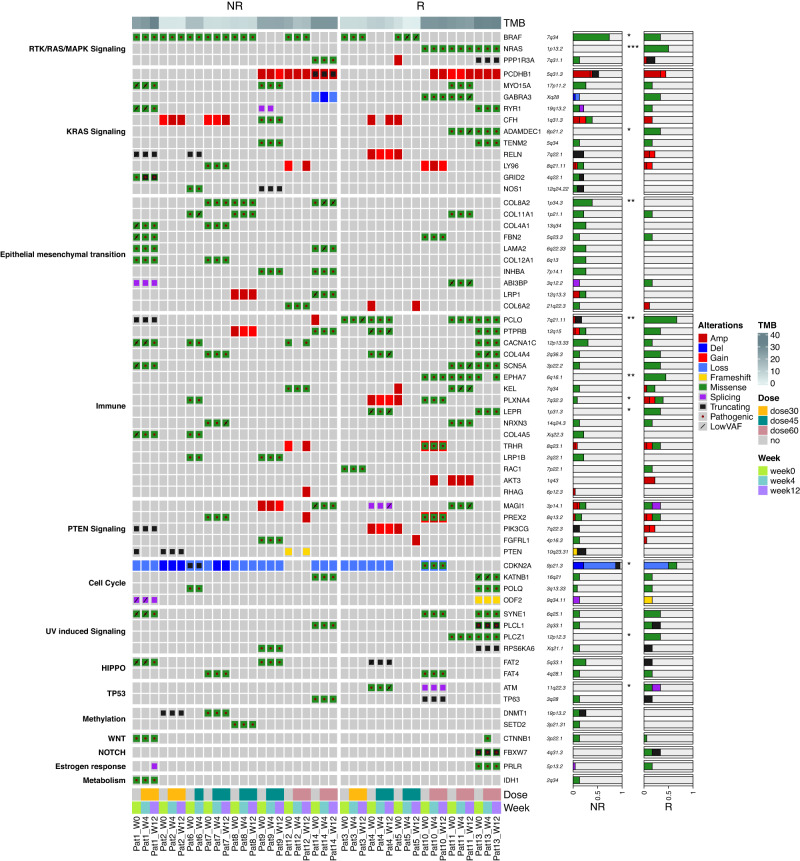
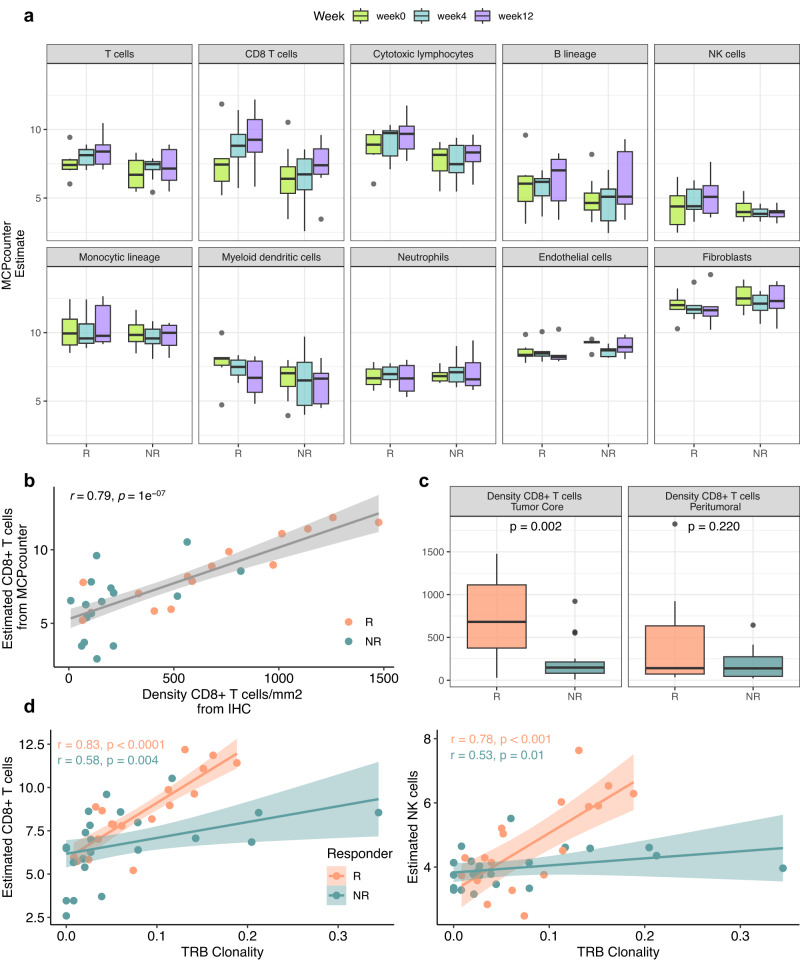
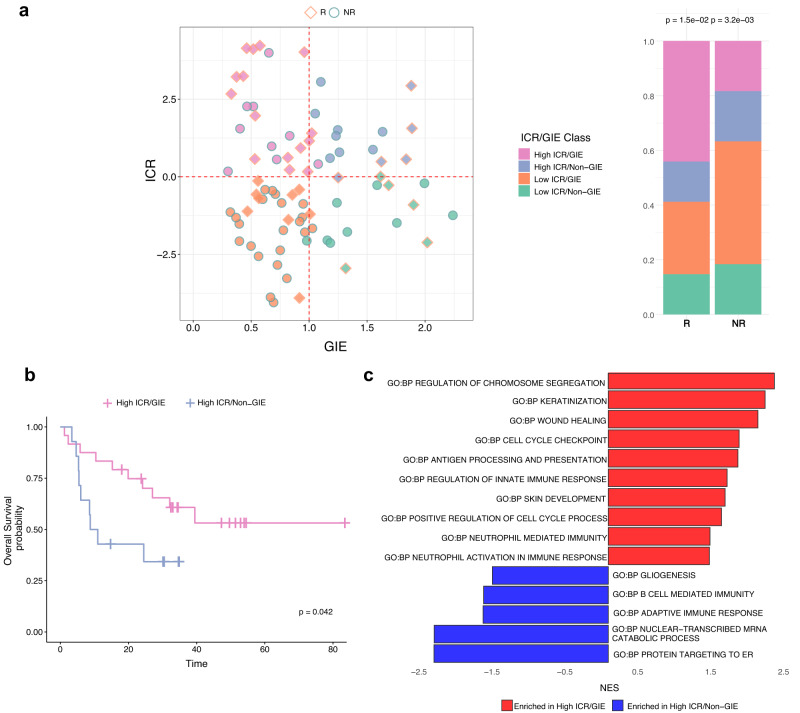
Association with hypomethylating agents is a promising strategy to improve the efficacy of immune checkpoint inhibitors-based therapy. The NIBIT-M4 was a phase Ib, dose-escalation trial in patients with advanced melanoma of the hypomethylating agent guadecitabine combined with the anti-CTLA-4 antibody ipilimumab that followed a traditional 3 + 3 design (NCT02608437). Patients received guadecitabine 30, 45 or 60 mg/m2/day subcutaneously on days 1 to 5 every 3 weeks starting on week 0 for a total of four cycles, and ipilimumab 3 mg/kg intravenously starting on day 1 of week 1 every 3 weeks for a total of four cycles. Primary outcomes of safety, tolerability, and maximum tolerated dose of treatment were previously reported. Here we report the 5-year clinical outcome for the secondary endpoints of overall survival, progression free survival, and duration of response, and an exploratory integrated multi-omics analysis on pre- and on-treatment tumor biopsies. With a minimum follow-up of 45 months, the 5-year overall survival rate was 28.9% and the median duration of response was 20.6 months. Re-expression of immuno-modulatory endogenous retroviruses and of other repetitive elements, and a mechanistic signature of guadecitabine are associated with response. Integration of a genetic immunoediting index with an adaptive immunity signature stratifies patients/lesions into four distinct subsets and discriminates 5-year overall survival and progression free survival. These results suggest that coupling genetic immunoediting with activation of adaptive immunity is a relevant requisite for achieving long term clinical benefit by epigenetic immunomodulation in advanced melanoma patients.


Conflict of interest statement

A.M.D.G. has served as consultant and/or advisor to Incyte, Pierre Fabre, Glaxo Smith Kline, Bristol-Myers Squibb, Merck Sharp Dohme, and Sanofi and has received compensated educational activities from Bristol-Myers Squibb, Merck Sharp Dohme, Pierre Fabre, and Sanofi. W.H.F. has served as consultant and/or advisor to AstraZeneca, Adaptimmune, Catalym, OOSE Immunotherapeutics, and Novartis, and reports receiving speakers bureau honoraria from Bristol-Myers Squibb. MM has served as consultant and/or advisor to Roche, Bristol-Myers Squibb, Merck Sharp Dohme, Incyte, AstraZeneca, Amgen, Pierre Fabre, Eli Lilly, Glaxo Smith Kline, Sciclone, Sanofi, Alfasigma, and Merck Serono; and own shares in Theravance and Epigen Therapeutics, Srl. MC serves as consultant and/or advisor to Moderna Therapeutics and is the founder and owns shares of Immunomica srl. Other authors have nothing to declare.

Figures

Fig. 1
Fig. 1. Swimmer plot analysis of NIBIT-M4 patients.
Swimmer plot showing by study arm patients who at the time of data cutoff were alive and either still on study treatment or off-study therapy, without having received subsequent therapy, and all patients who have received subsequent treatment at the time of data cutoff, regardless of whether alive or dead. Subsequent treatments include immunotherapy (i.e., anti-PD-1 monotherapy or combinations, ICOS agonist or vaccine), BRAFi + MEKi, and chemotherapy.
Fig. 2
Fig. 2. Genomic landscape of the NIBIT-M4 trial.
Oncoplot of frequent somatic nonsynonymous and copy number alterations of NIBIT-M4 trial organized by response (columns, non-responder (NR, n = 8) and responder (R, n = 6) patients) and pathways (rows). Tumor Mutation Burden (TMB), dose (30, 45, and 60 mg/m2/day), and time (week 0, week 4, week 12) of treatments are indicated. The proportion of alterations in NR and R groups is visualized for each gene (p value of two-sided Pearson’s chi-squared test statistic, *p < 0.05, **p < 0.01, ***p < 0.001). Source data are available in Supplementary Data 1.
Fig. 3
Fig. 3. Transcriptional landscape of the NIBIT-M4 trial.
a Gene Set Enrichment Analysis (GSEA, as implemented in clusterProfiler) from supervised differential analysis between R (n = 6) and NR (n = 8) patients (negative binomial generalized linear model with likelihood ratio test (glmLRT), as implemented in EdgeR) before treatment (week 0) and after four (week 4) and twelve (week 12) weeks. x axis reports the aggregated p value of significant enriched GO:BP terms (false discovery rate method from empirical permutation test, FDR < 0.1), computed using Fisher method and classified into seven main categories. Size of the dot represents the number of GO:BP terms grouped into a category; color of the dots represents the mean Normalized Enrichment Score (NES) of the terms. b Volcano plot (left) of differentially expressed genes (p value < 0.05 from glmLRT, as implemented in EdgeR) between R (n = 6) and NR (n = 8) patients, labeled genes belong to the guadecitabine-specific gene signature. x axis reports the effect size (in log scale), y axis reports the −log(p value) from glmLRT, as implemented in EdgeR. GSEA enrichment (right) of the guadecitabine-specific signature on the ranked list of differentially expressed gene at week 4 and week 12. c Same as in b using the dataset from a trial of combined therapy ICI plus HMA from Chen et al. 2022 (C2D8 post-treatment, n = 4 R and n = 5 NR). Source data are provided as a Source Data file.
Fig. 4
Fig. 4. Immune microenvironment.
a Immune microenvironment deconvolution of immune cell fractions stratified by time point and response (n = 6 R and n = 8 NR). b IHC validation (x axis) of the deconvolution of CD8+ T-cell proportion estimated from RNASeq (y axis) (Spearman correlation coefficients rho (r) and associated p values from two-tailed correlation test are provided for R and NR groups, samples from n = 15 R and n = 16 NR). c Density of CD8 T cells by location from IHC in the tumor core (samples from n = 15 R and n = 16 NR), and peritumoral (samples from n = 9 R and n = 13 NR) (p value from two-sided Student’s t test between R and NR groups). d Scatterplot between the T-cell receptor clonality (B locus) and CD8+ T-cell (left) and NK cell abundances (right) (Pearson’s correlation coefficient (r)) and associated p values from two-tailed correlation test are provided for R (n = 6) and NR (n = 8) groups). a, c Box plots show the median as center, the lower and upper hinges that correspond to the 25th and the 75th percentile, and whiskers that extend to the smallest and largest value no >1.5*IQR. Values that stray more than 1.5*IQR upwards or downwards from the whiskers are considered potential outliers and represented with dots. b, d Bands represent confidence intervals (±0.95) around a linear model fitted by robust regression using an M estimator. Source data are provided as a Source Data file.
Fig. 5
Fig. 5. Evolution of the overall methylation pattern in various genomic regions and regulatory regions as function of time between R and NR patients.
a Variation of the overall methylation pattern in Long interspersed nuclear elements (LINEs), Short interspersed nuclear elements (SINEs) and Long terminal repeat (LTR) endogenous retroviral elements (ERV). The increasing or decreasing trend was evaluated based on the inclination of the robust linear regression line between the three time points. Plots report the values at different time points divided between R (n = 6) and NR (n = 8). Box plots show the median as center, the lower and upper hinges that correspond to the 25th and the 75th percentile, and whiskers that extend to the smallest and largest value no more than 1,5*IQR. Values that stray more than 1.5*IQR upwards or downwards from the whiskers are considered potential outliers and represented with dots. b Scatterplot between methylation and expression in R and NR patients in SINE, LINE and LTR elements (Pearson’s correlation coefficient (r)) and associated p values from two-tailed correlation test are provided for R (n = 6) and NR (n = 8) groups). a, b Bands represent confidence intervals (±0.95) around a linear model fitted by robust regression using an M estimator. Source data are provided as a Source Data file.
Fig. 6
Fig. 6. Biomarkers of immunoediting (1).
a Scatterplot of ICR score by Genetic Immunoediting (GIE) score for R (n = 18) and NR (n = 23) samples (left) and their proportion (right) after classification as ICR/GIE classes (p value from two-sided Pearson’s chi-squared test statistic). b Barplot of most significantly (FDR < 0.01) enriched GO:BP terms from GSEA analysis of High-ICR/GIE (n = 15) vs. High-ICR/Non-GIE (n = 9) samples’ comparison. c Kaplan–Meier for OS by patients classified as High-ICR/GIE (n = 5) or High-ICR/Non-GIE (n = 4) at week 12 (top) and R (n = 6) or NR (n = 8) (bottom). Time is indicated in months and censor points are indicated by vertical lines. p values are calculated by log-rank test. Source data are provided as a Source Data file.
Fig. 7
Fig. 7. Biomarkers of immunoediting (2).
Microphotographs of HLA class I and CD8 immunohistochemistry for representative patients in each ICR/GIE class (left). The plots represent the ICR and GIE sample scores, percentages of HLA-positive cells, and density of CD8 T cells. The presented data was derived from one experimental run independently reviewed by three different trained scientists. Source data are provided as a Source Data file.
Fig. 8
Fig. 8. Validation of the ICR/GIE score in patients from other cohorts.
a Scatterplot of ICR score by Genetic Immunoediting (GIE) score for R (n = 34) and NR (n = 49) samples (left) and their proportion (right) after classification as ICR/GIE classes (p value from two-sided Pearson’s chi-squared test statistic). b Kaplan–Meier for OS by patients classified as High ICR/GIE (n = 24) or High-ICR/Non-GIE (n = 14). Time is indicated in months and censor points are indicated by vertical lines. p value is calculated by log-rank test. c Barplot of most significantly (FDR < 0.01) enriched GO:BP terms from GSEA analysis of High-ICR/GIE (n = 24) vs. HighICR/Non-GIE (n = 14) comparison. Source data are provided as a Source Data file.

References

    1. Sharma P, Allison JP. The future of immune checkpoint therapy. Science. 2015;348:56–61. - PubMed
    1. Yang F, et al. Association of sex, age, and eastern cooperative oncology group performance status with survival benefit of cancer immunotherapy in randomized clinical trials: a systematic review and meta-analysis. JAMA Netw. Open. 2020;3:e2012534. - PMC - PubMed
    1. Bhave, P. et al. Efficacy of anti-PD-1 and ipilimumab alone or in combination in acral melanoma. J. Immunother. Cancer10, e004668 (2022). - PMC - PubMed
    1. Paz-Ares L, et al. Durvalumab plus platinum-etoposide versus platinum-etoposide in first-line treatment of extensive-stage small-cell lung cancer (CASPIAN): a randomised, controlled, open-label, phase 3 trial. Lancet. 2019;394:1929–1939. - PubMed
    1. Van Allen EM, et al. Genomic correlates of response to CTLA-4 blockade in metastatic melanoma. Science. 2015;350:207–211. - PMC - PubMed

Publication types

Associated data