. 2023 Sep 22;14(1):5920.
doi: 10.1038/s41467-023-41631-w.

Camel nanobody-based B7-H3 CAR-T cells show high efficacy against large solid tumours

Affiliations

Camel nanobody-based B7-H3 CAR-T cells show high efficacy against large solid tumours

Dan Li et al. Nat Commun. .

Abstract

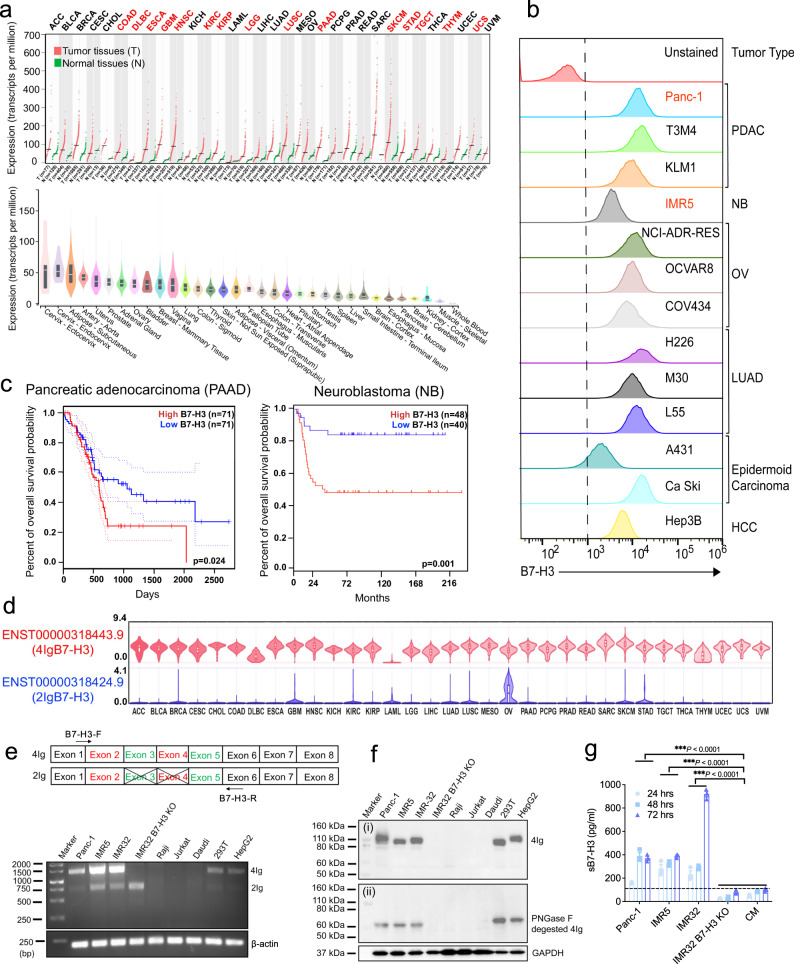
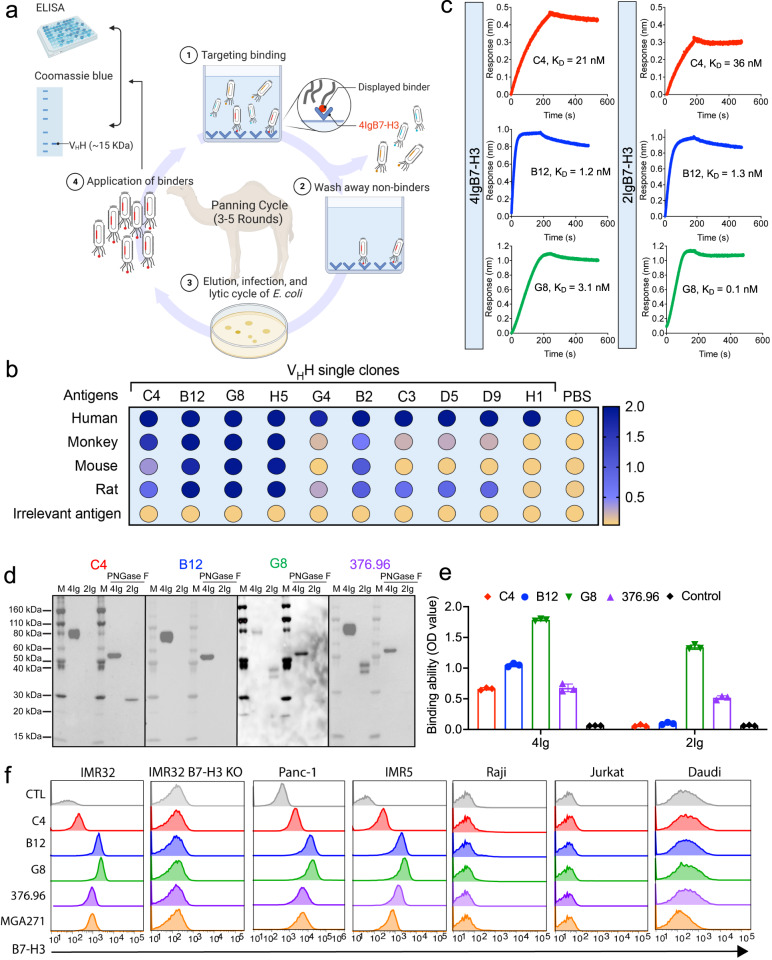
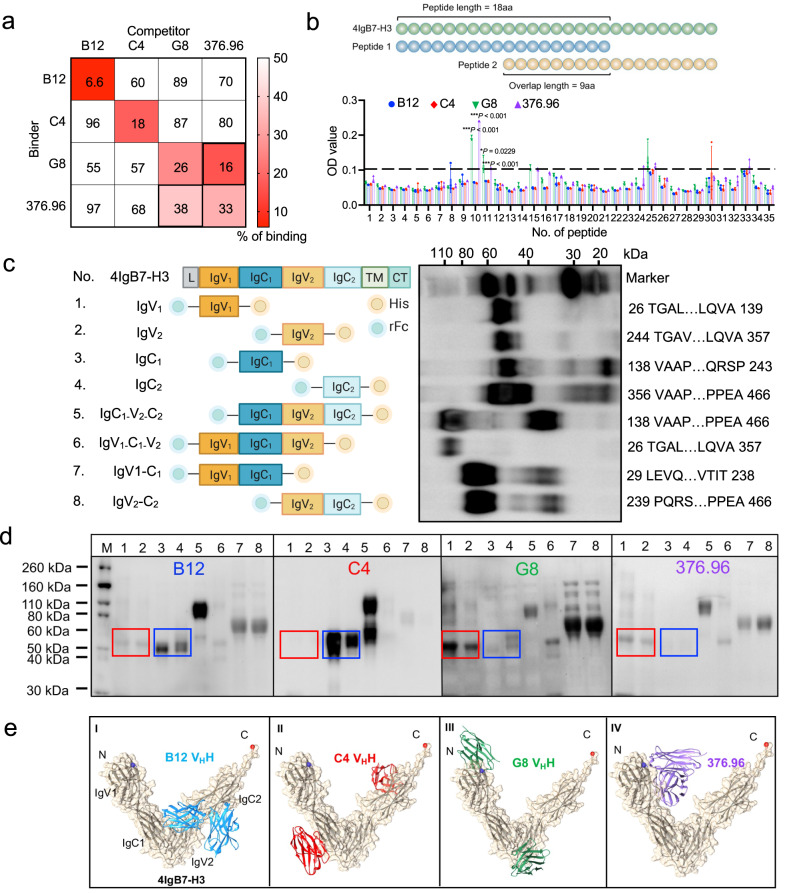
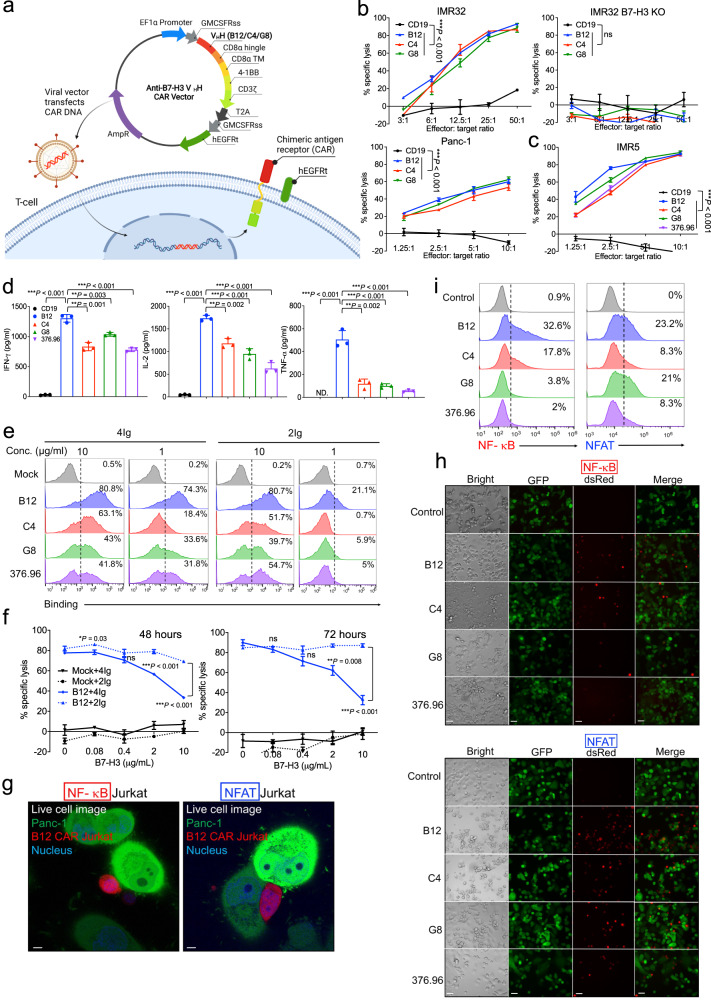
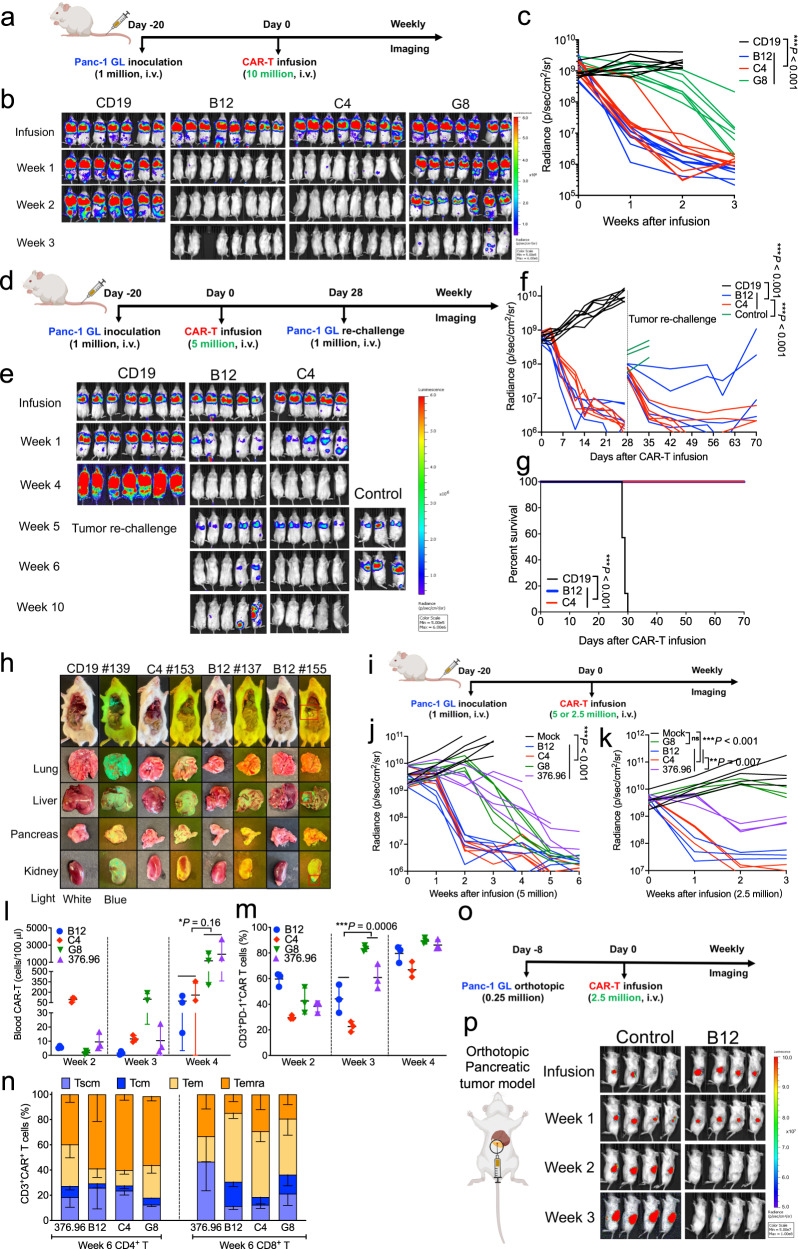
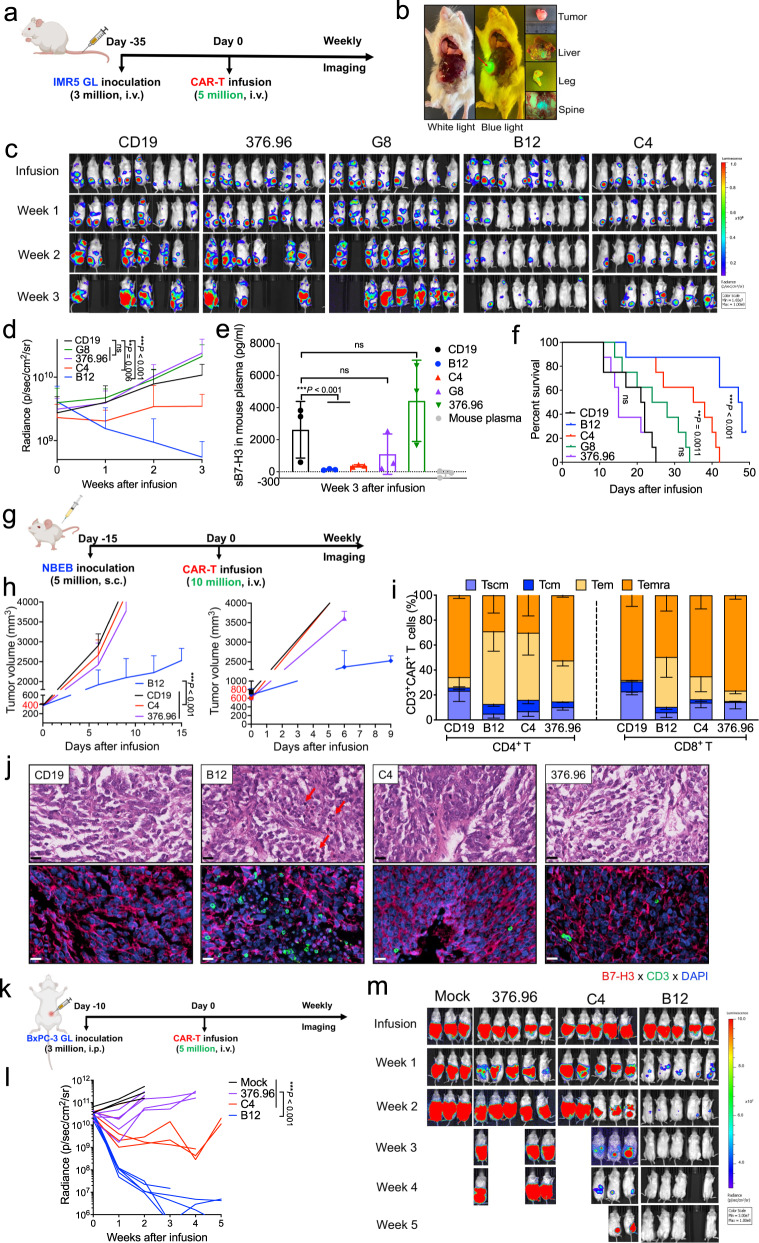
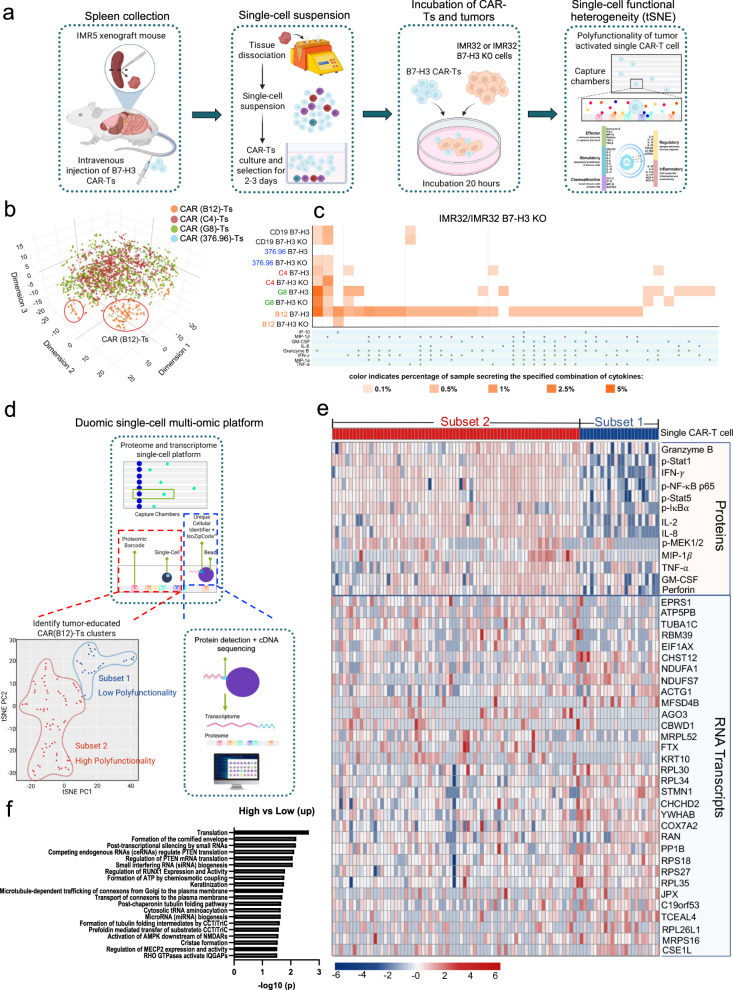
Rational design of chimeric antigen receptor T (CAR-T) cells based on the recognition of antigenic epitopes capable of evoking the most potent CAR activation is an important objective in optimizing immune therapy. In solid tumors, the B7-H3 transmembrane protein is an emerging target that harbours two distinct epitope motifs, IgC and IgV, in its ectodomain. Here, we generate dromedary camel nanobodies targeting B7-H3 and demonstrate that CAR-T cells, based on the nanobodies recognizing the IgC but not IgV domain, had potent antitumour activity against large tumors in female mice. These CAR-T cells are characterized by highly activated T cell signaling and significant tumor infiltration. Single-cell transcriptome RNA sequencing coupled with functional T-cell proteomics analysis uncovers the top-upregulated genes that might be critical for the persistence of polyfunctional CAR-T cells in mice. Our results highlight the importance of the specific target antigen epitope in governing optimal CAR-T activity and provide a nanobody-based B7-H3 CAR-T product for use in solid tumor therapy.


Conflict of interest statement

M.H., R.W., B.S.C., and D.L. are inventors on international patent application no. PCT/US2020/056601 (WO/2021/081052) assigned to the NIH, “High affinity nanobodies targeting B7-H3 (CD276) for treating multiple solid tumors”. W.N., J.Z., and S.M. are employed by and have equity ownership in IsoPlexis. All authors declare no other competing interests.

Figures

Fig. 1
Fig. 1. 4IgB7-H3 is a highly overexpressed dominant isoform in multiple solid cancer types.
a B7-H3 transcripts in tumors and paired normal tissues (dot plot) were analyzed using Gene Expression Profiling Interactive Analysis 2 (GEPIA 2). Red indicates significant upregulation and black shows no difference. The X-axis displays tumor samples (T) in red [log2 (TPM + 1)] and normal samples (N) in green. Four-way ANOVA and LIMMA. The over-expressed gene was defined as log2FC [median (tumor)-median (normal)] > 1, percentage >0.9. The violin plot from Genotype-Tissue Expression (GTEx) depicts B7-H3 expression in diverse human normal tissues. Data were presented as median (mid-line in the plot), [25 percentile (lower bound in the plot), 75 percentile (upper bound in the plot)]. n = 3–1085 individual tissues/group. b Cell surface B7-H3 expression in multiple human solid tumor cell lines. c Kaplan-Meier analysis of overall survival in patients with PDAC and NB with high and low B7-H3 expression from the GEPIA 2 (TCGA and GTEx datasets) and R2 Genomics Analysis and Visualization datasets (TCGA datasets). *P = 0.024, **P < 0.001, Log-rank test. d Distribution boxplots of 4Ig and 2Ig isoforms in various cancer types from GEPIA 2. Data were presented as median (mid-line in the plot), [25 percentile (lower bound in the plot), 75 percentile (upper bound in the plot)] of the log2-transformed normalized B7-H3 expression. n = 26945 independent samples. e Schematic design of a pair of B7-H3-specific primers to distinguish 4Ig and 2Ig isoforms. Reverse transcription-polymerase chain (RT-PCR) reaction of two isoforms and housekeeping gene β-actin in multiple tumor cell lines. 2Ig (2IgB7-H3); 4Ig (4IgB7-H3). n = 4 independent experiments. f Western blot detects B7-H3 protein in tumor cell lysates with or without PNGase F digestion using anti-B7-H3 mAb (D9M2L). n = 4 independent experiments. g Concentration of soluble B7-H3 (sB7-H3) in the cultured tumor cells supernatant over a time course. RPMI culture media (CM) and IMR32 B7-H3 KO cell supernatant represent the negative control. n = 3 independent experiments. ***P < 0.001, two-tailed unpaired Student’s t test. Values represent mean ± SEM. Source data is provided as a Source Data file.
Fig. 2
Fig. 2. Isolation of high-affinity camel nanobody (VHH) against 4IgB7-H3.
a Schematic showing phage panning (created with BioRender.com). The B7-H3-targeted phage binders were isolated from 3–5 rounds of phage panning in eight individual camel phage libraries and further validated by phage ELISA and protein production. b Monoclonal phage ELISA to examine the cross-species reactivity of ten individual anti-B7-H3 phage clones to the antigen of humans, monkeys, mice, and rats. An irrelevant antigen BSA was used as the control. n = 3 independent experiments. c The antigen binding kinetics of VHH-Fc (C4, B12, and G8) to 4Ig or 2Ig proteins via the Octet platform. n = 3 independent experiments. d The interaction between VHH-Fc and 4Ig or 2Ig proteins (with or without PNGase F digestion) via western blot. The anti-B7-H3 mAb 376.96 was used as a control. n = 4 independent experiment. e ELISA to examine the interaction between VHH-Fc and 4Ig or 2Ig proteins. n = 3 independent experiments. Values represent mean ± SEM. f Flow cytometry was performed to monitor the binding capacity of VHH-Fc to cell surface B7-H3 expressed in varying human tumor cell lines. Two anti-B7-H3 mAbs, 376.96 and MGA271, were used as control. n = 4 independent experiments. Source data is provided as a Source Data file.
Fig. 3
Fig. 3. Epitope prediction of anti-B7-H3 nanobodies.
a Cross-competition assay of VHH-Fc and 376.96 mAb to the 4Ig antigen on Octet. b Epitope mapping of individual VHH-Fc and 376.96. Schematic design for constructing a peptide array of 4Ig (total of 35 peptides). Each peptide is 18 amino acids (aa) in length, and every two junctions overlap by 9 aa. ELISA was performed to examine the binding epitope of antibodies. The baseline (dotted line) was set up at OD = 0.11 based on the binding signal. n = 3 independent experiments. Values represent mean ± SEM. ***P < 0.001, *P = 0.0229, two-tailed unpaired Student’s t test. c Diagram of the truncated 4Ig fragments, with N-terminal rabbit Fc (rFc) and C-terminal His tag, is indicated on the left side, and the results of western blot using anti-His-HRP antibody are shown on the right side. The truncated amino acid position, which is based on the full-length 4IgB7-H3, is shown as a number in the diagram of domain structure. n = 3 independent experiments. d Interaction between VHH-Fc (or 376.96) and individual 4Ig fragment by western blot. The recognition of antibodies to IgV1 (No. 1) and IgV2 (No. 2) was in a red rectangle, and the blue rectangle highlighted IgC1 (No. 3) and IgC2 (No. 4). n = 3 independent experiments. e The complex structure models of 4IgB7-H3 and VHH (B12, C4, G8) or scFv of 376.96. Source data is provided as a Source Data file.
Fig. 4
Fig. 4. B7-H3 nanobody-based CAR-T cells effectively lysed PADC and NB cells in vitro.
a Schematic showing B7-H3 CAR-T design and production (created with BioRender.com). Lentiviral vectors encode CAR and hEGFRt via a T2A ribosomal skipping sequence, leading to CAR expression on the T cell surface. b Cytolytic activity of B7-H3 CAR-T and CD19 CAR-T against IMR32, IMR32 B7-H3 KO, and Panc-1 cells, at various E/T ratios for 24 hours incubation. n = 3 independent experiments. Values represent mean ± SEM. ***P < 0.001, ns P > 0.05, two-tailed unpaired Student’s t test. c Cytolytic activity of B7-H3 CAR-T cells against IMR5 cells at various E/T ratios for 24 hours of incubation. 376.96 represent 376.96(scFv)-CAR-T cells. n = 3 independent experiments. Values represent mean ± SEM. ***P < 0.001, two-tailed unpaired Student’s t test. d B7-H3 CAR-T cytokine release (IFN-γ, IL-2, and TNF-α) upon co-culture with IMR5 cells. n = 3 independent experiments. Values represent mean ± SEM. **P < 0.01, ***P < 0.001, two-tailed unpaired Student’s t test. e B7-H3 CAR-T binding to recombinant human 4Ig and 2Ig protein. n = 3 independent experiments. f 4Ig protein inhibited B12(VHH)-CAR-T killing on Panc-1 cells for 48 hours and 72 hours incubation. ns, not significant. n = 3 independent experiments. Values represent mean ± SEM. *P = 0.03, **P = 0.08, ***P < 0.001, ns P > 0.05, two-tailed unpaired Student’s t test. g Live cell imaging of B12(VHH)-CAR-Jurkat NF-κB/NFAT reporter tdTomato cells (dsred) and GFP (green) overexpressing Panc-1 cells by confocal microscopy at five hours incubation. The nucleus was labeled by Hoechst (blue). Scale bar, 5 μm. n = 3 independent experiments. h Confocal microscopy of CAR-Jurkat reporter cells upon interacting with Panc-1 GL cells at five hours incubation. Cell images at 20x magnification. Scale bar, 50 μm. n = 3 independent experiments. i Quantitative percentage of activated CAR-Jurkat reporter cells by flow cytometry. All stimulated CAR-Jurkat reporter cells from each whole well were harvested for flow cytometry. Three biological replicate experiments were performed. CAR-T cells were from donor #076’s PBMC. Source data is provided as a Source Data file.
Fig. 5
Fig. 5. B7-H3 nanobody-based CAR-T cells exhibit superior persistent antitumor activity against human pancreatic cancer in mice.
a Experimental schema of the Panc-1 metastasis xenograft mouse model (created with BioRender.com). n = 7/8 mice/group. b, c Representative tumor bioluminescence images of mice b and tumor growth curve c measured by bioluminescence. n = 7/8 mice/group. ***P < 0.001, two-tailed unpaired Student’s t test. d Experimental schema of the Panc-1 metastasis xenograft mouse model under tumor-rechallenge (created with BioRender.com). n = 5/7 mice/group. Three mice were used as the control. e, f Representative tumor bioluminescence images of mice e and tumor growth curve f. n = 5/7 mice/group. ***P < 0.001, two-tailed unpaired Student’s t test. g Kaplan-Meier survival curve post-CAR-T cells infusion. ***P < 0.001, Log-rank test. h Tumor metastasis images in mice infused with CD19 or B7-H3 CAR-T cells. Mouse tissues and tumors (GFP) were visualized by the white and UV/blue light, respectively. i Dose-dependent effects of B7-H3 CAR-T cells in the Panc-1 metastasis mouse model (created with BioRender.com). n = 3/5 mice/group. j, k Tumor bioluminescence growth curve with 5 million (j) or 2.5 million (k) B7-H3 CAR-T cells. **P = 0.007, ***P < 0.001, two-tailed unpaired Student’s t test. l Absolute CAR-T count from 100 μl blood was identified in mouse peripheral blood after week 2/3/4 of infusion. n = 3 individual samples/group. Values represent mean ± SEM. *P = 0.16, two-tailed unpaired Student’s t test. m PD-1 expression in circulated CD3+CAR-T cells at week 2/3/4 of infusion. n = 3 individual samples/group. Values represent mean ± SEM. ***P = 0.0006, two-tailed unpaired Student’s t test. n Distribution of memory subsets in CD4+/CD8+ CAR+-T cell subpopulations at week 6 of infusion. n = 3 individual samples/group. Values represent mean ± SEM. o Experimental schema of the Panc-1 orthotopic mouse model (created with BioRender.com). n = 4 mice/group. p Tumor bioluminescence images of orthotopic Panc-1 mice (created with BioRender.com) in the CAR-T treatment groups. CAR-T cells from donor #076’s PBMC. Source data is provided as a Source Data file.
Fig. 6
Fig. 6. B12(VHH)-CAR-T cells inhibited metastatic and large tumor growth in xenografts.
a Experimental schema of IMR5 metastasis xenograft mouse model (created with BioRender.com). n = 8 mice/group. b Representative IMR5 tumor image. (c-d) Tumor bioluminescence images c and tumor growth curve d for CAR-T treatment groups. n = 8 mice/group. ns, not significant. Values represent mean ± SEM. **P = 0.006, ***P < 0.001, ns P > 0.05, two-tailed unpaired Student’s t test. e Plasma sB7-H3 levels in IMR5 mice after three weeks of CAR-T infusion. n = 3 individual samples/group. ns, not significant. Values represent mean ± SEM. ***P < 0.001, ns P > 0.05, two-tailed unpaired Student’s t test. f Kaplan–Meier survival curve of IMR5 mice post-CAR-T infusion. ***P < 0.001, ns P > 0.05, Log-rank test. g Experimental schema of the subcutaneous NBEB xenograft mouse model (created with BioRender.com). Two groups of mice, including one with tumor volume at ≈400 mm3 (n = 5 mice/group) and another with tumor volume at ≈600–800 mm3 (n = 2 mice/group). h The respective tumor growth curves of two groups of mice infused with CAR-T cells. n = 5 or 2 mice/group. Values represent mean ± SEM. ***P < 0.001, two-tailed unpaired Student’s t test. i CD4+/CD8+ CAR+-T cell immunophenotypes post-infusion. n = 3 individual samples/group. Values represent mean ± SEM. j CAR-T cell infiltration in NBEB tumor tissues on day 9 post-infusion was analyzed through H&E and IF sections. Positive staining was quantified using anti-CD3 mAb (green) and anti-B7-H3 mAb (red). DAPI staining marked nuclei. Arrows indicate apoptotic cells. Scale bar, 20 μm. n = 3 independent experiments. k Experimental schema of the large BxPC-3 xenograft mouse model (created with BioRender.com). n = 3/5 mice/group. lm Tumor growth curve (l) and representative tumor bioluminescence images of mice (m) upon CAR-T treatment. CAR-T cells from donor #076’s PBMC. Statistical analyses are shown from more than three individual samples. Values represent mean ± SEM. ***P < 0.001, two-tailed unpaired Student’s t test. Source data is provided as a Source Data file.
Fig. 7
Fig. 7. Single-cell-based polyfunctional analysis of persistent CD4+ B12(VHH)-CAR-T cells by proteomics and transcriptomics expression.
a Flowchart of the persistent B7-H3 CAR-T cells polyfunctionality platform (created with BioRender.com). B7-H3 CAR-T cells were isolated from IMR5 xenograft mouse spleens followed by tumor cells (IMR32 or IMR32 B7-H3 KO) incubated for 20 hours ex vivo. These antigen-reactivated single-cell-based B7-H3 CAR-T cells were loaded into the 32-plex panel polyfunctionality capture platform, including cytokines/chemokines belonging to 5 groups: effector, stimulatory, chemoattractive, regulator, and inflammatory. b The t-distributed stochastic neighbor embedding (tSNE) plots demonstrated clustering obtained from 30,000 distinct long-persistent CD4+ B7-H3 CAR-T cells from IMR5 xenograft mouse spleens using the 32-plex panel polyfunctionality capture platform. c Polyfunctional heat map displaying major functional cytokines/chemokines secreted across long-persistent CD4+ B7-H3 CAR-T cells upon IMR32 and IMR32 B7-H3 KO stimulation from (a). d Flowchart of the Duomic single-cell multi-omic platform of long-persistent B12(VHH)-CAR-T cells, which were identified into two clusters, subset 1-high polyfunctionality (72 single-cells) and subset 2-low polyfunctionality (23 single-cells). e The matched expression file of proteins and RNA transcripts in each single B12(VHH)-CAR-T cell in either high or low polyfunctional B12(VHH)-CAR-T subsets isolated from the Duomic platform. Transcriptomics expression profile of 32 candidate genes showed statistically significant expression differences (P < 0.05) between the high and low polyfunctional subsets. f REACTOME pathway analysis of unique genes in (e). The CAR-T cells used in this figure were produced using donor #076’s PBMC.

References

    1. June CH, Sadelain M. Chimeric antigen receptor therapy. N. Engl. J. Med. 2018;379:64–73. - PMC - PubMed
    1. Castellarin M, Watanabe K, June CH, Kloss CC, Posey AD. Driving cars to the clinic for solid tumors. Gene Ther. 2018;25:165–175. - PubMed
    1. Majzner RG, et al. CAR T cells targeting b7-h3, a pan-cancer antigen, demonstrate potent preclinical activity against pediatric solid tumors and brain tumors. Clin. Cancer Res. 2019;25:2560–2574. - PMC - PubMed
    1. Crispen PL, et al. Tumor cell and tumor vasculature expression of B7-H3 predict survival in clear cell renal cell carcinoma. Clin. Cancer Res. 2008;14:5150–5157. - PMC - PubMed
    1. Seaman S, et al. Eradication of tumors through simultaneous ablation of cd276/b7-h3-positive tumor cells and tumor vasculature. Cancer Cell. 2017;31:501–515.e508. - PMC - PubMed

Publication types