. 2023 Sep 22;14(1):5919.
doi: 10.1038/s41467-023-41672-1.

Acetylation discriminates disease-specific tau deposition

Affiliations

Acetylation discriminates disease-specific tau deposition

Pijush Chakraborty et al. Nat Commun. .

Abstract

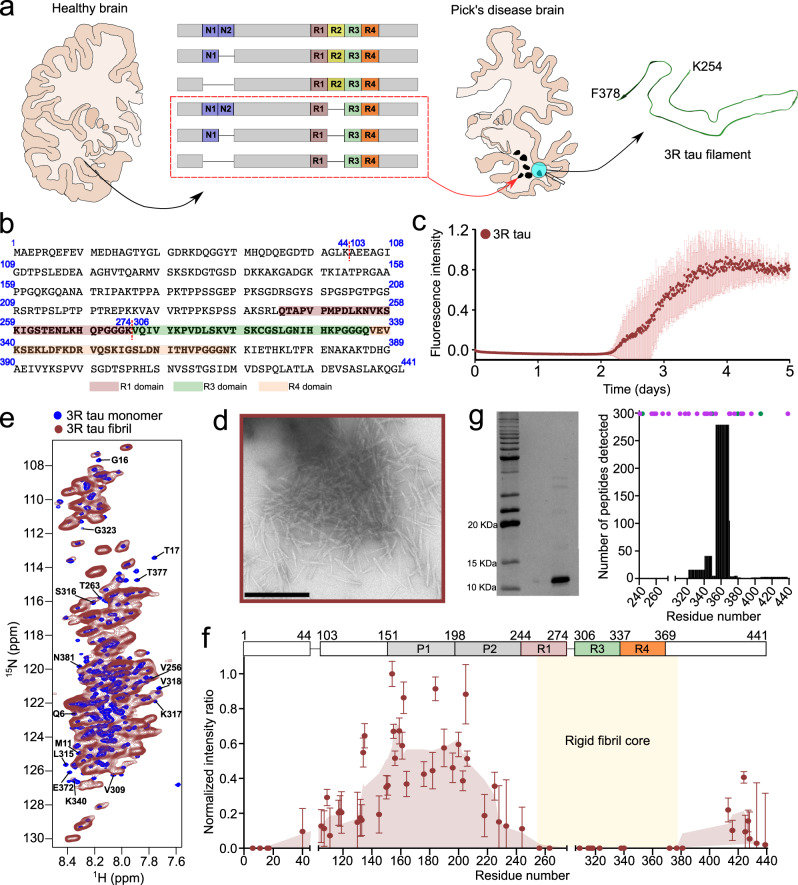
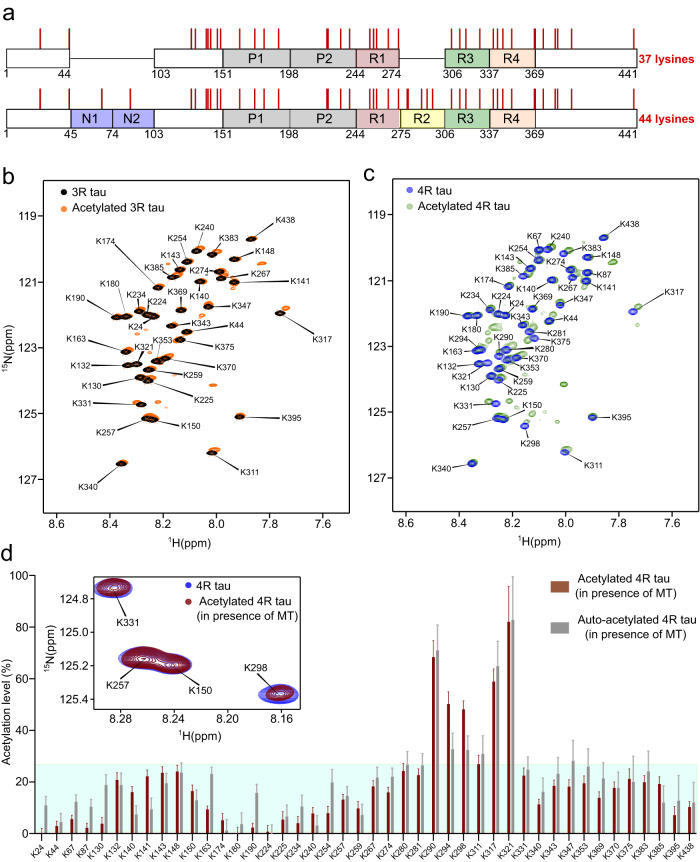
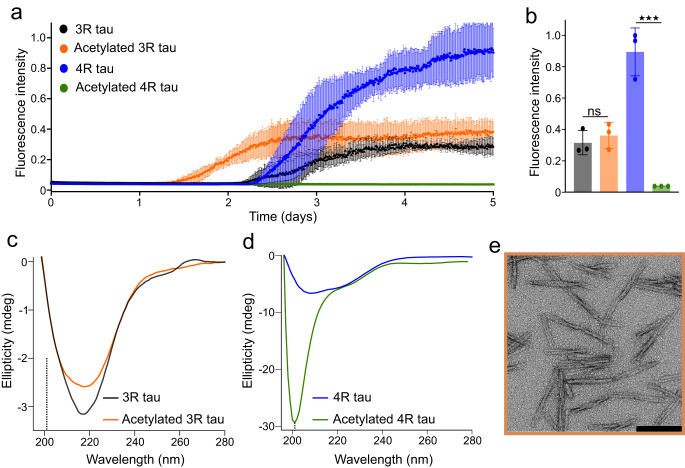
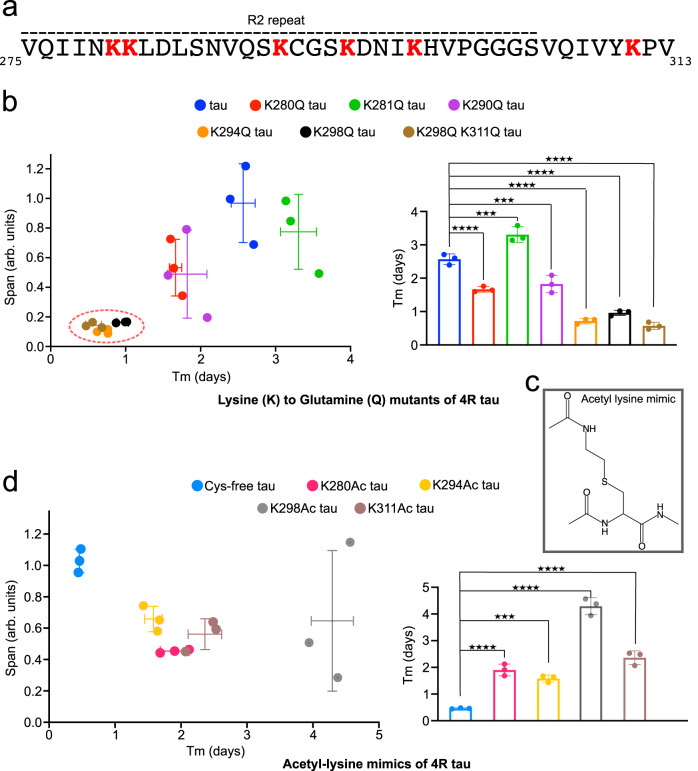
Pathogenic aggregation of the protein tau is a hallmark of Alzheimer's disease and several other tauopathies. Tauopathies are characterized by the deposition of specific tau isoforms as disease-related tau filament structures. The molecular processes that determine isoform-specific deposition of tau are however enigmatic. Here we show that acetylation of tau discriminates its isoform-specific aggregation. We reveal that acetylation strongly attenuates aggregation of four-repeat tau protein, but promotes amyloid formation of three-repeat tau. We further identify acetylation of lysine 298 as a hot spot for isoform-specific tau aggregation. Solid-state NMR spectroscopy demonstrates that amyloid fibrils formed by unmodified and acetylated three-repeat tau differ in structure indicating that site-specific acetylation modulates tau structure. The results implicate acetylation as a critical regulator that guides the selective aggregation of three-repeat tau and the development of tau isoform-specific neurodegenerative diseases.


Conflict of interest statement

The authors declare no competing interests.

Figures

Fig. 1
Fig. 1. Co-factor-free aggregation of 3R tau.
a Schematic representation of the specific deposition of 3R tau in Pick’s disease. In the healthy brain, all six isoforms of tau are present whereas in Pick’s disease brain only 3R isoforms of tau (red box) are deposited. The structure of the tau filament extracted from the brain of a Pick’s disease patient (PDB code: 6GX5) is shown. b Amino acid sequence of 0N3R tau. The amino acids are numbered based on the sequence of 2N4R tau. The pseudo-repeat domains R1, R3, and R4 are highlighted in light red, green, and orange, respectively. c Fibrillization kinetics of 3R tau (25 µM) in the absence of co-factors. Error bars represent std of n = 3 independent samples. The center of the error bars represents the average value of n = 3 independent samples. Source data are provided as a Source data file. d Negative-stain electron micrographs of 3R tau fibrils. Scale bar, 500 nm. The micrograph is representative of n = 3 biological replicates. e, f NMR analysis of the rigid core of 3R tau fibrils. Superposition of the 1H-15N HSQC spectrum of monomeric 3R tau (blue, e) with 1H-15N J-transfer MAS spectra of 3R tau fibrils (red, e). Assignments of residues broadened beyond detection in the fibrils are displayed. Residue-specific intensity ratios derived from (e) are shown in (f). Errors in intensity ratios were calculated from the signal-to-noise ratio of the cross-peaks in the respective spectra. Smoothed data are shown in light brown. Residues resolved in the cryoEM structure of tau fibrils extracted from the brain of a patient with Pick’s disease (PDB code: 6GX5) are indicated by yellow shading. Source data are provided as a Source data file. g Protease digestion of 3R tau fibrils. SDS-PAGE gel of pronase-digested 3R tau fibrils. The protease digestion experiment has been performed up to 3 times with similar result. Numbers of detected peptides are shown to the right. The position of lysine and arginine residues are marked with purple and green dots, respectively. Source data are provided as a Source data file.
Fig. 2
Fig. 2. Single-residue analysis of tau acetylation.
a Domain diagram of 3R and 4R tau. Lysines are indicated by red bars. The total numbers of lysine residues present in 0N3R tau and 2N4R tau are indicated. b, c Superposition of the 1H-15N HSQC spectra of unmodified lysine-labeled 3R tau (b; 50 µM; black) or 4R tau (c; 50 µM; blue) and the corresponding acetylated proteins (b: orange; c: green). Acetylation was performed by incubation with both p300 and CBP for 12 h. d Analysis of acetylation levels of individual lysine residues of 4R tau after acetylating with either both p300 and CBP (brown), or in the absence of any acetyltransferases (auto-acetylation) (gray) for 2 h in the presence of microtubules. Errors in acetylation levels were calculated from the signal-to-noise ratio of the cross-peaks in the NMR spectra. The cyan box represents a 25% cut-off for weakly acetylated lysine residues. The inset displays a superposition of a selected region of the 1H-15N HSQC spectra of unmodified lysine-labeled 4R tau (blue) and acetylated 4R tau (in presence of microtubules) (brown). Source data are provided as a Source data file.
Fig. 3
Fig. 3. Acetylation accelerates 3R tau but strongly attenuates 4R tau fibrillization.
a Fibrillization kinetics of unmodified 3R (black) and 4R (blue) tau, as well as acetylated 3R (orange) and 4R (green) tau followed by ThT fluorescence. Acetylation reactions were performed in the presence of p300/CBP. Protein concentrations were 25 µM. Error bars represent std of n = 3 independent samples. The center of the error bars represents the average value of n = 3 independent samples. The ThT fluorescence experiment of both acetylated 3R and 4R tau has been performed up to 5 times with 3 different batches of tau. Before performing each of the ThT fluorescence experiments, the acetylation reaction has been performed independently. In all cases the data were reproducible. Source data are provided as a Source data file. b Final ThT intensity of unmodified 3R (black) and 4R (blue) tau, as well as acetylated 3R (orange) and 4R (green) tau after five days of aggregation. Acetylation reactions were performed in the presence of p300/CBP. Statistical analyses were performed by two-tailed Welch’s t test (***p = 0.006). Error bars represent std of n = 3 independent samples. The center of the error bars represents the average value of n = 3 independent samples. Source data are provided as a Source data file. c CD spectra of unmodified (black) and acetylated (orange) 3R tau after five days of aggregation. The location of the minimum expected for random coil structure is marked by a dotted line. Source data are provided as a Source data file. d CD spectra of unmodified (blue) and acetylated (green) 4R tau after five days of aggregation. Source data are provided as a Source data file. e Negative-stain EM of acetylated 3R tau fibrils. The micrograph is representative of n = 3 biological replicates. Scale bar, 200 nm.
Fig. 4
Fig. 4. K298 acetylation delays 4R tau fibrillization.
a Amino acid sequence of the R2 repeat and the beginning of repeat R3 of tau. Lysine residues are shown in red. b Impact of lysine-to-glutamine mutation in repeat R2/R3 on 4R tau fibrillization. (left) ThT intensity span vs. half-time of aggregation (Tm). Error bars represent std of n = 3 independently aggregated samples. The center of the error bars represents the average value of n = 3 independent samples. (right) Half-time of aggregation (Tm) of different lysine-to-glutamine tau mutants; statistical analysis by one-way ANOVA: ****p < 0.0001/***p = 0.003. Error bars represent std of n = 3 independent samples. The center of the error bars represents the average value of n = 3 independent samples. Source data are provided as a Source data file. c, d Aggregation kinetics of cysteine-free 4R tau acetylated at single lysine-mimic residues. This lysine acetylation mimic differs only by the presence of a sulfur atom in place of the Cγ of lysine (c). Error bars represent std of n = 3 independently aggregated samples. The center of the error bars represents the average value of n = 3 independent samples. Statistical analysis by one-way ANOVA: ****p < 0.0001/***p = 0.003. Source data are provided as a Source data file.
Fig. 5
Fig. 5. Structural characterization of acetylated 3R tau fibrils.
a SDS-PAGE gel of pronase-digested acetylated 3R tau fibrils (left). The protease digestion experiment has been performed upto 3 times with similar result. Number of peptides detected from the enzymatic digestion of the tau band (right). Lysine and arginine residues are marked with purple and green dots, respectively. Source data are provided as a Source data file. b, c Superposition of hNH spectra (b) and 2D 15N-13C planes of 3D (H)CANH spectra (c) of unmodified (black) and acetylated (orange) 3R tau fibrils.
Fig. 6
Fig. 6. Selective acetylation in tauopathies.
ad Acetylation patterns mapped onto the atomic structures of tau fibrils purified from Alzheimer’s disease patient brain (a; PDB code – 5O3L), Pick’s disease patient (b; PDB code – 6GX5), CBD patient (c; PDB code – 6TJO) and PSP patient brain (d; PDB code – 7P65). Unmodified lysine residues present in the filament core of each disease are shown in black; acetylated lysine residues in red. Weakly acetylated K290 in CBD is shown in orange. The data of acetylated lysine residues in different tauopathies were taken from Kametani et al. and Arakhamia et al.. e Model for the emergence of 3R tauopathies. See text for further details.

References

    1. Dugger, B. N. & Dickson, D. W. Pathology of neurodegenerative diseases. Cold Spring Harb. Perspect. Biol.9, 10.1101/cshperspect.a028035 (2017). - PMC - PubMed
    1. Wang Y, Mandelkow E. Tau in physiology and pathology. Nat. Rev. Neurosci. 2016;17:5–21. - PubMed
    1. Shi Y, et al. Structure-based classification of tauopathies. Nature. 2021;598:359–363. - PMC - PubMed
    1. Li D, Liu C. Hierarchical chemical determination of amyloid polymorphs in neurodegenerative disease. Nat. Chem. Biol. 2021;17:237–245. - PubMed
    1. Andreadis A. Misregulation of tau alternative splicing in neurodegeneration and dementia. Prog. Mol. Subcell. Biol. 2006;44:89–107. - PubMed

Publication types