. 2023 Sep 22;14(1):5915.
doi: 10.1038/s41467-023-41581-3.

Distinct sub-second dopamine signaling in dorsolateral striatum measured by a genetically-encoded fluorescent sensor

Affiliations

Distinct sub-second dopamine signaling in dorsolateral striatum measured by a genetically-encoded fluorescent sensor

Armando G Salinas et al. Nat Commun. .

Abstract

The development of genetically encoded dopamine sensors such as dLight has provided a new approach to measuring slow and fast dopamine dynamics both in brain slices and in vivo, possibly enabling dopamine measurements in areas like the dorsolateral striatum (DLS) where previously such recordings with fast-scan cyclic voltammetry (FSCV) were difficult. To test this, we first evaluated dLight photometry in mouse brain slices with simultaneous FSCV and found that both techniques yielded comparable results, but notable differences in responses to dopamine transporter inhibitors, including cocaine. We then used in vivo fiber photometry with dLight in mice to examine responses to cocaine in DLS. We also compared dopamine responses during Pavlovian conditioning across the striatum. We show that dopamine increases were readily detectable in DLS and describe transient dopamine kinetics, as well as slowly developing signals during conditioning. Overall, our findings indicate that dLight photometry is well suited to measuring dopamine dynamics in DLS.


Conflict of interest statement

The authors declare no competing interests.

Figures

Fig. 1
Fig. 1. Simultaneous comparison of dLight and FSCV dopamine responses in dorsal striatal slices.
a Schematic diagram of simultaneous dLight photometric and FSCV recordings. b dLight signal is completely blocked by application of the D1 dopamine receptor antagonist, SCH23390 (n = 2). c Input–output curves of dLight photometric and FSCV DA measurements (*p < 0.05, **p < 0.01; ***p < 0.005, one sample two-tailed t-test, n = 7). d Schematic diagram illustrating the viral strategy used to ablate substantia nigra DA neurons to confirm that changes in striatal dLight fluorescence are due to dopamine arising from these neurons. e, f Genetic ablation of nigral DA neurons results in markedly reduced dopamine release measured (n = 5 CRE- and n = 4 CRE+) with FSCV voltammetry (mixed two-way ANOVA, stim intensity effect p = 0.0003, F (2.043, 11.58) = 17.70, genotype effect p = 0.028, F (1, 7) = 7.630) and dLight photometry (mixed two-way ANOVA, stim intensity effect p < 0.0001, F (2.117, 23.28) = 23.42, genotype effect p = 0.0379, F (1, 14) = 5.257). Representative traces (g) and summarized data (h) showing that application of the D2 dopamine receptor agonist, quinpirole, inhibits dopamine release equally with both methods (n = 5, unpaired two-tailed t-test, p = 0.0766). i, j Increasing extracellular calcium increased dLight fluorescent responses (n = 7, two-tailed paired t-test p = 0.0472). *p < 0.05, **p < 0.01. ***p < 0.001 Error bars represent the SEM. Raw data in panels (b), (c), (e), (f), (h), (j) are provided as a Source data file.
Fig. 2
Fig. 2. DAT inhibitors do not increase dopamine release.
a Representative traces of simultaneously collected dLight (blue shades) and FSCV (orange shades) DA transients before and after application of cocaine. b Summary data showing that application of cocaine to dorsal striatal slices dose dependently increases peak DA transient peak amplitude measured with FSCV but not dLight photometry methods (n = 4). c Summary data showing that DA transient duration is increased with both methods following cocaine application (n = 4). d, e Similarly, the specific DAT inhibitor, nomifensine (1 μM) increases DA transient peak amplitude with FSCV but not dLight photometry measurements. f Nomifensine experiment: Amplitude and duration of transients measured with dLight photometry normalized to pre-drug conditions with the unmodified triangle waveform (−0.4 V to 1.2 V, n = 9). g The same normalized dlight photometry readout with nomifensine and modified triangle waveform (−0.4 V to 1.0 V, n = 4). h The normalized FSCV amplitude and duration changes with nomifensine and unmodified triangle waveform (−0.4 V to 1.2, n = 8). i The normalized FSCV amplitude and duration changes with nomifensine and modified triangle waveform (−0.4 V to 1.0 V, n = 4). j, k Cocaine does not increase DA transient peak height in DAT KO mice in photometry (j) and FSCV measurement (k). l, m Schematic diagram of the model for DAT inhibitor-induced increases in dopamine transient peak height measured using FSCV without DAT inhibitor (l) and with DAT inhbitor (m). Error bars represent the SEM. Raw data in panels (b), (c), (f), (g), (h), (i) are provided as a Source data file.
Fig. 3
Fig. 3. Dorsal striatum expression of the dLight sensor on plasma membrane of dendrites synapsing with TH-axons.
a Immunofluorescence detection of dLight sensor with an antibody targeted to the GFP moiety contained in the sensor (cyan) and tyrosine hydroxylase (TH, red) in the dorsal striatum from a mouse injected with a viral vector encoding dLight sensor. Apposition of a dLight-positive dendrite and TH-positive axon is seen at high magnification (right panels). b Electron micrographs of immunogold detection of dLight sensor (gold particles, cyan arrowheads) on the plasma membrane of a dendrite (cyan outline in b). Note the apposition of dendritic dLight and a presynaptic axon (red arrow in b). c dLight expression on the plasma membrane of a soma (cyan outline). Note also the dLight sensor (gold particles) in association with Golgi apparatus and endoplasmic reticulum (ER). d Detection of dLight sensor (scattered dark material, cyan arrowheads) in a dendrite (cyan outline) establishing synapses (red arrows) with a TH-positive axon (gold particles, red arrowheads). Quantitative GFP data (n = 3 cases) is presented in Supplementary Table S1.
Fig. 4
Fig. 4. In vivo dopamine measurement in DLS following cocaine administration.
a Schematic diagram of in vivo fiber photometry system. b Sample fluorescence (dF/F, % baseline) profile of DA activity in DLS before and after i.p. cocaine injection. c Average fluorescence (dF/F, normalized to session maximum) profile of mice (n = 4) before and after i.p. cocaine injection (left panel), and comparison of the average dF/F between 10 min of baseline and 10 min of cocaine injection (right panel, two-tailed paired t-test **p = 0.0050). d Magnified dF/F profile illustrating DA activity before (Baseline) and after i.p. cocaine injection. e Averaged fluorescence (dF/F, normalized to session maximum) profile of baseline DA transients, time-locked to the transient peaks (n = 64). f Averaged fluorescence (dF/F, normalized to session maximum) profile of DA transients following cocaine injection, time-locked to the transient peaks (n = 165). DA transient g frequency (unpaired two-tailed t-test, p = 0.0002, n = 6 mice) and h amplitude (unpaired two-tailed t-test, p < 0.0001, n = 6 mice) were increased following cocaine injection. Each point denotes a 5 min average of injection. i Average exponential fit of normalized dopamine transient decay. j Fitted exponential decay constant values showing longer DA transient decay time following cocaine injection; individual points correspond to individual transients (n = 52), unpaired two-tailed t-test, p < 0.0001. k dLight fluorescence is blocked by in vivo administration of the D1R antagonist, SCH23390. l Representative dF/F profiles for dLight in DLS before and after SCH23390 administration as well as for an eGFP control mouse. ***p < 0.001. Shaded areas and error bars represent the SEM. Raw data in panels (c), (g), (h), (j) are provided as a Source data file.
Fig. 5
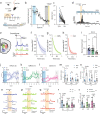
Fig. 5. In vivo dopamine dynamics across striatal regions during Pavlovian training.
a Schematic diagram of the experimental design and b, c behavioral learning curve during Pavlovian training (n = 20 mice, two-tailed paired t-test, p < 0.0001). d Head-entry probability in the early (days 1–3) and late training sessions (days 12–14). e Monitoring sites in the striatum and example traces of dF/F session average profiles in NAc, DMS, and DLS. fh Averaged decay constant fitting of normalized DA transients aligned to the onset of CS+. i Summarized decay constants across striatal regions. Each point is an average of 15 CS+ trials per animal (one-way ANOVA with Bonferroni’s correction for multiple comparisons, *p = 0.01, ***p = 0.0005). jl DA responses to CS+ (open circles) and reward-delivery (filled squares) during the Pavlovian training in NAc (left, blue, n = 6 mice two-way ANOVA time x agent interaction: p < 0.0001****), DMS (mid, green, n = 7 mice two-way ANOVA time x agent interaction: p < 0.0006***), and DLS (right, red, n = 7 mice, two-way ANOVA time x agent interaction: p < 0.0001****), respectively. m DA responses coupled to reward delivery (n = 20 mice, two-way ANOVA main effect: training: n.s region: p = 0.0202). n DA responses coupled to CS+ in the early and late training sessions (n = 20 mice, two-way ANOVA region effect: p = 0.0202*, training effect: n.s. p = 0.1078, region x training interaction: n.s. p = 0.0911 F (2, 17) = 2.767). oq Across striatal regions, DA responses to CS− presentation (top row), CS+ (mid row) and unexpected omission (top row) in the late training phase. r DA responses coupled to CS+ or CS− presentation (n = 20 mice, two-way ANOVA, cue effect: p < 0.0001**** region effect: p = 0.0075** cue x region interaction: p = 0.0268*). s DA responses in unexpected-omission test (n = 20 mice, two-way ANOVA reward effect: p < 0.0001**** region: ns p = 0.6399, reward x region interaction: ns p = 0.7884). Shaded orange areas indicate CS duration. Error bars and error bands in all plots represent the SEM. Raw data in panels (b), (c), (i), (j), (k), (m), (n), (r), (s) are provided as a Source data file.
Fig. 6
Fig. 6. Head-entry rate and dopamine activity patterns in striatal subregions.
a NAc with CS+ and reward (left) CS+ and unexpected omission (mid), and CS− without reward (right); b DMS with CS+ and reward (left) CS+ and unexpected omission (mid), and CS− without reward (right); and c DLS with CS+ and reward (left) CS+ and unexpected omission (mid), and CS− without reward (right), and d Fluorescence signals in GFP control mice with CS+ and reward (left) CS+ and unexpected omission (mid), and CS− without reward (right). Shaded orange areas indicate CS duration. Note the sustained increase in fluorescence between the offset of the transient induced by the CS+ and reward delivery or unexpected omission in the NAc but not DMS or DLS. Error bands represent the SEM.

References

    1. Berke JD. What does dopamine mean? Nat. Neurosci. 2018;21:787–793. - PMC - PubMed
    1. Calabresi P, Mercuri NB, Di Filippo M. Synaptic plasticity, dopamine and Parkinson’s disease: one step ahead. Brain. 2009;132:285–287. - PubMed
    1. Ott T, Nieder A. Dopamine and cognitive control in prefrontal cortex. Trends Cogn. Sci. 2019;23:213–234. - PubMed
    1. Grace AA. Dysregulation of the dopamine system in the pathophysiology of schizophrenia and depression. Nat. Rev. Neurosci. 2016;17:524–532. - PMC - PubMed
    1. Nestler EJ, Carlezon WA., Jr. The mesolimbic dopamine reward circuit in depression. Biol. Psychiatry. 2006;59:1151–1159. - PubMed

Publication types