. 2023 Sep 22;13(1):15848.
doi: 10.1038/s41598-023-41687-0.

Estimating 225Ac yield in thorium metal targets

Affiliations

Estimating 225Ac yield in thorium metal targets

M Rahmani et al. Sci Rep. .

Abstract

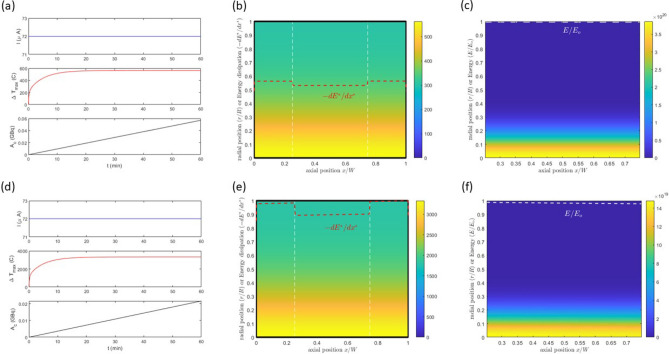
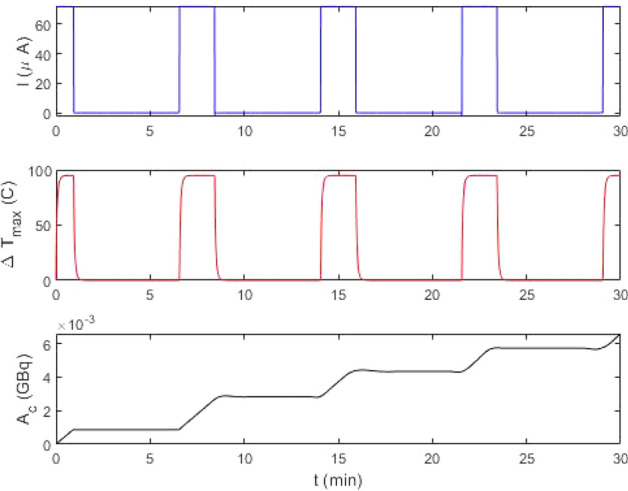
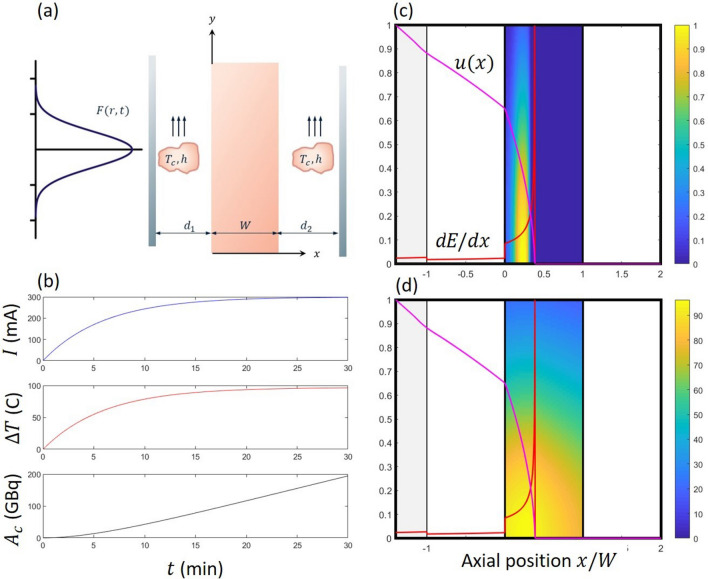
In this work we estimate the yield of the radioisotope [Formula: see text] in a thorium metal target geometry similar to that described by Roberston et al.. We do so in three different yet complimentary studies. In the first study, we pose a three-way coupled time-dependent model describing beam position, temperature field, and local growth of the activity of the radioisotope and solve this numerically. In the second study, we present an analytical solution of the model equations for a generalized solid target in the "beam-thin" limit, i.e. where only a small fraction of the incoming energy of the proton beam is deposited into the thorium material. In the third study, we use the insight gained from the analytical solution and describe an operating strategy to maximize yield by modulating the beam flux temporally.


Conflict of interest statement

The authors declare no competing interests.

Figures

Figure 1
Figure 1
Schematic of the model geometry geometry considered. The beam enters the cylindrical target from the left. The Gaussian curve, drawn in blue, represents the distribution in flux F(rt). The target package is of width W and is a composite structure comprised of three layers as shown in the inset. The central body is Thorium (Th) and it is within this domain that the reaction to produce 225Ac occurs.
Figure 2
Figure 2
Two separate simulations conditions are presented in this experimental campaign. In (ac), the simulations were conducted with a 451 MeV beam with the cross-section data given from the open literature. More detail of the simulation conditions are given in Table 1. For energy levels greater than the range given from the literature data, the cross-section was assumed to constant at 19.4 mb. In detail, in (a), we display the current, maximum temperature and Ac as a function of time over the one hour simulation. The temperature profile and isotope distribution N are shown in (b) and (c). In (df), we display the second simulation. The simulations were conducted with a 100 MeV beam. In detail, in (d), we display the current, maximum temperature and Ac as a function of time over the one hour simulation. The temperature profile and isotope distribution N are shown in (e) and (f). In both simulations, we display the the energy profile E/Ec as the white dashed lines in (c) and (f). In (b) and (e) we show the energy dissipation as the red dashed lines, and the position of each foil as the vertical white dashed lines. The energy dissipation -dE/dx has been scaled so that it will fit on the graphs. The definition of the scaling will be given in the text subsequently. For all simulations R=50 mm, w=0.1 mm, =0.3 mm, ω=9 mm and operated under a constant beam with g(t)=1. With a beam current of 72 μA, we determine Fo=1.77×10¹⁸ particles/m2 s using Eq. (5c)
Figure 3
Figure 3
The normalized depth-averaged temperature distribution over the radius of a thin target body. The simulations were conducted with ω¯=1 at three different values of Bi.
Figure 4
Figure 4
We display the current, maximum temperature and Ac as a function of time over the 30 min simulation. For this simulation, R=50 mm, w=0.1 mm, =0.3 mm, ω=9 mm and operated with the beam being modulated over a 7 minute period (th=2 min and tc=5 min. The density, heat capacity and thermal conductivity of all materials, and heat transfer coefficient are similar to that given by Roberston et al.. With a beam current of 72 A, we determine Fo=1.77×10¹⁸ particles/m2 s using Eq. (5c).
Figure 5
Figure 5
(a) Schematic of the updated geometry. The 40 MeV beam enters the target from the left through a 2 mm thick foil with A=2.25×1032 m3/s4 and B=1.46×10⁻¹³ s2/m2. The beam passes through the cooling water (A=1.47×1032 m3/s4, B=1.52×10⁻¹³ s2/m2) in a channel of thickness d1=5 mm before coming to rest in a target of thickness W=5 mm (A=1.20×1033 m3/s4, B=2.71×10⁻¹⁴ s2/m2) and diameter of 50 mm. A second channel of thickness d2=5 mm is located downstream and cools the other side of the target. A mass flowrate of 1 kg/s of water was set in each channel. The Gaussian curve, drawn in blue, represents the distribution in flux F(rt) with ω/R=0.8. (b) The conditions outlined by Tanguay et al. for the production of 100Tc from 99mMo. Here, the current of the beam I was slowly increased to 300 mA over the first 20 minutes of production. Following this it was held constant. In the two lower figures, the maximum temperature rise ΔT and the growth in Ac as determined from the simulation. The heat transfer coefficient was set to h=10,000 W/m2 K, thermal conductivity k=132 W/m K giving a Biot number Bi=0.36. (c) The color map represents the estimated distribution of N. Superimposed onto this is the solution for u, pink line, and energy dissipation de/dx, red line. (d) The color map represents the temperature distribution. The pink and red lines are defined as in (c). With a beam current of 300 A, we determine Fo=3.15×1024 particles/m2 s using Eq. (5c). The intermediary steps to calculate A and B are given as S2 in the Supplemental Material.

References

    1. Krasnov N. Thick target yield. Int. J. Appl. Radiat. Isotopes. 1974;25:223–227. doi: 10.1016/0020-708X(74)90031-3. - DOI
    1. Schlyer, D. et al. Cyclotron produced radionuclides: Principles and practice. In IAEA Technical Reports Series 465 (2008).
    1. Robertson AK, Lobbezoo A, Moskven L, Schaffer P, Hoehr C. Design of a thorium metal target for 225ac production at Triumf. Instruments. 2019;3:18. doi: 10.3390/instruments3010018. - DOI
    1. O’Brien E, Doster J, Nortier F, Olivas E, Stokely M. Two-way multi-physics coupling for modeling high power rbcl isotope production targets. Nucl. Instrum. Methods Phys. Res. Sect. B: Beam Interact. Mater. Atoms. 2018;433:15–22. doi: 10.1016/j.nimb.2018.07.022. - DOI
    1. Lenz J, et al. Gas target coupled density/proton heat load iterative cfd analysis for a xe124 production target. Nucl. Instrum. Methods Phys. Res. Sect. A: Accel. Spectrom. Detect. Assoc. Equip. 2011;655:111–117. doi: 10.1016/j.nima.2011.06.033. - DOI