. 2023 Sep 22;14(1):5923.
doi: 10.1038/s41467-023-41629-4.

BAP1 promotes osteoclast function by metabolic reprogramming

Affiliations

BAP1 promotes osteoclast function by metabolic reprogramming

Nidhi Rohatgi et al. Nat Commun. .

Abstract

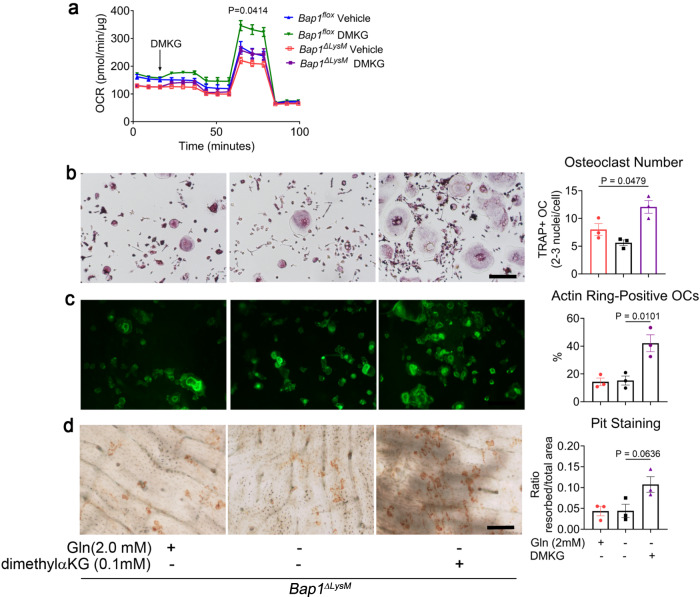
Treatment of osteoporosis commonly diminishes osteoclast number which suppresses bone formation thus compromising fracture prevention. Bone formation is not suppressed, however, when bone degradation is reduced by retarding osteoclast functional resorptive capacity, rather than differentiation. We find deletion of deubiquitinase, BRCA1-associated protein 1 (Bap1), in myeloid cells (Bap1∆LysM), arrests osteoclast function but not formation. Bap1∆LysM osteoclasts fail to organize their cytoskeleton which is essential for bone degradation consequently increasing bone mass in both male and female mice. The deubiquitinase activity of BAP1 modifies osteoclast function by metabolic reprogramming. Bap1 deficient osteoclast upregulate the cystine transporter, Slc7a11, by enhanced H2Aub occupancy of its promoter. SLC7A11 controls cellular reactive oxygen species levels and redirects the mitochondrial metabolites away from the tricarboxylic acid cycle, both being necessary for osteoclast function. Thus, in osteoclasts BAP1 appears to regulate the epigenetic-metabolic axis and is a potential target to reduce bone degradation while maintaining osteogenesis in osteoporotic patients.


Conflict of interest statement

The authors declare no competing interests.

Figures

Fig. 1
Fig. 1. Bap1∆LysM mice are osteopetrotic.
a, b µCT images and trabecular bone parameters of 20-week-old Bap1flox and Bap1∆LysM a male; n = 9 biologically independent samples and b female; n = 8 (Bap1flox) and n = 5 (Bap1∆LysM) biologically independent samples. c µCT images and trabecular bone parameters of 1-year-old Bap1flox and Bap1∆LysM male littermates; n = 5 biologically independent samples. d Serum CTX of 20-week-old male Bap1flox and Bap1∆LysM mice; n = 9 (Bap1flox) and n = 14 (Bap1∆LysM) biologically independent samples. e (Left) Representative femur of a 20-week-old male Bap1flox and Bap1∆LysM mice stained for TRAP activity (red reaction product). (Right) Histomorphometric analysis of trabecular bone; n = 11 (Bap1flox) and n = 13 (Bap1∆LysM) biologically independent samples. The scale bar represents 1 mm. OcN osteoclast number, OcS osteoclast surface, BS bone surface, BV trabecular bone volume, TV total volume, BV/TV bone volume fraction of marrow, vBMD volumetric bone mineral density. Data represent mean ± SEM. P values shown are by two-sided Student’s t-test (ae). Source data are provided as a Source Data file.
Fig. 2
Fig. 2. BAP1 regulates osteoclast function.
a A 8-week-old Bap1flox and Bap1∆LysM BMMs were cultured with M-CSF and RANKL (100 ng/mL). The total cell lysate was collected with time. (Left) Representative immunoblot for the osteoclast differentiation proteins. (Right) Densitometric analysis of osteoclast differentiation proteins; n = 4 independent experiments. b (Left) Representative image of Bap1flox and Bap1∆LysM osteoclasts stained for TRAP activity. The scale bar represents 500 µm. Inset shows TRAP-positive Bap1∆LysM osteoclast at a higher magnification; n = 4 independent experiments. (Right) Quantification of multinuclear and mononuclear TRAP +ve cells in either genotype. c Two- to eightfold more Bap1∆LysM BMMs in contrast to Bap1flox BMMs (1×) were cultured with M-CSF and RANKL (100 ng/mL) for 5 days to form osteoclasts (OC), after which they were stained for TRAP activity. The scale bar represents 500 µm; n = 3 independent experiments. d Bap1flox and Bap1∆LysM BMMs were cultured with M-CSF and RANKL (100 ng/mL) on bovine bone slices. After 5 days, the cells were stained with Alexa-Fluor-488-Phallodin to visualize the actin rings (green color) which were quantified (right panel); Scale bar represents 100 μm; n = 3 independent experiments. e Resorption pits were visualized by wheat germ agglutinin–lectin staining, and the resorbed surface was quantified (right panel). The scale bar represents 100 µm; n = 3 independent experiments. f µCT analysis on femurs of 20-week-old male Bap1flox and Bap1∆catK littermates; Bap1flox n = 6 and Bap1∆catK n = 7 biologically independent samples. BV/TV bone volume fraction of marrow, vBMD volumetric bone mineral density analyzed. g Actin rings for Bap1flox and Bap1∆catK osteoclasts cultured on bone slices. The % of osteoclasts exhibiting actin rings was quantified. The scale bar represents 100 µm; n = 3 independent experiments. Data represent mean ± SEM. P values shown are by two-way ANOVA with Sidak multiple comparison testing (a) or two-sided Student’s t-test (b, dg) or one-way-ANOVA with Dunnett’s testing (c). Source data are provided as a Source Data file.
Fig. 3
Fig. 3. BAP1 epigenetic activity modulates osteoclast function.
a Representative immunoblot of integrin β3 expression in Bap1flox and Bap1∆LysM osteoclast retrovirally transduced with integrin β3 or vector (BMM from 8- to 12-week-old male mice); n = 3 biologically independent experiments. b Transduced BMMs were cultured with M-CSF and RANKL (100 ng/mL) on bovine bone slices. After 5 days, the cells were stained with Alexa-Fluor-488-Phallodin to visualize the actin rings (green color), and % of osteoclasts exhibiting actin rings per well were quantified. The scale bar represents 100 µm; n = 2 independent experiments. c Day 3 Bap1flox and Bap1∆LysM pre-osteoclasts (preOCs) from 8- to 12-week-old male mice were cultured for 3 h in serum-free medium. The cells were plated on a vitronectin-coated petri dish (+) or maintained in suspension for 30 min (−). GTP-Rac1 and total Rac1 were analyzed by pull-down assay followed by immunoblot, n = 3 independent experiments. d Bap1flox and Bap1∆LysM BMMs were cultured with M-CSF ± RANKL (100 ng/mL). The total cell lysate was collected with time. The abundance of H2AK119ub1 modification was determined by immunoblot; n = 3 biologically independent experiments. e Bap1∆LysM BMMs from 16- to 20-week-old male mice transduced with human Bap1WT; Bap1C91A or vector (V) were exposed to M-CSF (BMM) or M-CSF and RANKL (100 ng/mL) for 3 days to generate pre-osteoclasts (preOCs). The total cell lysate was extracted, and BAP1 or H2AK119ub1 expression was determined by immunoblot; n = 3 independent experiments. f Fully differentiated osteoclasts were stained for TRAP activity. The scale bar represents 500 µm; n = 3 independent experiments. g Cells stained with 488-Phalloidin to visualize actin rings (green color). % of osteoclasts exhibiting actin rings was quantified. The scale bar represents 100 µm; n = 3 independent experiments. h Following removal of the transduced osteoclasts, resorption pits were visualized by wheat germ agglutinin-lectin staining and quantified per well. The scale bar represents 100 μm; n = 3 independent experiments. Data are represented as mean ± SEM. P values shown are by two-way ANOVA with Sidak’s multiple comparison testing (ae) or one-way ANOVA with Tukey’s post-hoc testing (fh). Source data are provided as a Source Data file.
Fig. 4
Fig. 4. BAP1 regulates osteoclast transcription.
RNA-seq analysis of osteoclasts derived from 20-week-old Bap1flox and Bap1∆LysM male mice. a Enrichr pathway analysis of all genes significantly downregulated (negative enrichment) in Bap1ΔLysM preOCs. b Heatmap of most significantly downregulated genes in preOCs based on log (fold change) > 1.5 with adjusted P < 0.001 as determined by Benjamini–Hochberg false-discovery rate; n = 6 (Bap1flox) and n = 5 (Bap1∆LysM). c qPCR analysis of candidate genes involved in metabolism, Fabp7, Ehhadh, and B4galt4 mRNA in Bap1flox and Bap1∆LysM preOCs; n = 3 independent experiments. d Enrichr pathway analysis of all genes significantly upregulated (positive enrichment, red bar) in Bap1flox preOCs. e qPCR analysis of upregulated genes in Bap1flox and Bap1∆LysM BMMs and preOCs; n = 3 independent experiments. Data represents mean ± SEM. P values shown are by two-way ANOVA with Sidak’s multiple comparison testing (c, e). Source data are provided as a Source Data file.
Fig. 5
Fig. 5. BAP1 regulates Slc7a11 expression by reducing the H2Aub occupancy of its promoter.
a Heatmap of solute carrier genes upregulated in preOCs based on log (fold change) > 1.5 with adjusted P < 0.001 as determined by Benjamini–Hochberg false-discovery rate; n = 6 (Bap1flox) and n = 5 (Bap1∆LysM) 20-week-old biologically independent samples. b qPCR analysis of Slc7a11 mRNA in 16–20-week-old Bap1flox and Bap1∆LysM BMMs and osteoclasts at different stages of differentiation; n = 3 independent experiments. c Bap1∆LysM BMMs, transduced with BAP1WT or BAP1C91A followed by treatment with M-CSF and RANKL (100 ng/mL) for 3 days. Slc7a11 gene expression was determined by qPCR analysis; n = 3 independent experiments. d ChIP-qPCR quantifying BAP1 binding on Slc7a11 promoter of Bap1∆LysM preOCs transduced with either BAP1WT or Bap1C91A or Vector; n = 4 independent experiments. e ChIP-qPCR of H2Aub binding on the Slc7a11 promoter in Bap1∆LysM in comparison to the Bap1flox preOCs n = 4 independent experiments. f ChIP-qPCR of H2Aub binding on the Slc7a11 promoter in Bap1∆LysM transduced with Bap1WT or Bap1C91A constructs; n = 3 independent experiments. g Representative graph of GSH abundance in Bap1∆LysM preOCs transduced with Vector, BAP1wt, or BAP1C91A. Bap1flox serves as control; n = 3 independent experiments. h ROS levels in Bap1flox and Bap1ΔLysM BMMs and OCs. Cells treated with H2O2 were used as a positive control. n = 3 independent experiments. i, j Slc7a11 was knockdown using CRISPR in Bap1∆LysM macrophages followed by exposure to MCSF and RANKL (100 ng/ml); n = 3 independent experiments. i Cells were stained for TRAP activity. Scale bar represents 500 µm, or j cultured on bone slices and stained with Alexa Flour-488-Phalloidin (green color) to visualize actin rings and quantified per well (right panel). The scale bar represents 100 µm. Data are represented as mean ± SEM. P values shown are by two-way ANOVA with Sidak’s multiple comparison testing (b, df, h) or one-way ANOVA with Tukey’s multiple comparison testing (c, g) two-sided Students t-test (i, j). Source data are provided as a Source Data file.
Fig. 6
Fig. 6. BAP1 regulates mitochondrial respiration in osteoclasts.
Bap1flox and Bap1∆LysM BMMs derived from 16- to 20-week-old male mice were cultured with M-CSF ± RANKL for 5 days. a Relative abundance of mitochondria determined by qPCR of mt-Co2 DNA normalized to β-globin; n = 4 independent experiments. b Abundance of mitochondrial biogenesis marker mRNA determined by qPCR in macrophages (BMM) and preOCs; n = 3 independent experiments. c qPCR analysis of Pgc1β mRNA in Bap1flox and Bap1∆LysM BMMs and preOCs n = 3 independent experiments. d Bap1flox and Bap1∆LysM BMMs were cultured with M-CSF and RANKL for 3 days. Oxygen consumption rate (OCR) was analyzed by XF Cell Mito Stress Assay; n = 4 independent experiments. e Intracellular ATP abundance in preOCs derived from either genotype; n = 3 independent experiments. f Representative graph of OCR of Bap1∆LysM BMMs, transduced with human Bap1WT; Bap1C91A or Vector (V) exposed to M-CSF and RANKL (100 ng/mL) for 3 days; error bars represent variation among technical replicates; n = 3 independent experiments. g Representative graph of OCR of Bap1∆LysM preOCs transduced with either vector or HA-Pgc1β. Bap1flox serves as control. Error bar represents technical replicates; n = 2 independent experiments. h Bap1∆LysM BMMs, transduced with HA-Pgc1β and exposed to M-CSF and RANKL (100 ng/mL) for 5 days, were stained for TRAP activity. The scale bar represents 500 µm; n = 2 independent experiments. Data represented as mean ± SEM; P values are shown by two-way ANOVA with Sidak’s multiple comparison testing (ad, fh) or two-sided student’s t-test (e). For f, P denotes Bap∆LysM vector vs. Bap∆LysM <Bap1wt. For g, P denotes Bap∆LysM vs. Bap∆LysM <Pgc1β.
Fig. 7
Fig. 7. BAP1 regulates metabolic reprogramming in osteoclasts.
a Schematic demonstrating the relationship between the TCA cycle, glutamine, and GSH synthesis. b Relative abundance of glutamine, aspartate, and glutamate in the cell determined by LC–MS analysis; n = 5 biologically independent samples from 20-week-old male mice. c Abundance of glutathione synthesis genes, Gclc and Gss, as determined by qPCR in preOCs; n = 3 biologically independent samples. d Relative abundance of amino acids in the cell by genotype; n = 5 biologically independent samples. e Pathway analysis using MetaboAnalyst for highly enriched metabolic pathways. Data represents mean ± SEM. P values are shown by two-way ANOVA with Sidak’s multiple comparison test (c) or two-sided student’s t-test (b, d). A global test was conducted for (e) to test the association between metabolites and outcome.
Fig. 8
Fig. 8. Osteoclast function is restored by resupplementing TCA cycle metabolite.
a Representative OCR of Bap1flox or Bap1∆LysM preosteoclast treated acutely with vehicle or membrane-permeable α-KG analog (labeled as DMKG), followed by complex inhibitors. Error bars represent technical replicates; n = 2 biologically independent experiments from 16-week-old male mice. bd Bap1∆LysM osteoclast were cultured in either glutamine sufficient (Gln) or deficient (-Gln) αMEM medium in the presence of M-CSF RANKL (100 ng/ml) and DMKG; n = 3 independent experiments. b After 5 days, cells were stained for TRAP activity (scale bar represents 500 µm), c or cells were cultured on bone slices and stained with Alexa flour 488-Phalloidin to visualize and quantify actin rings (green color; scale bar represents 100 µm). d Following the removal of osteoclasts, resorption pits were visualized by wheat germ agglutinin-lectin and quantified (scale bar represents 100 µm). Data are represented as mean ± SEM; P values are shown by one-way ANOVA with Tukey’s multiple comparison testing (ad). For Fig. a, P denotes the comparison between the Bap1∆LysM vehicle vs. Bap1∆LysM DMKG.

References

    1. Rohatgi N, et al. ASXL1 impairs osteoclast formation by epigenetic regulation of NFATc1. Blood Adv. 2018;2:2467–2477. doi: 10.1182/bloodadvances.2018018309. - DOI - PMC - PubMed
    1. Teitelbaum SL. Bone resorption by osteoclasts. Science. 2000;289:1504–1508. doi: 10.1126/science.289.5484.1504. - DOI - PubMed
    1. Zhang Y, et al. PGC1beta organizes the osteoclast cytoskeleton by mitochondrial biogenesis and activation. J. Bone Min. Res. 2018;33:1114–1125. doi: 10.1002/jbmr.3398. - DOI - PMC - PubMed
    1. Izawa T, et al. ASXL2 regulates glucose, lipid, and skeletal homeostasis. Cell Rep. 2015;11:1625–1637. doi: 10.1016/j.celrep.2015.05.019. - DOI - PMC - PubMed
    1. Zou W, et al. Myeloid-specific Asxl2 deletion limits diet-induced obesity by regulating energy expenditure. J. Clin. Invest. 2020;130:2644–2656. doi: 10.1172/JCI128687. - DOI - PMC - PubMed

Publication types