

Predicting global distributions of eukaryotic plankton communities from satellite data
- PMID: 37740029
- PMCID: PMC10517053
- DOI: 10.1038/s43705-023-00308-7
Predicting global distributions of eukaryotic plankton communities from satellite data
Abstract
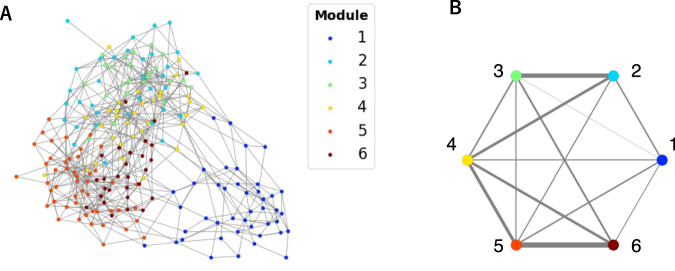
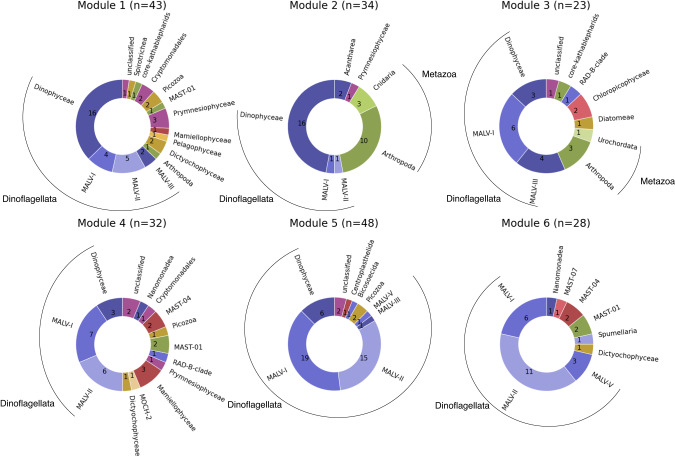
Satellite remote sensing is a powerful tool to monitor the global dynamics of marine plankton. Previous research has focused on developing models to predict the size or taxonomic groups of phytoplankton. Here, we present an approach to identify community types from a global plankton network that includes phytoplankton and heterotrophic protists and to predict their biogeography using global satellite observations. Six plankton community types were identified from a co-occurrence network inferred using a novel rDNA 18 S V4 planetary-scale eukaryotic metabarcoding dataset. Machine learning techniques were then applied to construct a model that predicted these community types from satellite data. The model showed an overall 67% accuracy in the prediction of the community types. The prediction using 17 satellite-derived parameters showed better performance than that using only temperature and/or the concentration of chlorophyll a. The constructed model predicted the global spatiotemporal distribution of community types over 19 years. The predicted distributions exhibited strong seasonal changes in community types in the subarctic-subtropical boundary regions, which were consistent with previous field observations. The model also identified the long-term trends in the distribution of community types, which suggested responses to ocean warming.
© 2023. ISME Publications B.V.
Conflict of interest statement
The authors declare no competing interests.
Figures


References
-
- Mouw CB, Hardman-Mountford NJ, Alvain S, Bracher A, Brewin RJW, Bricaud A, et al. A consumer’s guide to satellite remote sensing of multiple phytoplankton groups in the global ocean. Front Mar Sci. 2017;4:41.
-
- Bracher A, Bouman HA, Brewin RJW, Bricaud A, Brotas V, Ciotti AM, et al. Obtaining phytoplankton diversity from ocean color: a scientific roadmap for future development. Front Mar Sci. 2017;4:55.
-
- Mirkovic T, Ostroumov EE, Anna JM, van Grondelle R, Govindjee, Scholes GD. Light absorption and energy transfer in the antenna complexes of photosynthetic organisms. Chem Rev. 2017;117:249–93. - PubMed
-
- Hirata T, Hardman-Mountford NJ, Brewin RJW, Aiken J, Barlow R, Suzuki K, et al. Synoptic relationships between surface Chlorophyll- a and diagnostic pigments specific to phytoplankton functional types. Biogeosciences. 2011;8:311–27.
Grants and funding
- 18H02279/MEXT | Japan Society for the Promotion of Science (JSPS)
- 19H05667/MEXT | Japan Society for the Promotion of Science (JSPS)
- JPMJSP2110/MEXT | Japan Science and Technology Agency (JST)
- ANR-10-INBS-09/Agence Nationale de la Recherche (French National Research Agency)
- 101082021/EC | Horizon 2020 Framework Programme (EU Framework Programme for Research and Innovation H2020)
