

COSMOS: a platform for real-time morphology-based, label-free cell sorting using deep learning
- PMID: 37740030
- PMCID: PMC10516940
- DOI: 10.1038/s42003-023-05325-9
COSMOS: a platform for real-time morphology-based, label-free cell sorting using deep learning
Erratum in
-
Author Correction: COSMOS: a platform for real-time morphology-based, label-free cell sorting using deep learning.Commun Biol. 2023 Oct 9;6(1):1023. doi: 10.1038/s42003-023-05415-8. Commun Biol. 2023. PMID: 37813962 Free PMC article. No abstract available.
Abstract
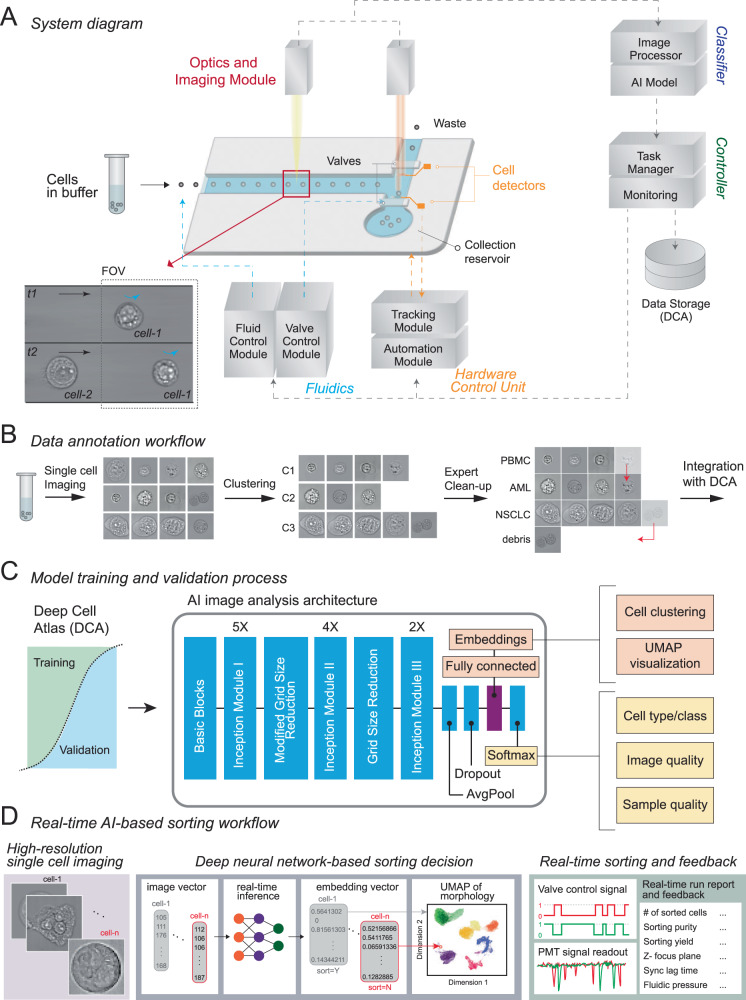
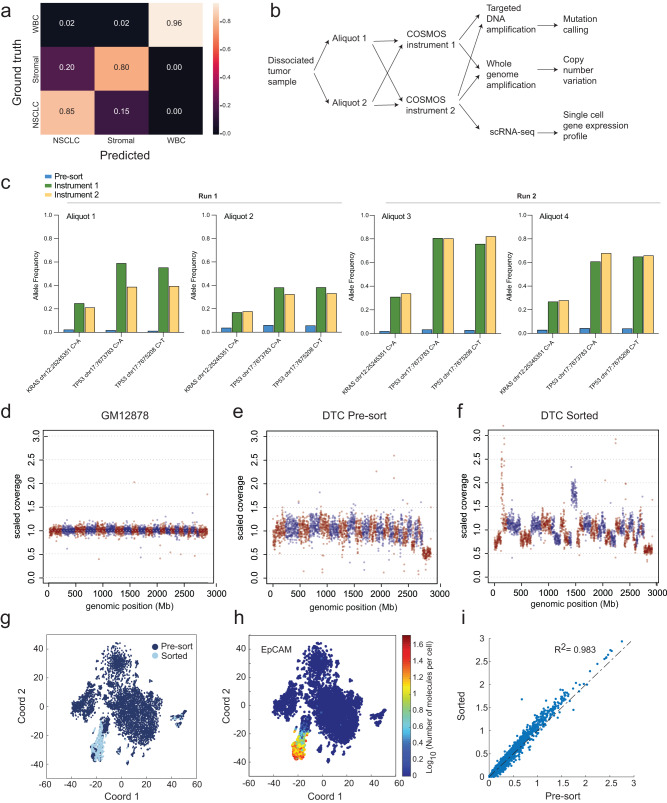
Cells are the singular building blocks of life, and a comprehensive understanding of morphology, among other properties, is crucial to the assessment of underlying heterogeneity. We developed Computational Sorting and Mapping of Single Cells (COSMOS), a platform based on Artificial Intelligence (AI) and microfluidics to characterize and sort single cells based on real-time deep learning interpretation of high-resolution brightfield images. Supervised deep learning models were applied to characterize and sort cell lines and dissociated primary tissue based on high-dimensional embedding vectors of morphology without the need for biomarker labels and stains/dyes. We demonstrate COSMOS capabilities with multiple human cell lines and tissue samples. These early results suggest that our neural networks embedding space can capture and recapitulate deep visual characteristics and can be used to efficiently purify unlabeled viable cells with desired morphological traits. Our approach resolves a technical gap in the ability to perform real-time deep learning assessment and sorting of cells based on high-resolution brightfield images.
© 2023. Springer Nature Limited.
Conflict of interest statement
All authors declare the following competing interests: current or former employment at Deepcell, Inc.
Figures

Similar articles
-
Deep Learning-Assisted Label-Free Parallel Cell Sorting with Digital Microfluidics.Adv Sci (Weinh). 2025 Jan;12(1):e2408353. doi: 10.1002/advs.202408353. Epub 2024 Nov 5. Adv Sci (Weinh). 2025. PMID: 39497614 Free PMC article.
-
Low-latency label-free image-activated cell sorting using fast deep learning and AI inferencing.Biosens Bioelectron. 2023 Jan 15;220:114865. doi: 10.1016/j.bios.2022.114865. Epub 2022 Nov 7. Biosens Bioelectron. 2023. PMID: 36368140
-
A Hybrid Stacked CNN and Residual Feedback GMDH-LSTM Deep Learning Model for Stroke Prediction Applied on Mobile AI Smart Hospital Platform.Sensors (Basel). 2023 Mar 27;23(7):3500. doi: 10.3390/s23073500. Sensors (Basel). 2023. PMID: 37050561 Free PMC article.
-
Artificial intelligence in dermatopathology: Diagnosis, education, and research.J Cutan Pathol. 2021 Aug;48(8):1061-1068. doi: 10.1111/cup.13954. Epub 2021 Jan 26. J Cutan Pathol. 2021. PMID: 33421167 Review.
-
Deep Learning-Based Artificial Intelligence for Mammography.Korean J Radiol. 2021 Aug;22(8):1225-1239. doi: 10.3348/kjr.2020.1210. Epub 2021 May 4. Korean J Radiol. 2021. PMID: 33987993 Free PMC article. Review.
Cited by
-
Using deep learning to decipher the impact of telomerase promoter mutations on the dynamic metastatic morpholome.PLoS Comput Biol. 2024 Jul 30;20(7):e1012271. doi: 10.1371/journal.pcbi.1012271. eCollection 2024 Jul. PLoS Comput Biol. 2024. PMID: 39078811 Free PMC article.
-
Image-Enabled Cell Sorting Using the BD CellView Technology.Methods Mol Biol. 2024;2779:145-158. doi: 10.1007/978-1-0716-3738-8_8. Methods Mol Biol. 2024. PMID: 38526786
-
Optical sorting: past, present and future.Light Sci Appl. 2025 Feb 27;14(1):103. doi: 10.1038/s41377-024-01734-5. Light Sci Appl. 2025. PMID: 40011460 Free PMC article. Review.
-
Characterizing Recent PDMS Changes in Electrokinetic-Based Microfluidic Devices' Performance and Manufacturing for Cell Sorting Applications.Electrophoresis. 2025 Feb 18:10.1002/elps.8113. doi: 10.1002/elps.8113. Online ahead of print. Electrophoresis. 2025. PMID: 39965072 Free PMC article.
-
Advances and applications in single-cell and spatial genomics.Sci China Life Sci. 2025 May;68(5):1226-1282. doi: 10.1007/s11427-024-2770-x. Epub 2024 Dec 20. Sci China Life Sci. 2025. PMID: 39792333 Review.
References
-
- Ezran, C. et al. Tabula Microcebus: a transcriptomic cell atlas of mouse lemur, an emerging primate model organism. Preprint at bioRxiv10.1101/2021.12.12.469460 (2021).
Publication types
MeSH terms
Substances
LinkOut - more resources
Full Text Sources
Molecular Biology Databases
Miscellaneous
