

Linezolid Population Pharmacokinetic Model in Plasma and Cerebrospinal Fluid Among Patients With Tuberculosis Meningitis
- PMID: 37740554
- PMCID: PMC11011161
- DOI: 10.1093/infdis/jiad413
Linezolid Population Pharmacokinetic Model in Plasma and Cerebrospinal Fluid Among Patients With Tuberculosis Meningitis
Abstract
Background: Linezolid is evaluated in novel treatment regimens for tuberculous meningitis (TBM). Linezolid pharmacokinetics have not been characterized in this population, particularly in cerebrospinal fluid (CSF), as well as, following its co-administration with high-dose rifampicin. We aimed to characterize linezolid plasma and CSF pharmacokinetics in adults with TBM.
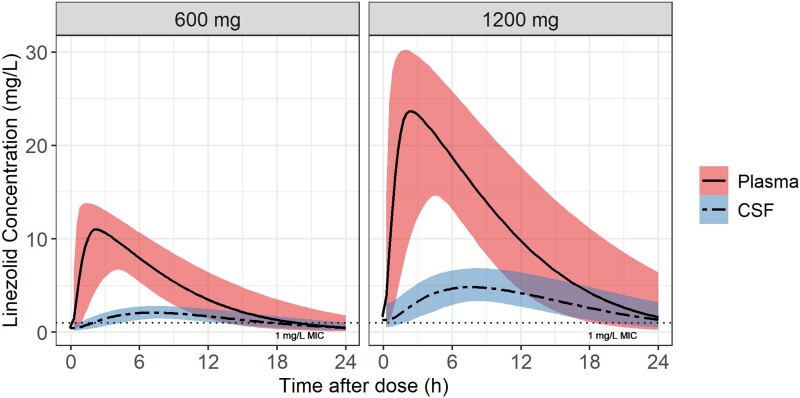
Methods: In the LASER-TBM pharmacokinetic substudy, the intervention groups received high-dose rifampicin (35 mg/kg) plus 1200 mg/day of linezolid for 28 days, which was then reduced to 600 mg/day. Plasma sampling was done on day 3 (intensive) and day 28 (sparse). A lumbar CSF sample was obtained on both visits.
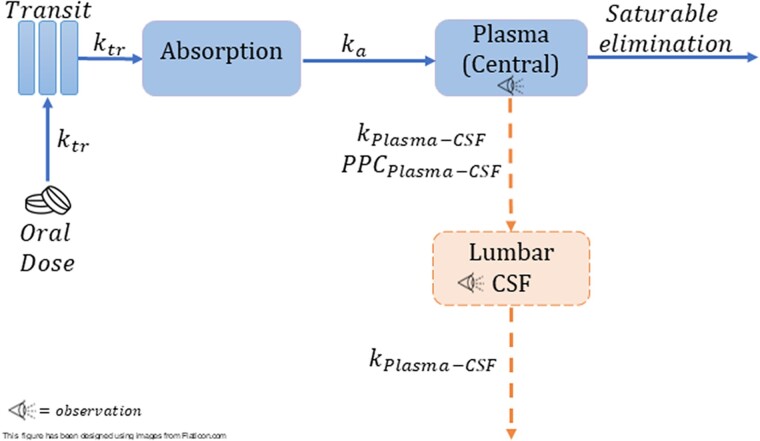
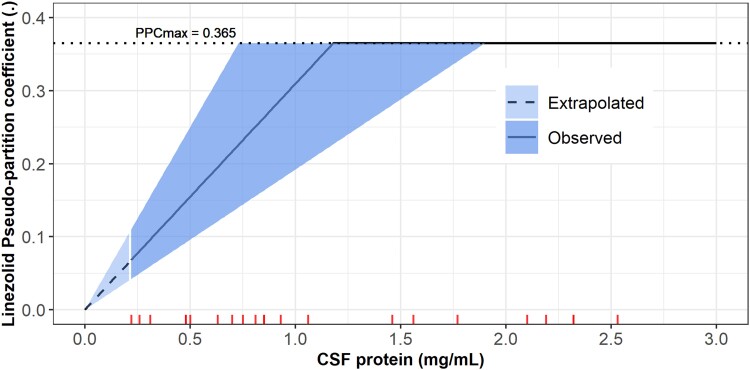
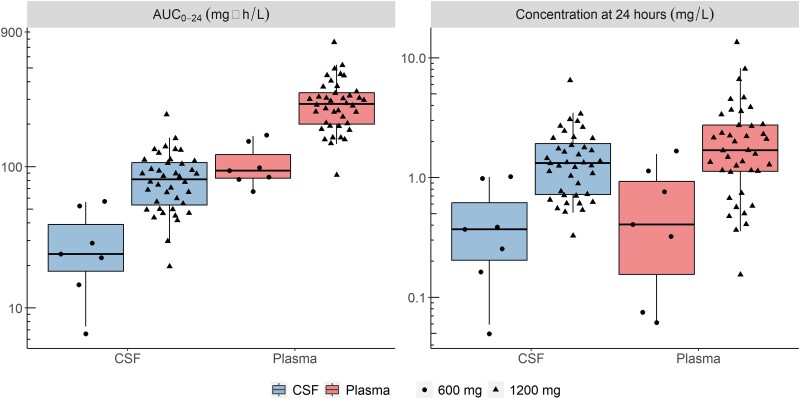
Results: Thirty participants contributed 247 plasma and 28 CSF observations. Their median age and weight were 40 years (range, 27-56) and 58 kg (range, 30-96). Plasma pharmacokinetics was described by a 1-compartment model with first-order absorption and saturable elimination. Maximal clearance was 7.25 L/h, and the Michaelis-Menten constant was 27.2 mg/L. Rifampicin cotreatment duration did not affect linezolid pharmacokinetics. CSF-plasma partitioning correlated with CSF total protein up to 1.2 g/L, where the partition coefficient reached a maximal value of 37%. The plasma-CSF equilibration half-life was ∼3.5 hours.
Conclusions: Linezolid was readily detected in CSF despite high-dose rifampicin coadministration. These findings support continued clinical evaluation of linezolid plus high-dose rifampicin for the treatment of TBM in adults. Clinical Trials Registration. ClinicalTrials.gov (NCT03927313).
Keywords: cerebrospinal fluid; linezolid; modeling and simulation; population pharmacokinetics; tuberculosis meningitis.
© The Author(s) 2023. Published by Oxford University Press on behalf of Infectious Diseases Society of America.
Conflict of interest statement
Potential conflicts of interest . All authors: No reported conflicts. All authors have submitted the ICMJE Form for Disclosure of Potential Conflicts of Interest. Conflicts that the editors consider relevant to the content of the manuscript have been disclosed.
Figures
Update of
-
Linezolid population pharmacokinetic model in plasma and cerebrospinal fluid among patients with tuberculosis meningitis.medRxiv [Preprint]. 2023 Apr 7:2023.04.06.23288230. doi: 10.1101/2023.04.06.23288230. medRxiv. 2023. Update in: J Infect Dis. 2024 Apr 12;229(4):1200-1208. doi: 10.1093/infdis/jiad413. PMID: 37066148 Free PMC article. Updated. Preprint.
References
-
- Pintado V, Pazos R, Jiménez-Mejías ME, et al. Linezolid for therapy of Staphylococcus aureus meningitis: a cohort study of 26 patients. Infect Dis 2020; 52:808–15. - PubMed
-
- Beer R, Pfausler B, Schmutzhard E. Management of nosocomial external ventricular drain-related ventriculomeningitis. Neurocrit Care 2009; 10:363–7. - PubMed
Publication types
MeSH terms
Substances
Associated data
Grants and funding
- UM1 AI068632/AI/NIAID NIH HHS/United States
- CC2112/WT_/Wellcome Trust/United Kingdom
- K43TW011421/NH/NIH HHS/United States
- AI068632/MH/NIMH NIH HHS/United States
- U01 AI170426/AI/NIAID NIH HHS/United States
- UM1 AI106701/AI/NIAID NIH HHS/United States
- R01 AI145436/AI/NIAID NIH HHS/United States
- CC2112/CRUK_/Cancer Research UK/United Kingdom
- D43 TW010559/TW/FIC NIH HHS/United States
- U01 AI068632/AI/NIAID NIH HHS/United States
- UM1 AI068634/AI/NIAID NIH HHS/United States
- UM1 AI068636/AI/NIAID NIH HHS/United States
LinkOut - more resources
Full Text Sources
Medical
