. 2023 Nov:148:155693.
doi: 10.1016/j.metabol.2023.155693. Epub 2023 Sep 22.

ATG14 plays a critical role in hepatic lipid droplet homeostasis

Affiliations

ATG14 plays a critical role in hepatic lipid droplet homeostasis

Menghao Huang et al. Metabolism. 2023 Nov.

Abstract

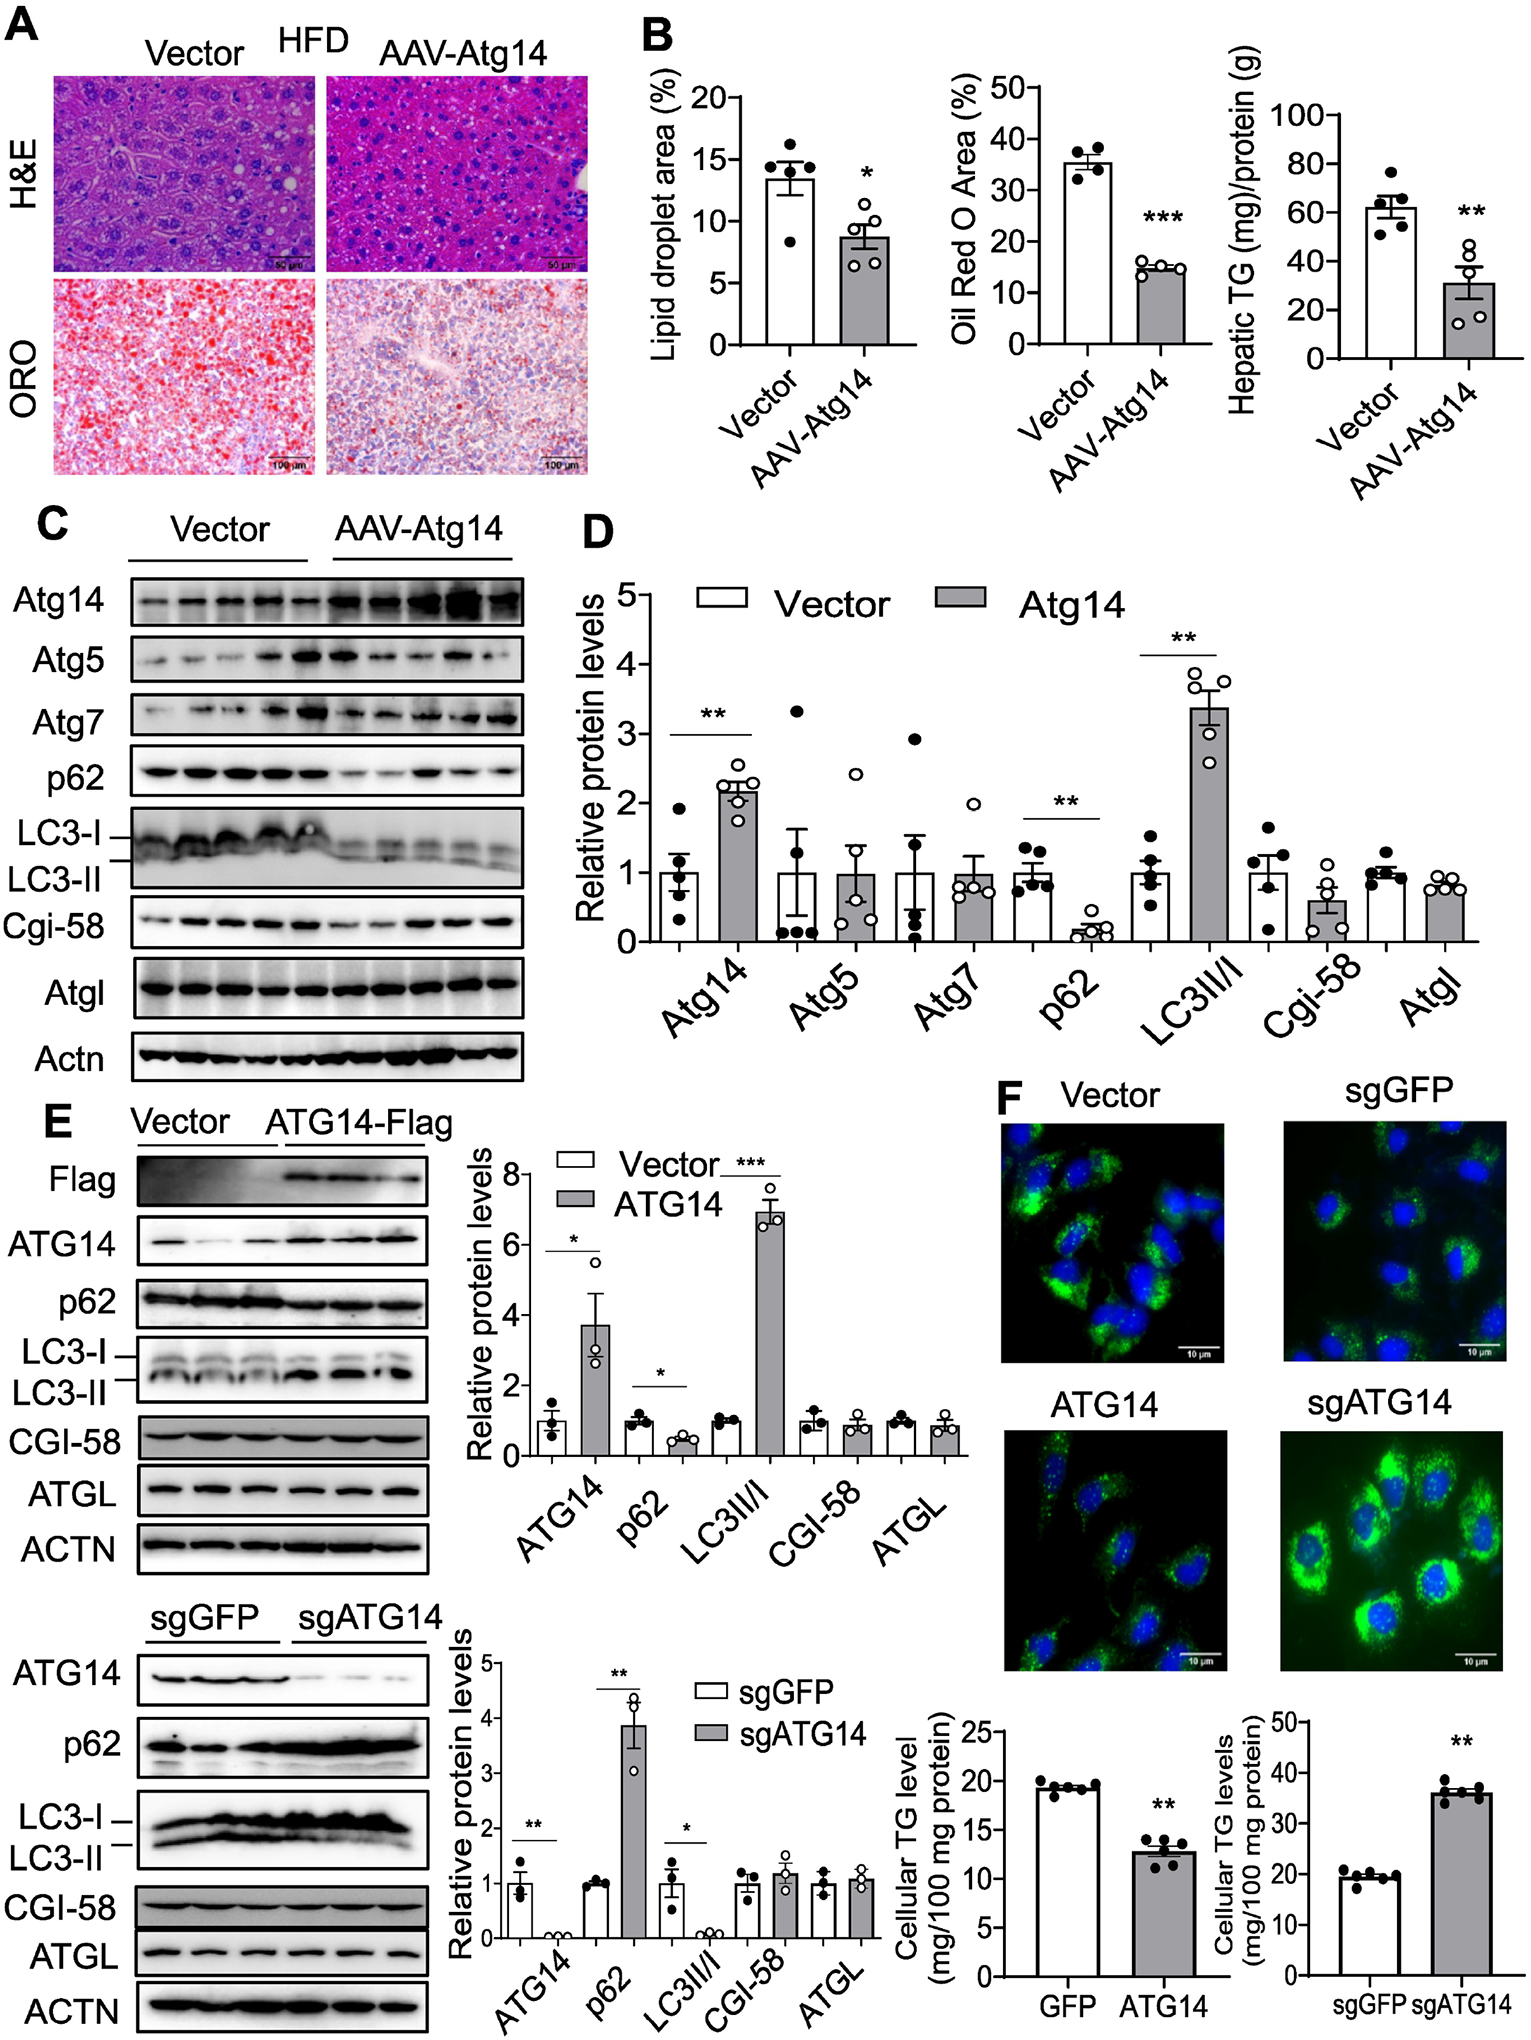
Background & aims: Autophagy-related 14 (ATG14) is a key regulator of autophagy. ATG14 is also localized to lipid droplet; however, the function of ATG14 on lipid droplet remains unclear. In this study, we aimed to elucidate the role of ATG14 in lipid droplet homeostasis.

Methods: ATG14 loss-of-function and gain-of-function in lipid droplet metabolism were analyzed by fluorescence imaging in ATG14 knockdown or overexpression hepatocytes. Specific domains involved in the ATG14 targeting to lipid droplets were analyzed by deletion or site-specific mutagenesis. ATG14-interacting proteins were analyzed by co-immunoprecipitation. The effect of ATG14 on lipolysis was analyzed in human hepatocytes and mouse livers that were deficient in ATG14, comparative gene identification-58 (CGI-58), or both.

Results: Our data show that ATG14 is enriched on lipid droplets in hepatocytes. Mutagenesis analysis reveals that the Barkor/ATG14 autophagosome targeting sequence (BATS) domain of ATG14 is responsible for the ATG14 localization to lipid droplets. Co-immunoprecipitation analysis illustrates that ATG14 interacts with adipose triglyceride lipase (ATGL) and CGI-58. Moreover, ATG14 also enhances the interaction between ATGL and CGI-58. In vitro lipolysis analysis demonstrates that ATG14 deficiency remarkably decreases triglyceride hydrolysis.

Conclusions: Our data suggest that ATG14 can directly enhance lipid droplet breakdown through interactions with ATGL and CGI-58.

Keywords: ABHD5; ATGL; Autophagy; CGI-58; Lipolysis.


Conflict of interest statement

Declaration of competing interest The authors declare no competing interest.

Figures

Figure 1.
Figure 1.. Hepatic ATG14 is decreased in NASH patients.
(A, B) Immunoblot and quantification analysis of ATG14, ATG5, ATG7, p62, LC3-I/II, CGI-58, and ATGL in liver samples from steatosis (n=5) and NASH patients (n=5). (C) H&E staining and ATG14 IHC analysis of the liver sections of steatosis and NASH patients. (D) Hepatic TG measurements from steatosis (n=6) and NASH patients (n=5). Data are presented as mean ± SEM. *P < 0.05, **P < 0.01, and ***P<0.001.
Figure 2.
Figure 2.. Hepatic Atg14 is downregulated in diet-induced MASLD mice.
(A, B) H&E staining and lipid droplet area quantification analysis of liver sections of WT male mice fed with chow or an HFD diet for 6 weeks (n=8). (C) Hepatic TG measurements from the chow and HFD diet-treated mice (n=4). (D) Real-time PCR analysis of expression of several autophagy-related genes including Map1lc3b, Atg7, Atg5, and Atg14, and lipolysis genes including Cgi-58 and Atgl in the livers of WT mice fed with chow or an HFD diet for 6 weeks. (E, F) Immunoblot and quantification analysis of Atg14, Atg5, Atg7, p62, LC3-I/II, Cgi-58, and Atgl in livers of chow and HFD diet-treated mice (n=4). Data are presented as mean ± SEM. *P < 0.05, **P < 0.01, and ***P < 0.001.
Figure 3.
Figure 3.. Hepatic Atg14 deficient mice are more susceptible to diet-induced steatosis.
(A) Immunoblot and quantification analysis of hepatic Atg14, Atg5, Atg7, p62, LC3-I/II, Cgi-58, and Atgl in either control GFP or Atg14 shRNA AAV8 injected male mice fed with an HFD for 4 weeks (n=4). (B) IHC and quantification analysis of p62 in liver sections of control and Atg14 knockdown mice (n=4). (C) H&E staining, Oil Red O staining, and TG measurements in control and Atg14 knockdown livers (n=4). (D) H&E staining and lipid droplet area quantification of liver sections of Atg14 shRNA or control shGFP AAV8 injected mice (n=4–6) fed with chow. Data are presented as mean ± SEM. *P < 0.05, **P < 0.01, and ***P < 0.001.
Figure 4.
Figure 4.. Atg14 regulates hepatic autophagy and lipid droplets.
(A, B) H&E and Oil Red O staining and hepatic TG measurements of livers of AAV8-Atg14 or AAV8-vector injected male mice (n=5) fed with an HFD diet for 4 weeks. (C, D) Immunoblot and quantification analysis of Atg14, Atg5, Atg7, p62, LC3-I/II, Cgi-58, and Atgl in AAV8-Atg14 or AAV8-vector injected mice that were treated with an HFD for 4 weeks (n=5). (E, F) Immunoblot and microscopy analysis of the effect of ATG14 overexpression or knockdown on autophagy and lipid droplets in Huh-7 cells transfected with corresponding plasmids. Lipid droplets were stained by BODIPY. Data are presented as mean ± SEM. *P < 0.05, **P < 0.01, and ***P < 0.001.
Figure 5.
Figure 5.. ATG14 interacts with lipid droplet-associated proteins.
(A) Immunoblot analysis of Atg14 in lipid droplet and cytosolic fractions of WT mouse liver tissue extract. (B) Immunofluorescence microscopy of endogenous ATG14 and lipid droplets in Huh-7 cells. (C) Co-IP analysis of potential interactions between ATG14 and ULK1 (a positive control), ATGL, or CGI-58 in Huh-7 cells. (D) Immunofluorescence microscopy of subcellular localization of ATG14, CGI-58-Flag, or ATGL-Flag in Huh-7 cells. (E) Co-IP analysis of ATGL-interacting proteins in Huh-7 cells that were transfected with vector, ATG14, sgGFP, or sgATG14 plasmids.
Figure 6.
Figure 6.. The BATS domain of ATG14 is required for its interaction with ATGL on lipid droplets.
(A) Immunoblot and quantification analysis of p62 and LC3-I/II in Huh-7 cells transfected with vector control, wild-type ATG14, CCDΔ, BATSΔ, or C43A/C46A mutant. (B) Co-IP analysis of interactions between ATGL and different ATG14 constructs in Huh-7 cells treated with 350 μM oleic acid and palmitic acid mix. (C) Immunofluorescence microscopy of subcellular localization of ATGL and different ATG14 constructs in Huh-7 cells treated with 350 μM oleic acid and palmitic acid mix. Data are presented as mean ± SEM. *P < 0.05.
Figure 7.
Figure 7.. ATG14 promotes lipolysis.
(A-C) BODIPY staining, cellular TG measurements, and TG hydrolase activity analysis in Huh-7 cells transfected with wild-type or mutant ATG14 constructs. Data are presented as mean ± SEM. ***P < 0.001; ###P<0.001 vs. wild-type ATG14.
Figure 8.
Figure 8.. ATGL is critical for the lipid droplet localization of ATG14 and its interaction with CGI-58.
(A) Immunofluorescence microscopy of ATG14 subcellular localization in ATGL deficient Huh-7 cells treated with 350 μM oleic acid and palmitic acid mix. (B) Immunoblot and quantification analysis of ATGL in Huh-7 cells transfected with sgGFP and sgATGL. (C) Immunofluorescence microscopy of ATG14 subcellular localization in CGI-58 deficient Huh-7 cells treated with 350 μM oleic acid and palmitic acid mix. (D) Immunoblot and quantification analysis of CGI-58 in Huh-7 cells transfected with sgGFP and sgCGI-58. (E) Co-IP analysis of ATG14 interaction with ATGL or CGI-58 in ATGL or CGI-58 deficient Huh-7 cells treated with 350 μM oleic acid and palmitic acid mix. Data are presented as mean ± SEM. **P < 0.01.
Figure 9.
Figure 9.. ATG14 and CGI-58 have additive effects on lipolysis.
(A) TG hydrolase activity was analyzed in Huh-7 cells transfected with different ATG14 constructs or CRISPR/Cas9 knockdown plasmids and mouse livers deficient in Atg14, Cgi-58, or both. (B, C) Cellular and hepatic TG levels were measured in Huh-7 cells or mouse livers deficient in Atg14, Cgi-58, or both (n=3–4). Data are presented as mean ± SEM. *P < 0.05, **P < 0.01 and ***P < 0.001 vs vector, sgGFP, or WT; #P < 0.05, ##P < 0.01, and ###P < 0.001.
Figure 10.
Figure 10.. ATG14 promotes triglyceride hydrolase activity in an autophagy-independent manner.
(A-C) Immunoblot and quantification analysis of autophagy proteins in Huh-7 cells deficient in ATG5 or ATG7. (D) Immunoblot analysis ATG5, ATG7, ATG14, p62, and LC3-I/II proteins in Huh-7 cells transfected with the indicated plasmids (n = 4). (E-G) BODIPY staining and TG hydrolase activity analysis in Huh-7 cells with simultaneous ATG14 overexpression and ATG5 or ATG7 knockdown. Data are presented as mean ± SEM. *P < 0.05, **P < 0.01, and ***P < 0.001; ###P<0.001 vs. sgGFP.

References

    1. Dong XC, Chowdhury K, Huang M, Kim HG. Signal Transduction and Molecular Regulation in Fatty Liver Disease. Antioxid Redox Signal. 2021;35:689–717. - PMC - PubMed
    1. Younossi Z, Anstee QM, Marietti M, Hardy T, Henry L, Eslam M, et al. Global burden of NAFLD and NASH: trends, predictions, risk factors and prevention. Nat Rev Gastroenterol Hepatol. 2018;15:11–20. - PubMed
    1. Haas JT, Francque S, Staels B. Pathophysiology and Mechanisms of Nonalcoholic Fatty Liver Disease. Annu Rev Physiol. 2016;78:181–205. - PubMed
    1. Mashek DG, Khan SA, Sathyanarayan A, Ploeger JM, Franklin MP. Hepatic lipid droplet biology: Getting to the root of fatty liver. Hepatology. 2015;62:964–7. - PMC - PubMed
    1. Li T, Guo W, Zhou Z. Adipose Triglyceride Lipase in Hepatic Physiology and Pathophysiology. Biomolecules. 2021;12. - PMC - PubMed

Publication types

MeSH terms

Substances