

Impact of subgroup-specific heterogeneities and dynamic changes in mortality rates on forecasted population size, deaths, and age distribution of persons receiving antiretroviral treatment in the United States: a computer simulation study
- PMID: 37741499
- PMCID: PMC10841391
- DOI: 10.1016/j.annepidem.2023.09.005
Impact of subgroup-specific heterogeneities and dynamic changes in mortality rates on forecasted population size, deaths, and age distribution of persons receiving antiretroviral treatment in the United States: a computer simulation study
Abstract
Purpose: Model-based forecasts of population size, deaths, and age distribution of people with HIV (PWH) are helpful for public health and clinical services planning but are influenced by subgroup-specific heterogeneities and changes in mortality rates.
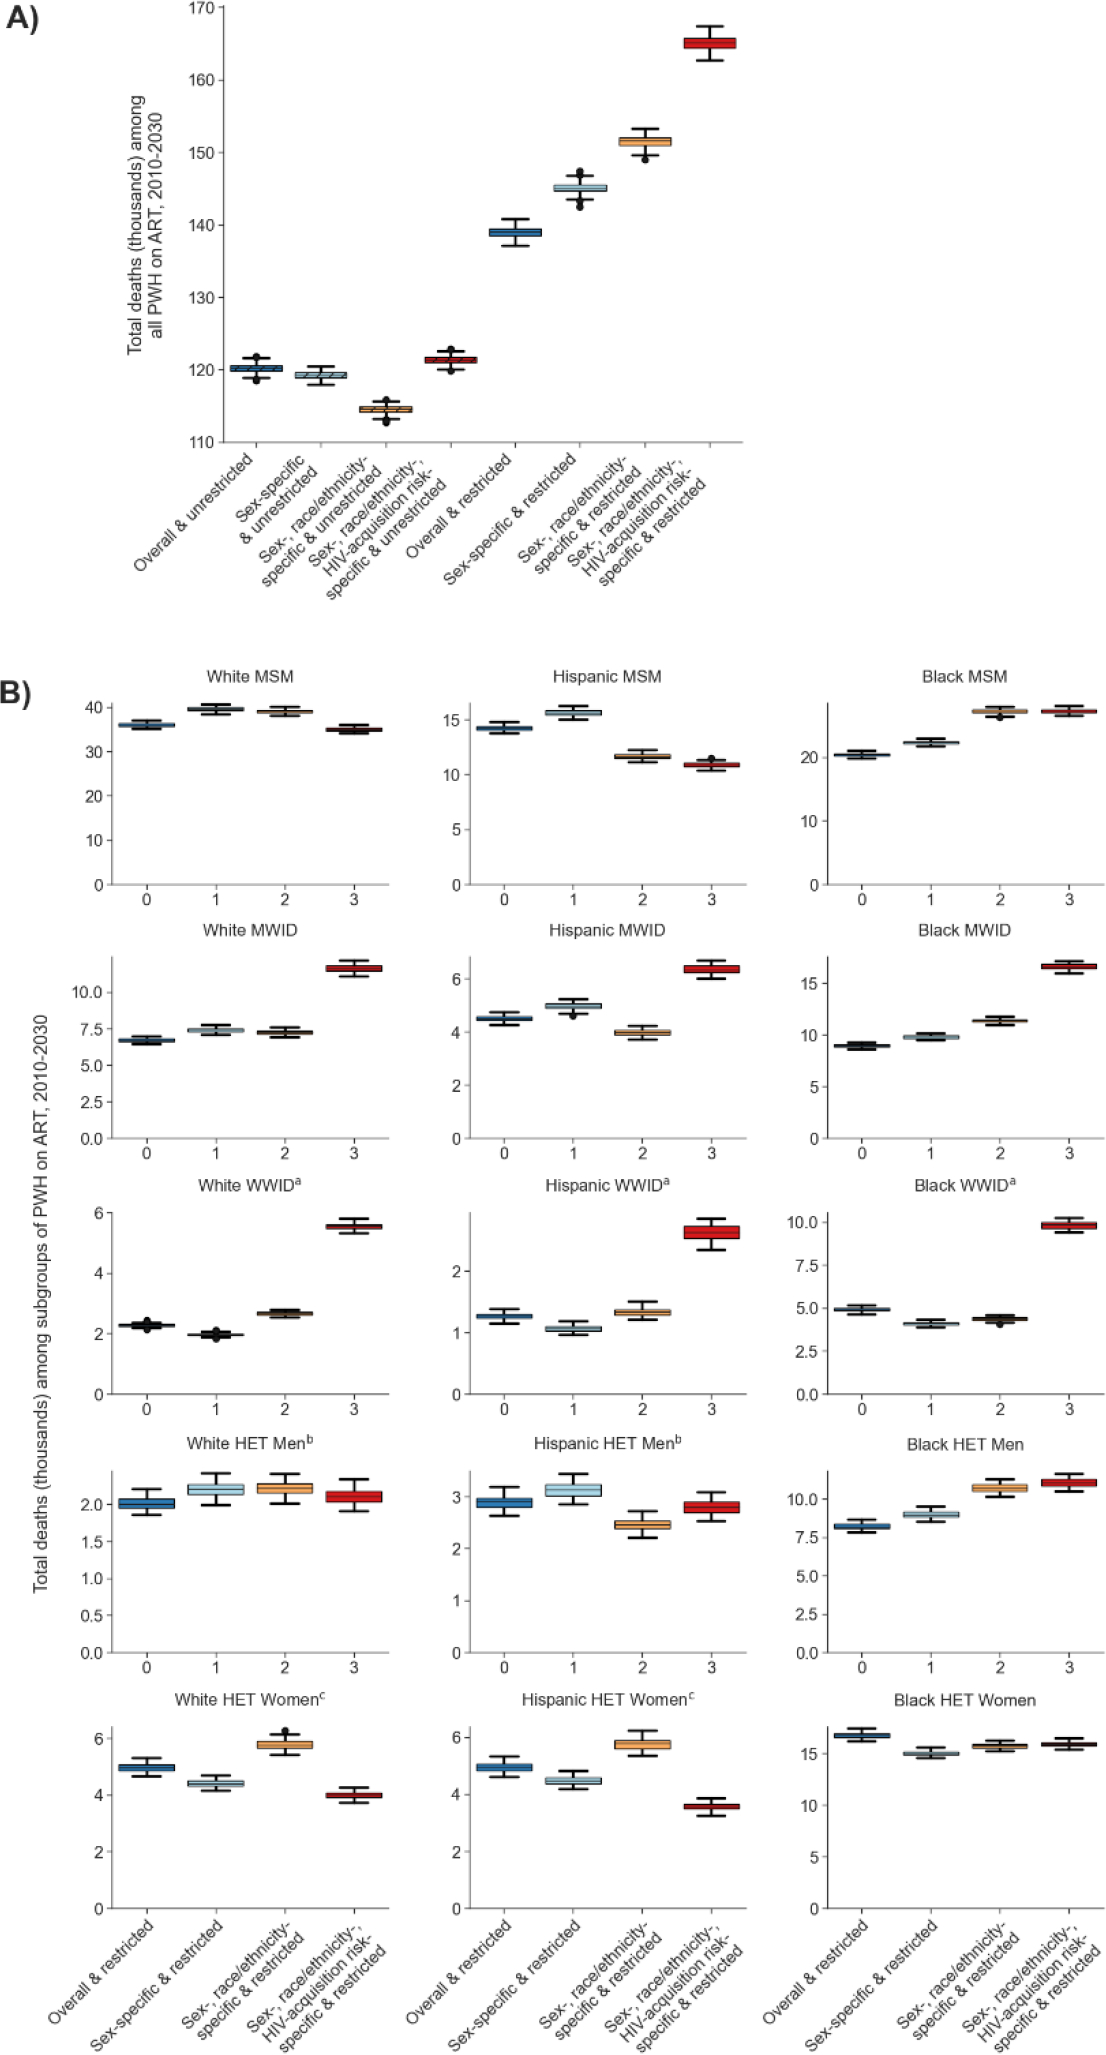
Methods: Using an agent-based simulation of PWH in the United States, we examined the impact of distinct approaches to parametrizing mortality rates on forecasted epidemiology of PWH on antiretroviral treatment (ART). We first estimated mortality rates among (1) all PWH, (2) sex-specific, (3) sex-and-race/ethnicity-specific, and (4) sex-race/ethnicity-and-HIV-acquisition-risk-specific subgroups. We then assessed each scenario by (1) allowing unrestricted reductions in age-specific mortality rates over time and (2) restricting the mortality rates among PWH to subgroup-specific mortality thresholds from the general population.
Results: Among the eight scenarios examined, those lacking subgroup-specific heterogeneities and those allowing unrestricted reductions in future mortality rates forecasted the lowest number of deaths among all PWH and 9 of the 15 subgroups through 2030. The forecasted overall number and age distribution of people with a history of injection drug use were sensitive to inclusion of subgroup-specific mortality rates.
Conclusions: Our results underscore the potential risk of underestimating future deaths by models lacking subgroup-specific heterogeneities in mortality rates, and those allowing unrestricted reductions in future mortality rates.
Keywords: Aging; Computer simulation; HIV; Hispanic ethnicity; Mortality; People who inject drugs; Racial disparities.
Copyright © 2023 Elsevier Inc. All rights reserved.
Conflict of interest statement
Declaration of Competing Interest The authors declare the following financial interests/personal relationships which may be considered as potential competing interests: Parastu Kasaie reports financial support was provided by National Institutes of Health. Keri Althof reports financial support was provided by National Institutes of Health. Emily Hyle reports financial support was provided by National Institutes of Health. Lauren Zalla reports financial support was provided by National Institutes of Health. Anthony Fojo reports financial support was provided by National Institutes of Health. Emily Hyle reports financial support was provided by Massachusetts General Hospital. Keri Althoff reports a relationship with TrioHealth that includes: board membership. KNA reports serving on the Scientific Advisory Board for TrioHealth Inc. and as a consultant to the All of Us Study (National Institutes of Health). PFR reports serving as a consultant for Gilead and Janssen Pharmaceuticals. Kelly Gebo is a consultant for Teach for America and the Aspen Institute and was an unpaid representative to a scientific Advisory Board for Pfizer. LCZ reports serving as a consultant for Carelon. None of these have direct relation to, or impact on, the findings presented here. All other authors declare no conflicts of interest.
Figures


References
-
- Althoff KN, Chandran A, Zhang J, Arevalo WM, Gange SJ, Sterling TR, et al. Life-expectancy disparities among adults with HIV in the United States and Canada: the impact of a reduction in drug- and alcohol-related deaths using the lives saved simulation model. American journal of epidemiology. 2019;188(12):2097–109. - PMC - PubMed
-
- Centers for Disease Control and Prevention (CDC). NCHHSTP AtlasPlus 2022. [Available from: https://www.cdc.gov/nchhstp/atlas/index.htm.
-
- Johnson LF, White PJ. A review of mathematical models of HIV/AIDS interventions and their implications for policy. Sexually transmitted infections. 2011;87(7):629–34. - PubMed
Publication types
MeSH terms
Grants and funding
- R01 DA011602/DA/NIDA NIH HHS/United States
- K23 EY013707/EY/NEI NIH HHS/United States
- Z01 CP010176/ImNIH/Intramural NIH HHS/United States
- G12 MD007583/MD/NIMHD NIH HHS/United States
- UL1 RR024131/RR/NCRR NIH HHS/United States
- U01 HL146192/HL/NHLBI NIH HHS/United States
- U01 AI069432/AI/NIAID NIH HHS/United States
- R01 MD018539/MD/NIMHD NIH HHS/United States
- U01 HL146201/HL/NHLBI NIH HHS/United States
- U01 AA020790/AA/NIAAA NIH HHS/United States
- KL2 TR000421/TR/NCATS NIH HHS/United States
- K01 AI131895/AI/NIAID NIH HHS/United States
- U01 HL146241/HL/NHLBI NIH HHS/United States
- R01 AA016893/AA/NIAAA NIH HHS/United States
- N01 CP001004/CP/NCI NIH HHS/United States
- P30 AI027767/AI/NIAID NIH HHS/United States
- P30 AI050409/AI/NIAID NIH HHS/United States
- U01 HL146333/HL/NHLBI NIH HHS/United States
- F31 AI124794/AI/NIAID NIH HHS/United States
- P30 MH062246/MH/NIMH NIH HHS/United States
- U01 AI069434/AI/NIAID NIH HHS/United States
- P30 AI094189/AI/NIAID NIH HHS/United States
- U01 HL146245/HL/NHLBI NIH HHS/United States
- K24 DA000432/DA/NIDA NIH HHS/United States
- U01 HL146205/HL/NHLBI NIH HHS/United States
- U01 DA036935/DA/NIDA NIH HHS/United States
- K08 MH118094/MH/NIMH NIH HHS/United States
- U01 AI038855/AI/NIAID NIH HHS/United States
- U01 HL146208/HL/NHLBI NIH HHS/United States
- U54 MD007587/MD/NIMHD NIH HHS/United States
- R24 AI067039/AI/NIAID NIH HHS/United States
- U01 HL146242/HL/NHLBI NIH HHS/United States
- U01 AI038858/AI/NIAID NIH HHS/United States
- U10 EY008057/EY/NEI NIH HHS/United States
- U01 AI068636/AI/NIAID NIH HHS/United States
- U01 HL146193/HL/NHLBI NIH HHS/United States
- U10 EY008052/EY/NEI NIH HHS/United States
- UL1 TR002378/TR/NCATS NIH HHS/United States
- P30 AI110527/AI/NIAID NIH HHS/United States
- R34 DA045592/DA/NIDA NIH HHS/United States
- P30 AI027763/AI/NIAID NIH HHS/United States
- K01 AI093197/AI/NIAID NIH HHS/United States
- U01 AI069918/AI/NIAID NIH HHS/United States
- K24 AI118591/AI/NIAID NIH HHS/United States
- K24 AI065298/AI/NIAID NIH HHS/United States
- U01 AA013566/AA/NIAAA NIH HHS/United States
- N02 CP055504/CP/NCI NIH HHS/United States
- UL1 TR000083/TR/NCATS NIH HHS/United States
- T32 AI102623/AI/NIAID NIH HHS/United States
- P30 AI027757/AI/NIAID NIH HHS/United States
- U01 HL146204/HL/NHLBI NIH HHS/United States
- R01 DA012568/DA/NIDA NIH HHS/United States
- U01 HL146202/HL/NHLBI NIH HHS/United States
- UL1 TR000004/TR/NCATS NIH HHS/United States
- U01 HL146240/HL/NHLBI NIH HHS/United States
- F31 DA037788/DA/NIDA NIH HHS/United States
- R01 AG069575/AG/NIA NIH HHS/United States
- R56 AG081148/AG/NIA NIH HHS/United States
- R01 AG053100/AG/NIA NIH HHS/United States
- U10 EY008067/EY/NEI NIH HHS/United States
- P30 AI036219/AI/NIAID NIH HHS/United States
- U01 HL146194/HL/NHLBI NIH HHS/United States
- U24 AA020794/AA/NIAAA NIH HHS/United States
- U01 HL146203/HL/NHLBI NIH HHS/United States
- U01 AI068634/AI/NIAID NIH HHS/United States
- P30 AI050410/AI/NIAID NIH HHS/United States
- K01 AI138853/AI/NIAID NIH HHS/United States
LinkOut - more resources
Full Text Sources
Medical
