. 2023 Sep 23;14(1):5943.
doi: 10.1038/s41467-023-41630-x.

Bifidobacteria shape antimicrobial T-helper cell responses during infancy and adulthood

Affiliations

Bifidobacteria shape antimicrobial T-helper cell responses during infancy and adulthood

Katrin Vogel et al. Nat Commun. .

Abstract

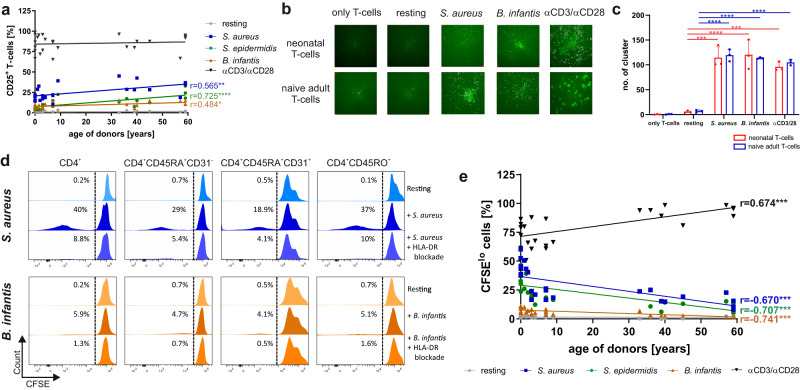
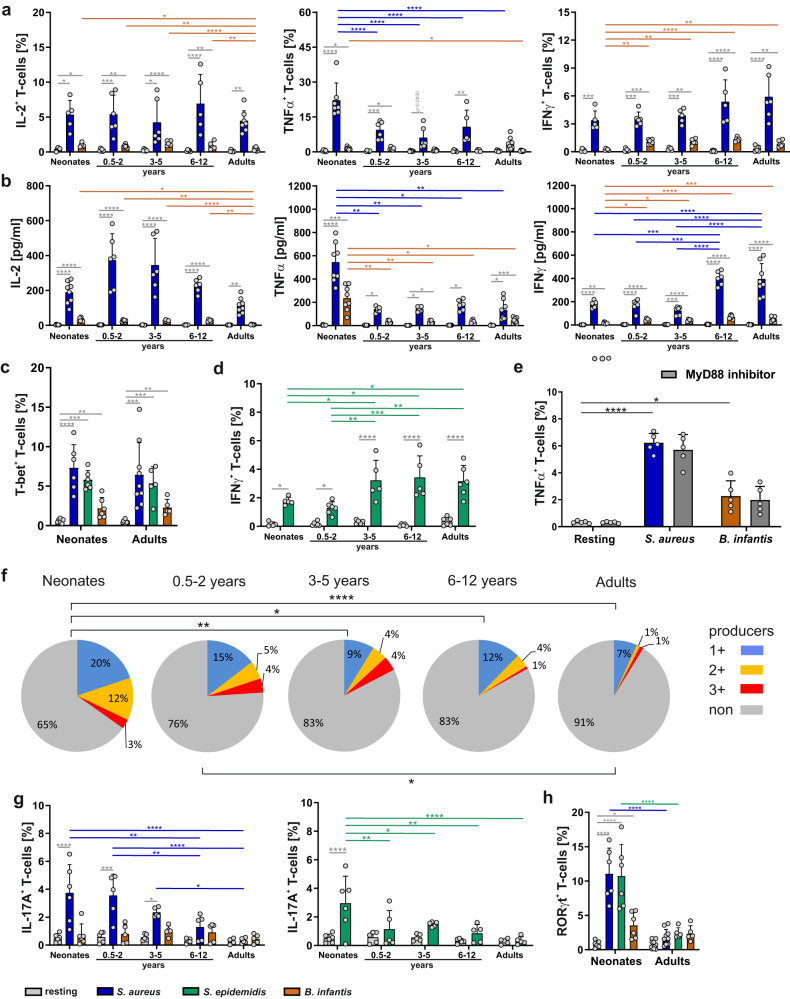
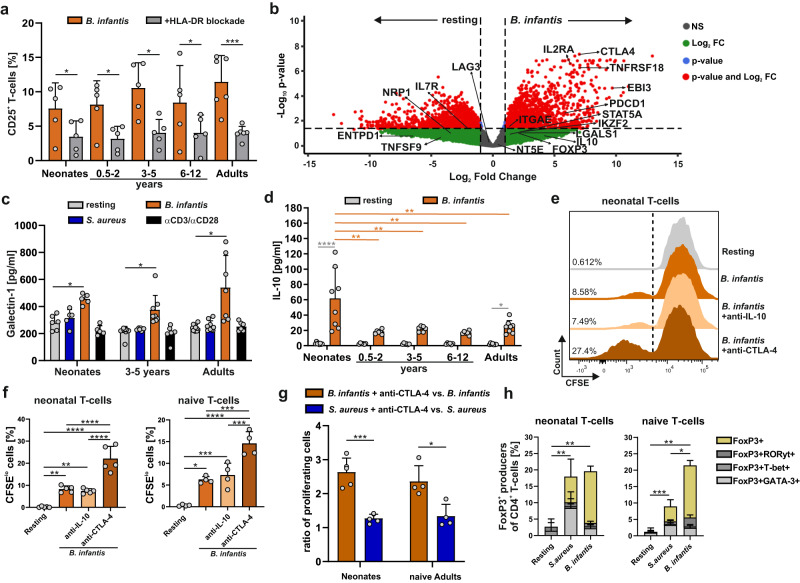
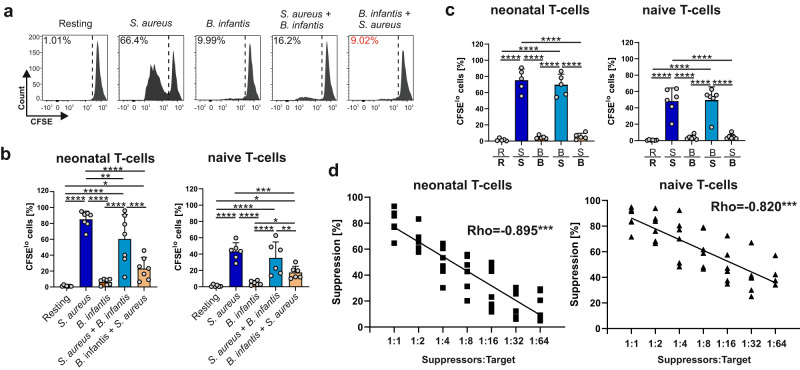
Microbial infections early in life are challenging for the unexperienced immune system. The SARS-CoV-2 pandemic again has highlighted that neonatal, infant, child, and adult T-helper(Th)-cells respond differently to infections, and requires further understanding. This study investigates anti-bacterial T-cell responses against Staphylococcus aureus aureus, Staphylococcus epidermidis and Bifidobacterium longum infantis in early stages of life and adults and shows age and pathogen-dependent mechanisms. Beside activation-induced clustering, T-cells stimulated with Staphylococci become Th1-type cells; however, this differentiation is mitigated in Bifidobacterium-stimulated T-cells. Strikingly, prestimulation of T-cells with Bifidobacterium suppresses the activation of Staphylococcus-specific T-helper cells in a cell-cell dependent manner by inducing FoxP3+CD4+ T-cells, increasing IL-10 and galectin-1 secretion and showing a CTLA-4-dependent inhibitory capacity. Furthermore Bifidobacterium dampens Th responses of severely ill COVID-19 patients likely contributing to resolution of harmful overreactions of the immune system. Targeted, age-specific interventions may enhance infection defence, and specific immune features may have potential cross-age utilization.


Conflict of interest statement

The authors declare no competing interests.

Figures

Fig. 1
Fig. 1. Bacteria-specific T-cell activation.
a After 3-day incubation of monocytes previously matured with h.i. S. aureus (blue), h.i. S. epidermidis (green), or h.i. B. infantis (orange) and naïve T-cells or naïve T-cells stimulated with anti-CD3/CD28 (black), the frequency of CD25-expressing CD4+ T-cells from neonates, infants, children, and adults was measured by flow cytometry and plotted against age. b Purified naïve (CD4+CD45RA+CD31+) T-cells from neonates and adults were labeled with CSFE and co-cultured for 3 days with monocytes matured with h.i. S. aureus or h.i. B. infantis or anti-CD3/CD28 as indicated. CFSE-labeled cells were counted using the ImmunoSpot S6 ULTIMATE UV Image Analyzer to determine the number of cell clusters formed after stimulation. c Bar graphs show the number of clusters formed by three different donors. Each dot represents a different donor. Error bars in the figures denote mean + SD. *p < 0.05, **p < 0.01, ***p < 0.001, ****p < 0.0001 as determined by one-way ANOVA with Holm–Sidak post hoc test. Detailed statistical data are provided in Supplementary Table 5. d The indicated T-cell subsets of a representative adult donor were co-cultured with monocytes matured with h.i. S. aureus-antigen or h.i. B. infantis-antigen in the presence or absence of HLA-DR blocking antibody. Flow cytometry measured the proliferation of CD4+, CD4+CD45RA+, CD4+CD45RO+, and CD4+CD45RA+CD31+ T-cells after 3 days of stimulation. Data are representative of five donors. e Frequency of proliferating (CFSElo) cells of T-cells from neonates, infants, children, and adults that were stimulated for 3 days with h.i. S. aureus (blue), h.i. S. epidermidis (green), h.i. B. infantis (orange) or anti-CD3/CD28 (black), determined by flow cytometry and plotted against donors age. Cumulative results are shown, and each dot represents one donor (a, c, e). Correlation analyses were performed using Pearson’s correlation. Pearson’s correlation coefficient r is shown with *** representing p < 0.001. All data shown are representative of at least three experiments performed with T-cells from different donors. Source data are provided as a Source Data file.
Fig. 2
Fig. 2. Bacteria-specific cytokine expression by T-cells from different age groups.
a Frequency of T-cells from neonates, infants, children, and adults expressing intracellular IL-2, TNF-α, or IFN-γ after stimulation with S. aureus (blue), S. epidermidis (green), or B. infantis (orange) matured monocytes for 3 days was determined by flow cytometry. b Determination of IL-2, TNF-α, or IFN-γ cytokine release from CD4+CD45RA+CD31+ T-cells, which were either stimulated or resting for 3 days. c T-cells from neonates and adults stimulated with S. aureus, S. epidermidis, or B. infantis matured monocytes for 3 days. Expression of transcription factor T-bet was determined by flow cytometry. d Frequency of T-cells stimulated with S. epidermidis matured monocytes expressing intracellular IFN-γ. e After MyD88-inactivation during adult CD4+CD45RA+CD31+ T-cells stimulation against S. aureus or B. infantis using the specific inhibitor Pepinh-MYD, intracellular cytokine expression of TNF-α was determined by flow cytometry and the frequency of these cells is shown as a bar graph. f CD4+CD45RA+CD31+ T-cells were stimulated with S. aureus, and the cells expressing single or multiple cytokines IL-2, TNF-α, and IFN-γ were determined by flow cytometry, analyzed by Boolean gating and shown as a fraction of all CD4+ T-cells in a pie chart. The subsets that simultaneously express no (gray), one (blue), two (yellow), or three (red) different cytokines are grouped by color. Data are representative of five donors. *p < 0.05, **p < 0.01, ***p < 0.001, ****p < 0.0001 as determined by Fisher exact test. g Bar graphs showing the frequency of CD4+CD45RA+CD31+ T-cells expressing intracellular IL-17A after 3 days of stimulation with either S. aureus, B. infantis (left bar graph), or S. epidermidis (right bar graph) matured monocytes. h Neonatal and adult CD4+CD45RA+CD31+ T-cells were stimulated with S. aureus, S. epidermidis, or B. infantis matured monocytes for 3 days, and the cells expressing the transcription factor RORγt were determined by flow cytometry. Error bars in the figures (ae) and (g, h) indicate mean + SD, n  ≥  5 donors from at least 3 independent experiments in each age group, p-values in (ae) and (g, h) are calculated by Kruskal Wallis test corrected by Dunn’s post hoc test, *p < 0.05, **p < 0.01, ***p < 0.001, ****p < 0.0001. Detailed statistical data are provided in Supplementary Tables 6–13. Source data are provided as a Source Data file.
Fig. 3
Fig. 3. B. infantis-specific human T-cell response.
a CD25 expression of naïve T-cells from neonates, infants, children, and adults in response to h.i. B. infantis matured monocytes for 3 days in the presence or absence of HLA-DR blocking antibody. b Volcano plot of RNASeq analysis showing differentially expressed RNA in neonatal T-cells in response to h.i. B. infantis-antigens. Three days after the beginning of the stimulation, T-cells were enriched using MACSQuantTyto, RNA was prepared, and RNASeq was performed as described in Materials and Methods. Red dots indicate genes that are significantly differentially regulated, while green dots indicate genes that are differentially regulated but not significantly. Data are representative of four donors. c Galectin-1 release from T-cells of neonates, children, and adults after 3 days of stimulation, as indicated, was measured by ELISA assay. d Determination of IL-10 cytokine release from CD4+CD45RA+CD31+ T-cells of neonates, infants, and children or adults either stimulated or resting for 3 days by LEGENDplex. e CFSE dilution profiles of neonatal CD4+CD45RA+CD31+ T-cells after 3 days of stimulation with monocytes matured with h.i. B. infantis-antigen in the presence or absence of anti-IL-10 antibody or anti- CTLA-4 antibody. f Bar graphs showing the frequency of CFSElo T-cells from neonates (left) and of naïve T-cells from adults (right) as determined by flow cytometry. g Bar graph showing the ratio of proliferating (CFSElo) T-cells in response to h.i. B. infantis-antigens (orange) or h.i. S. aureus-antigens (blue) in the presence of anti-CTLA-4 antibody and in response to B. infantis-antigens or S. aureus-antigens alone. h Frequencies of T-cells expressing intracellular FoxP3 (yellow), FoxP3/RORγt (dark gray), FoxP3/T-bet (middle gray), and FoxP3/GATA-3 (light gray) were measured by flow cytometry after 3 days of stimulation, analyzed by Boolean gating and presented as fractions of cells expressing transcription factors in a stacked bar chart. Error bars in the figures (a, c, d, f, g) denote mean + SD, n  ≥  5 donors from at least 3 independent experiments in each age group, p-values in (a, c, d, f, g) are calculated by one-way ANOVA followed by Holm–Sidak post hoc test, *p < 0.05, **p < 0.01, ***p < 0.001, ****p < 0.0001. Detailed statistical data are provided in Supplementary Tables 14–22. Source data are provided as a Source Data file.
Fig. 4
Fig. 4. B. infantis’s role in mediating suppression.
a Purified CD4+CD45RA+CD31+ T-cells of neonates were labeled with CSFE and co-cultured for 3 days with S. aureus- or B. infantis-matured monocytes. T-cells were further cultured for 3 days with monocytes that had been equally loaded or cross-loaded. CFSE dilution profiles on day 3 after stimulation. Data are representative of four donors out of two experiments. be Neonatal and adult CD4+CD45RA+CD31+ T-cells, as well as adult CD4+CD45RO+ T-cells were stimulated as in (a). Frequency of proliferating (CFSElo) T-cells (b), of T-cells expressing CD25 (c), or the sum of T-cells expressing intracellular IL-2, TNF-α, and IFN-γ (d) was determined by flow cytometry and concentrations of galectin-1 in supernatants (e) using ELISA. Data are representative of four donors out of two experiments in each age group. (f) Purified naïve or memory adult T-cells were labeled with CSFE and co-cultured with monocytes matured with S. epidermidis or B. infantis or both, as indicated. CFSE dilution profiles of a representative neonatal donor on day 3 after stimulation. Data are representative of three donors out of two experiments. g CD4+ T-cells from five patients with severe COVID-19 were co-cultured in three independent experiments with monocytes matured with SARS-CoV-2 peptide pool of nucleocapsid protein or B. infantis or both. Frequency of CFSElo T-cells (left), quantitative IL-10 production by EliSpot analysis (middle), or the sum of T-cells expressing intracellular IL-2, TNF-α, and IFN-γ (right) were determined by flow cytometry and galectin-1 concentrations (h) in supernatants by ELISA. Error bars in figures denote (b, ce, h) mean + SD, n  ≥  4 donors from at least 2 independent experiments in each age group, p-values in (b, ce, h) are calculated by one-way ANOVA corrected by Holm–Sidak post hoc test, *p < 0.05, **p < 0.01, ***p < 0.001, ****p < 0.0001. Detailed statistical data are provided in Supplementary Tables 23–38. i CFSE dilution profiles of CD4+ T-cells from a patient with severe COVID-19 after stimulation with monocytes matured with SARS-CoV-2 peptide pool derived from spike protein or B. infantis or both in the presence or absence of anti-CTLA-4 antibody. Data are representative of four donors out of at least two experiments. Source data are provided as a Source Data file.
Fig. 5
Fig. 5. Regulatory role of B. infantis specific T-cells.
a Purified neonatal CD4+CD45RA+CD31+ T-cells were labeled with CSFE and co-cultured for 3 days with monocytes matured with h.i. S. aureus or living B. infantis as indicated. T-cells were further cultured for 3 days with monocytes that had been equally loaded or cross-loaded. CFSE dilution profiles on day 3 after stimulation. Data are representative of 7 donors from 5 independent experiments. b Neonatal and adult CD4+CD45RA+CD31+ T-cells were stimulated with h.i. S. aureus or living B. infantis for 3 days as in (a). The frequency of proliferating (CFSElo) T-cells was determined by flow cytometry. c Statistical analysis of Transwell assays with purified naïve (CD4+CD45RA+CD31+) T-cells of neonates and adults. Thereby, the content of the upper chamber is indicated above the line, and the content of the lower chamber is indicated below the line. T-cells in the lower chamber were labeled with CFSE and co-cultured for 6 days, followed by analysis by flow cytometry (R—Resting, S—S. aureus, B—B. infantis. Error bars in figures (b, c) denote mean + SD, n ≥ 5 donors from at least 3 independent experiments in each age group, p-values in (b, c) are calculated by one-way ANOVA followed by Holm–Sidak post hoc test, *p < 0.05, **p < 0.01, ***p < 0.001, ****p < 0.0001. Detailed statistical data are provided in Supplementary Tables 39–42. d Neonatal and adult CD4+CD45RA+CD31+ T-cells were co-cultured for 3 days with monocytes matured with h.i. B. infantis, and assayed for suppressive activity using CFSE-labeled resting target T-cells and different ratios of T-cells stimulated prior assay onset for 3 days with B. infantis-matured monocytes. The mix of cells was then stimulated with anti-CD3 antibody in the presence of dendritic cells for 4 days, and proliferating cells were determined based on a decrease in CFSE expression. Percent suppression was calculated based on CFSE dilution of target T-cells in suppression culture. Cumulative results are shown, and each dot represents one donor. Correlation analyses were performed using Spearman´s Rho, with *** representing p < 0.001. The lines show a linear approximation of the logarithmically transformed ratio of T suppressor cells to target cells. The data shown are representative of at least five experiments performed with T-cells from different donors. Source data are provided as a Source Data file.

References

    1. World Health Organization. Children: reducing mortality. Fact sheets. Available at http://www.who.int/en/news-room/fact-sheets/detail/children-reducing-mor... (2017).
    1. Sharma AA, Jen R, Butler A, Lavoie PM. The developing human preterm neonatal immune system: a case for more research in this area. Proc. Natl Acad. Sci. USA. 2012;145:61–68. - PMC - PubMed
    1. Arra A, et al. Immune-checkpoint blockage of CTLA-4 (CD152) in antigen-specific human T-cell responses differs profoundly between neonates, children, and adults. OncoImmunology. 2021;10:1938475. - PMC - PubMed
    1. Hebel K, et al. CD4+ T cells from human neonates and infants are poised spontaneously to run a nonclassical IL-4 program. J. Immunol. 2014;192:5160–5170. - PubMed
    1. Knolle J, et al. Children from the age of three show a developmental switch in T-cell differentiation. Front. Immunol. 2020;11:1640. - PMC - PubMed

Publication types