. 2023 Sep 23;13(1):15924.
doi: 10.1038/s41598-023-40547-1.

An extraocular electrical stimulation approach to slow down the progression of retinal degeneration in an animal model

Affiliations

An extraocular electrical stimulation approach to slow down the progression of retinal degeneration in an animal model

Alejandra Gonzalez Calle et al. Sci Rep. .

Erratum in

Abstract

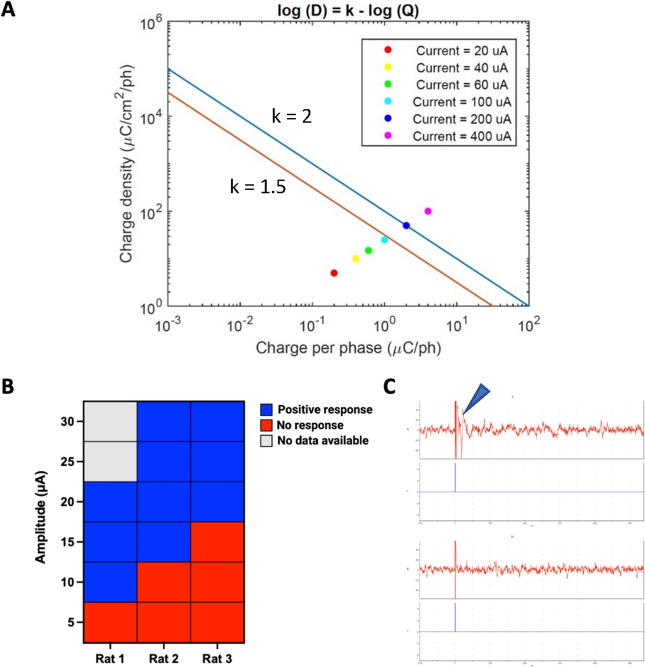
Retinal diseases such as retinitis pigmentosa (RP) and age-related macular degeneration (AMD) are characterized by unrelenting neuronal death. However, electrical stimulation has been shown to induce neuroprotective changes in the retina capable of slowing down the progression of retinal blindness. In this work, a multi-scale computational model and modeling platform were used to design electrical stimulation strategies to better target the bipolar cells (BCs), that along with photoreceptors are affected at the early stage of retinal degenerative diseases. Our computational findings revealed that biphasic stimulus pulses of long pulse duration could decrease the activation threshold of BCs, and the differential stimulus threshold between ganglion cells (RGCs) and BCs, offering the potential of targeting the BCs during the early phase of degeneration. In vivo experiments were performed to evaluate the electrode placement and parameters found to target bipolar cells and evaluate the safety and efficacy of the treatment. Results indicate that the proposed transcorneal Electrical Stimulation (TES) strategy can attenuate retinal degeneration in a Royal College of Surgeon (RCS) rodent model, offering the potential to translate this work to clinical practice.


Conflict of interest statement

The authors declare no competing interests.

Figures

Figure 1
Figure 1
(A) Multi-scale Admittance Method (AM)/NEURON computational platform is capable of constructing a large-scale rat voxel model, representing fine details of the eye, simulating different retinal layers based on their resistivity values, and cellular-level modeling of the retinal network, including retinal ganglion cells (RGCs) and bipolar cells (BCs). This modeling platform can predict the electric fields generated inside the retinal tissue due to transcorneal electrical stimulation (TES) and determine the activation threshold of RGCs and BCs to different electrical stimulation parameters. (B) Schematic representation of the setup used for TES of the RCS rats, MCS: multi-channel stimulation.
Figure 2
Figure 2
(A) Two transcorneal electrical stimulation setups are simulated: TES1 and TES2. For TES1, a stimulating ring and a ground ring electrode are positioned toward the temporal and the nasal side of the eyeball, respectively. For TES2, a stimulating ring electrode is placed on the cornea, and a needle ground electrode is placed on the head towards the temporal side. The results are shown for a slice of the model and the color map represents the voltage distribution (mV) in the tissue, including the retina. These extracellular voltages were extracted from the central retina (the box in the figure) and applied to each compartment in multi-compartment models of RGCs and BCs. For TES1, the voltage gradient is generated laterally along the RGCs axon (lateral stimulation), while the TES2 is maximizing the induced field along the BCs axons and the retinal thickness (vertical stimulation) (B) For both RGCs and BCs, the ratio of stimulation thresholds for TES1 to TES2 is computed for a range of stimulus pulse durations. BCs have a tenfold higher stimulation threshold for TES1 than TES2, whereas, RGCs have a lower stimulation threshold for TES1 than TES2. (C) The strength-duration curves for a range of pulse durations from 0.1 to 25 ms for both monophasic and biphasic stimulus pulses. Results suggest that long biphasic pulse durations can augment the chance for the excitations of BCs and reduce the differential stimulation threshold of RGCs and BCs.
Figure 3
Figure 3
(A) A Shannon safety curve (charge density per phase versus charge per phase for a range of current amplitude) indicated that using current amplitudes up to 100 µA (light blue dot) allows the safe delivery of electrical stimulation to the eye. The estimation of the boundary between safe and unsafe injected charge into the tissue can be approximated using the equation log(D) = k − log(Q), where D represents the charge density, Q represents the charge per phase, and k is the parameter determining the damage boundary. The blue line corresponds to k = 2, indicating the region where tissue damage is observed. Conversely, the red line represents k = 1.5, indicating the threshold below which no damage was observed. (B) Electrically evoked responses recorded from the superior colliculus of three RCS rats showed a threshold response of 5, 10, and 15 μA respectively. (C) Superior colliculus electrophysiology. Top—representative graphs of electrically evoked SC activity (arrow), bottom—absence of apparent light evoked SC responses in the above animal.
Figure 4
Figure 4
(A) Area analysis of hypopigmentation in the degenerated retina in autofluorescence fundoscopy images (20 μA group n = 5, 50 μA group n = 5, 100 μA group n = 5) showed no significant difference between the stimulated and control eye in 20 μA (i) and 50 μA (ii) groups. A 73% reduction in the area of retinal degeneration was observed in the stimulated eye compared to the control one in the 100 μA group (iii). (B) Photoreceptor count analysis in H&E-stained retinas (20 μA group n = 3, 50 μA group n = 3, 100 μA group n = 4) showed no significant difference between the stimulated and control eye in 20 μA (i) and 50 μA (ii) groups. A 38.3% PR count increase was observed in the stimulated eye compared to the control one in the 100 μA group (iii). (*< p 0.05, **< p 0.01, scale bar, 100μm).

References

    1. Wang AL, Knight DK, Vu TT, Mehta MC. Retinitis Pigmentosa: Review of current treatment. Int. Ophthalmol. Clin. 2019;59(1):263–280. doi: 10.1097/IIO.0000000000000256. - DOI - PubMed
    1. Zhang Q. Retinitis pigmentosa: Progress and perspective. Asia Pac. J. Ophthalmol. 2016;5:265–271. doi: 10.1097/APO.0000000000000227. - DOI - PubMed
    1. Hamel C. Retinitis pigmentosa. Orphanet J. Rare Dis. 2006;1:40–52. doi: 10.1186/1750-1172-1-40. - DOI - PMC - PubMed
    1. Daiger SP, Sullivan LS, Bowne SJ. Genes and mutations causing retinitis pigmentosa. Clin. Genet. 2013;84:132–141. doi: 10.1111/cge.12203. - DOI - PMC - PubMed
    1. Lan Y, et al. Retina–electrode interface properties and vision restoration by two generations of retinal prostheses in one patient—one in each eye. J. Neural Eng. 2020;17:026020. doi: 10.1088/1741-2552/ab7c8f. - DOI - PubMed