. 2023 Sep 23;14(1):5937.
doi: 10.1038/s41467-023-41638-3.

A sign-inverted receptive field of inhibitory interneurons provides a pathway for ON-OFF interactions in the retina

Affiliations

A sign-inverted receptive field of inhibitory interneurons provides a pathway for ON-OFF interactions in the retina

Andrew Jo et al. Nat Commun. .

Abstract

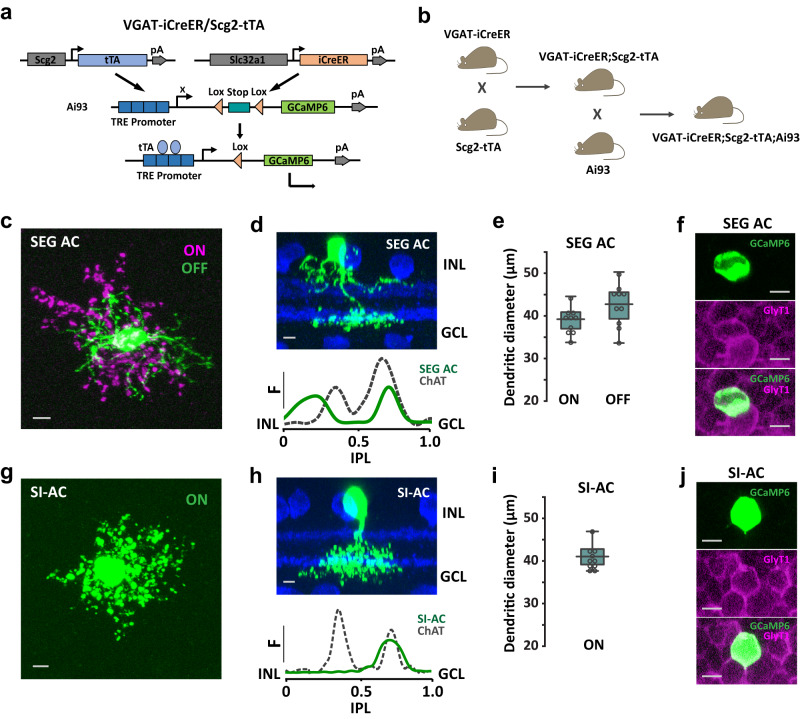
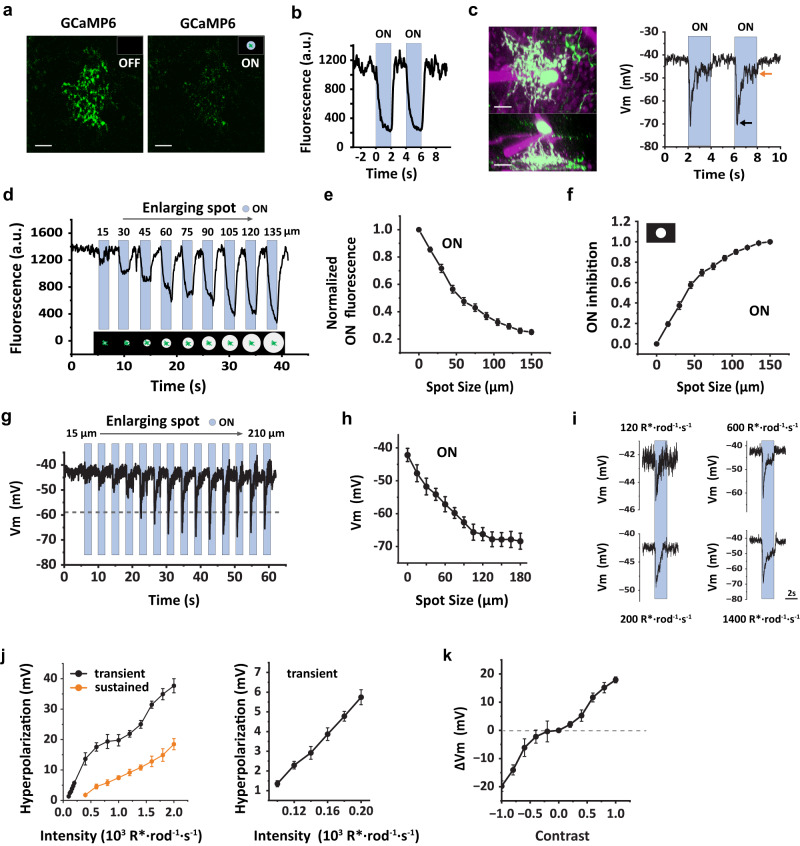
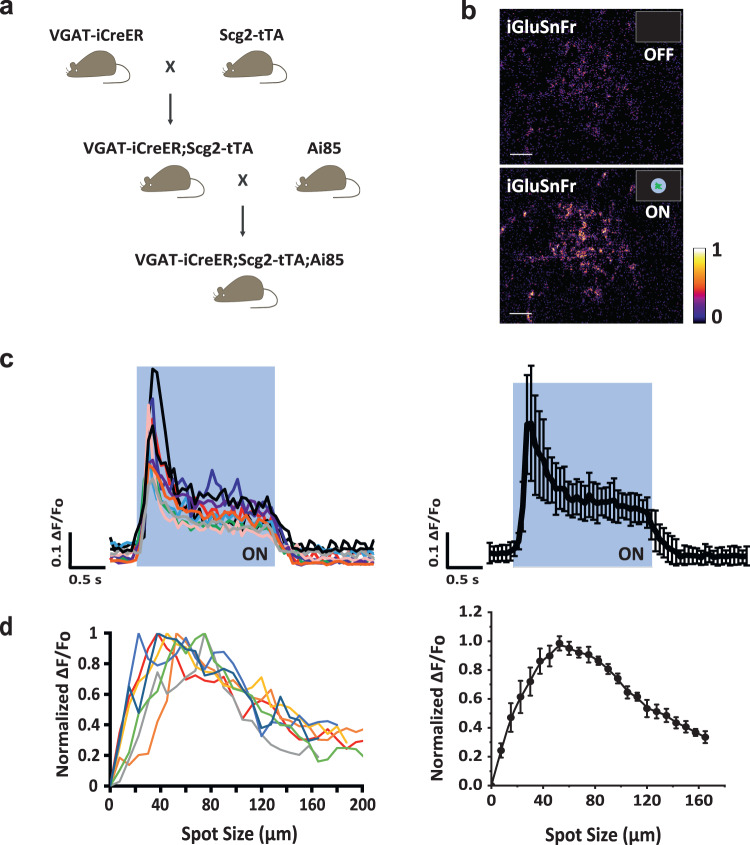
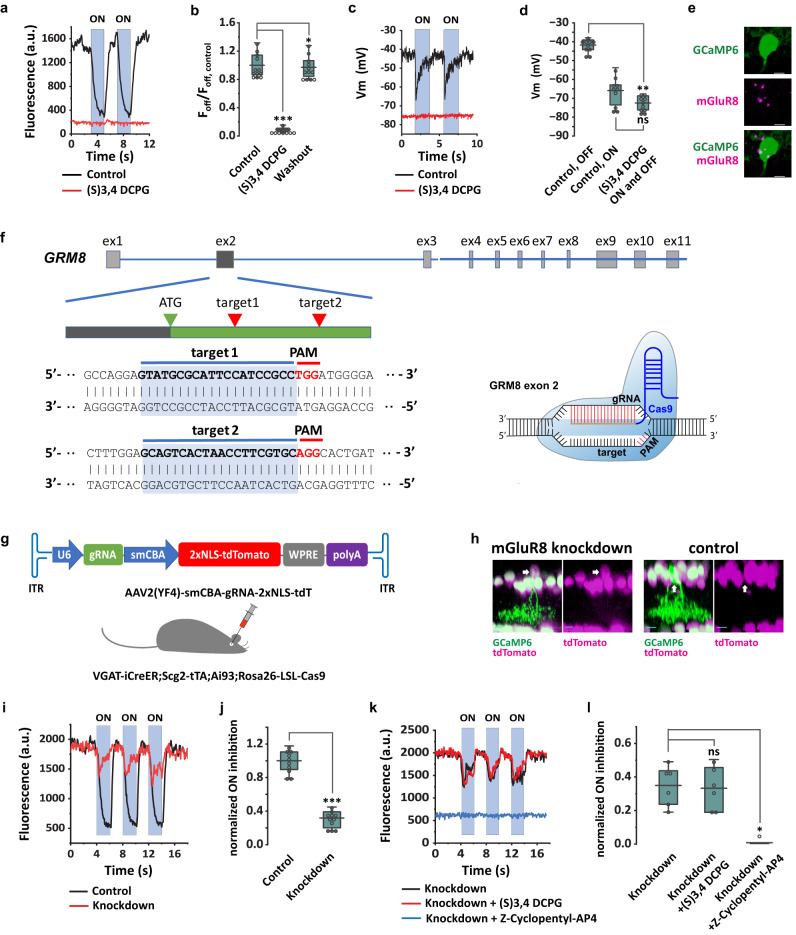
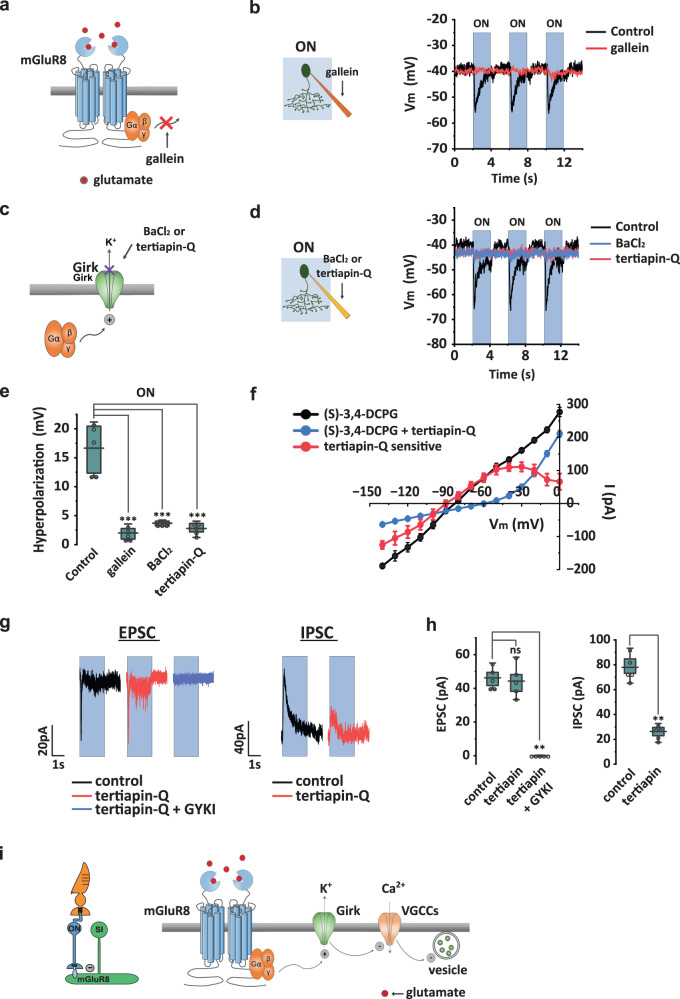
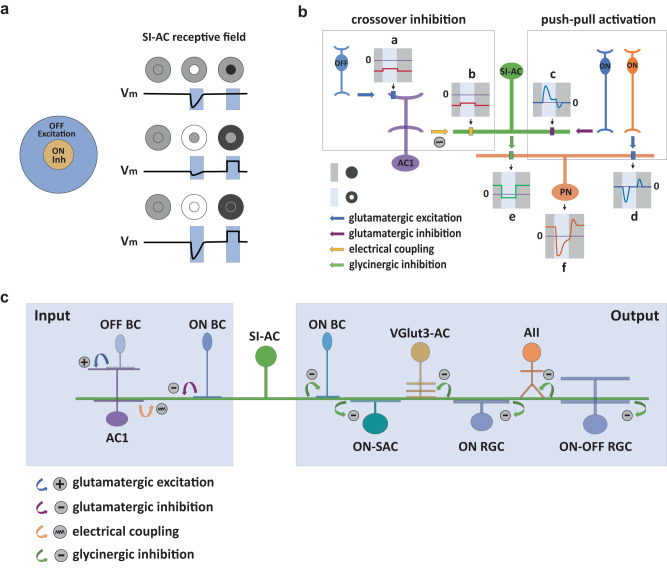
A fundamental organizing plan of the retina is that visual information is divided into ON and OFF streams that are processed in separate layers. This functional dichotomy originates in the ON and OFF bipolar cells, which then make excitatory glutamatergic synapses onto amacrine and ganglion cells in the inner plexiform layer. We have identified an amacrine cell (AC), the sign-inverting (SI) AC, that challenges this fundamental plan. The glycinergic, ON-stratifying SI-AC has OFF light responses. In opposition to the classical wiring diagrams, it receives inhibitory inputs from glutamatergic ON bipolar cells at mGluR8 synapses, and excitatory inputs from an OFF wide-field AC at electrical synapses. This "inhibitory ON center - excitatory OFF surround" receptive-field of the SI-AC allows it to use monostratified dendrites to conduct crossover inhibition and push-pull activation to enhance light detection by ACs and RGCs in the dark and feature discrimination in the light.


Conflict of interest statement

The authors declare no competing interests.

Figures

Fig. 1
Fig. 1. Two new AC types identified in VGAT-iCreER;Scg2-tTA;Ai93 mice.
a Schematic representation of the VGAT-iCreER/Scg2-tTA intersectional strategy for labeling ACs in the Scg2-tTA driver. The reporter/effector, here GCaMP6f, is only activated in cells expressing both Cre and tTA. b Triple transgenic mouse breeding scheme for labeling the VGAT-iCreER/Scg2-tTA intersection. cj SEG AC and SI-AC were identified after applying Tamoxifen in adults (8–12 weeks). c Collapsed confocal stack of a flatmount view of SEG AC showing processes that ramify in the ON (red) and OFF (green) IPL sublaminas. Scale bar, 5 µm. d Transversal view of SEG AC (top), with the dendritic tree fluorescence profile across the IPL (bottom; 0 = INL, 1.0 = GCL). ChAT-positive (blue) bands serve as fiducial markers. INL: the inner nuclear layer. GCL: the ganglion cell layer. IPL: the inner plexiform layer. Scale bar, 5 µm. e Dendritic tree diameters of SEG AC in the ON- and OFF-sublaminas (average of 10 cells, error bars: SEM). f A GCaMP6f-positive SEG AC colocalized with labeling for the GlyT1 glycine transporter. Scale bars, 5 µm. g Collapsed confocal stack of a flatmount view of SI-AC showing processes that ramify in the ON IPL sublamina. Scale bar, 5 µm. h Transversal view of SI-AC (top) and dendritic profile (bottom). ChAT: blue. Scale bar, 5 µm. i Dendritic tree diameter of SI-AC in the ON-sublamina (average of 10 cells, error bars: SEM). j A GCaMP6f-positive SI-AC colocalized with labeling for the GlyT1 glycine transporter. Scale bars, 5 µm. d, h F: fluorescence. e, i The box plots display the mean, 25th, and 75th percentiles, while the whiskers indicate the 1.5 interquartile range. Source data are provided as a Source Data file. c, d, fh, j Experiments were replicated independently in at least 30 cells with similar results.
Fig. 2
Fig. 2. SI-AC was activated in the dark and inhibited by the light.
a, b Two-photon GCaMP6f fluorescence in SI-AC dendrites was high in the dark (OFF) but decreased when stimulated a spot of light (100 µm diameter, 100% contrast) was presented in the center of the receptive field. Blue bars represent light presentation. Scale bars, 10 µm. Experiments were replicated independently in at least 40 cells with similar results. c SI-AC was targeted for whole-cell recording (left upper panel, flat-mount view, lower panel, side view). Membrane potential was depolarized in the dark and hyperpolarized by light (100 µm dia. spot, right). Black arrow: transient hyperpolarization. Orange arrow: sustained hyperpolarization. Scale bars, 10 µm. Experiments were replicated independently in at least 30 cells with similar results. d GCaMP6f fluorescence as a function of light spot diameter. Larger spots cause larger fluorescence decreases (100% contrast on a dark background, SI-AC dendritic field indicated in green, illustrated below). e Decrease in normalized fluorescence as a function of spot diameter (average of 27 cells, error bars: SEM). f Spatial profile of ON inhibition calculated from e. ON inhibition = (F0F)/(F0F150) where the subscript denotes spot diameter. Error bars: SEM. g Whole-cell recording of membrane potential as a function of light spot diameter. h Plot of peak response as a function of spot diameter (average of 9 cells, error bars: SEM). i Whole-cell recording of membrane potential in response to a light spot (100 µm) at different intensity. j Left: plot of light-evoked transient and sustained hyperpolarization as a function of intensity (average 5 cells, error bar: SEM). The boxed region is enlarged on the right. k Contrast sensitivity at the background light level (1000 R*/rod/s) for whole-cell recording (average 5 cells, error bar: SEM). Experiments were performed in VGAT-iCreER;Scg2-tTA;Ai93 mice.
Fig. 3
Fig. 3. SI-AC received direct glutamatergic inputs from ON bipolar cells.
a Triple transgenic breeding scheme for expressing iGluSnFr in SI-AC. Ai85 is a Cre/tTA dependent-iGluSnFr reporter mouse line. b Two-photon iGluSnFr fluorescence in SI-AC dendrites in the dark (OFF) and when a spot of light (60 µm, 100% contrast) was applied to the center of a black background (0% contrast) (ON). Scale bar, 10 µm. Response is presented using min-max normalization, the color bar corresponds to a range of 0 to 1. Experiments were replicated independently in at least 20 cells with similar results. c Left: iGluSnFr spot responses for 10 cells shown in different colors. Right: average response (error bars: SD). d Left: Individual spatial profiles of seven cells (shown in different colors). Right: Averaged spatial profile (error bars: SEM). Fluorescence values were the averages across the dendritic field.
Fig. 4
Fig. 4. ON inhibition in SI-AC is mediated by mGluR8.
a (S) 3,4 DCPG (0.5 µM), a selective mGluR8 agonist, abolished GCaMP6f responses in the dark and light. b Effect of (S) 3,4 DCPG on the GCaMP6f signal in the dark, n = 12 cells for all. ***p = 4.8E-4, *p = 0.016, Wilcoxon Signed Rank test, two-tailed. c (S) 3,4 DCPG hyperpolarized the membrane potential and blocked the ON response. d Effect of (S) 3,4 DCPG on the membrane potential (n = 10 cells), **p = 0.0020, ns: p = 0.064, Wilcoxon Signed Rank test, two-tailed. e In situ hybridization confirmed the mGluR8 expression in SI-AC. Scale bar, 5 µm. f CRISPR design for mGluR8 knockdown. Exon2 of GRM8 gene contained the guide RNA (gRNA) targets. g AAV2(YF4) encoding Grm8 exon2 gRNA and the 2xNLS-tdTomato nuclear marker (top) was injected into Cas9 mice. h SI-AC with mGluR8 knockdown expressed both GCaMP6 and tdTomato (arrow), while control SI-AC only expressed GCaMP6f. Scale bar: 10 µm. i GCaMP6f responses in control (black) and mGluR8 knockdown (red) cells. j Effect of mGluR8 knockdown on the ON inhibition, n = 10 cells for control, n = 11 cells for knockdown. ON inhibition = (FOFFFON)/FOFF, normalized to control. ***p = 1.2E-4, Mann-Whitney Test, two-tailed. k GCaMP6f responses in mGluR8 knockdown were not affected by (S)−3,4-DCPG but were blocked by Z-Cyclopentyl-AP4 (50 µM), n = 6 cells for all. l Effect of 3,4 DCPG and Z-Cyclopentyl-AP4 on the ON inhibition (normalized to control) in mGluR8 knockdown, n = 6 cells for all. ns: p = 0.63, *p = 0.031, Wilcoxon Signed Rank test, two-tailed. a, c, i, k ON responses were evoked with 60 µm light spot. b, d, j, l the box plots display the mean, 25th, and 75th percentiles, while the whiskers indicate the 1.5 interquartile range. Source data are provided as a Source Data file. ae were performed on VGAT-iCreER;Scg2-tTA;Ai93 mice. fl were performed on VGAT-iCreER;Scg2-tTA;Ai93;Rosa26-LSL-Cas9 mice. Experiments were replicated independently in at least 20 cells for e and in at least 15 cells for h with similar results.
Fig. 5
Fig. 5. ON hyperpolarization in SI-AC is mediated by mGluR8 via G protein βγ subunits and GIRK channels.
a Diagram showing gallein block of G protein βγ (Gβγ) subunits signaling. b Intracellular gallein (10 µM in the pipette solution) abolished light-evoked hyperpolarization. c BaCl2 and tertiapin-Q act intracellularly to block GIRK channels. d BaCl2 (10 µM) or tertiapin-Q (100 nM) in the pipette solution abolished light-evoked membrane hyperpolarization. e Summary of inhibition by gallein, BaCl2, and tertiapin-Q on light-evoked hyperpolarization. N = 5 cells for all. **p = 0.0061 for all, Mann–Whitney test, one-tailed. f I–V curve for the tertiapin-Q sensitive current in (S)−3,4-DCPG (red) obtained by subtracting the curve in (S)−3,4-DCPG + tertiapin-Q (green) from the (S)−3,4-DCPG curve (black) (n = 5 cells). Error Bars: SEM. g Left: light-evoked EPSC measured at −90 mV was completely blocked by GYKI 53655 (25 µM). Right: light-evoked IPSC measured at 0 mV was inhibited by tertiapin-Q. ON responses were evoked with a 100 µm light spot. h Summary of effects of GYKI 53655 in EPSC and tertiapin-Q in IPSC (n = 5 cells). EPSC: ns: p = 0.42, **p = 0.0061, Mann–Whitney Test, one-tailed. IPSC: **p = 0.0061, Mann–Whitney test, one-tailed. i Model of ON inhibition. Left: light triggers glutamate release from ON bipolar cells. Right: glutamate binding to mGluR8 activates GIRK channels via Gβγ subunits, leading to membrane hyperpolarization and subsequent inhibition of voltage-gated calcium channels (VGCCs) and cessation of glycine release in SI-AC. ON responses in b, d, g were evoked with a 60 µm light spot. Coupling between SI-AC and other cells was blocked in F with MFA (25 µM) to improve the voltage clamp. e, h The box plots display the mean, 25th, and 75th percentiles, while the whiskers indicate the 1.5 interquartile range. Source data are provided as a Source Data file. All experiments were performed on VGAT-iCreER;Scg2-tTA;Ai93 mice.
Fig. 6
Fig. 6. Pharmacological interventions suggest an OFF surround mechanism.
a, b Measurement of light-OFF responses as a function of dark spot (0% contrast) diameter presented on a gray background (50% contrast) in control and 25 µM UBP310. Spot in a: 60 µm. Experiments were replicated independently in at least 30 cells with similar results. c Spatial profile of OFF responses (n = 26 cells) in control and UBP310. ∆F/∆Fmax = (FF0µm)/(F900µmF0µm). Data are reported as mean ± SEM. d UBP310 blocked the GCaMP6f signal in the dark and abolished the light response. BC: OFF bipolar cell. AC: amacrine cell. Spot of light (60 µm) applied on a dark background. e Summary of UBP310 effect on the GCaMP6f signal in the dark (n = 6 cells). *p = 0.031, Wilcoxon Signed Rank test, two-tailed. f Whole-cell recording shows that UBP310 shifted the membrane potential and light response to a more hyperpolarized level. g Summary of UBP310-induced hyperpolarization in the dark (n = 5 cells). *p = 0.031, Wilcoxon Signed Rank test, one-tailed. h GCaMP6f fluorescence in the dark was reduced and the light response abolished by the gap junction blocker MFA (25 µM). i Summary of MFA inhibition on the GCaMP6f signal in the dark (n = 7 cells). *p = 0.016, ns: p = 0.11, Wilcoxon signed rank test, two-tailed. j Summary of 25 µM MFA-induced hyperpolarization in the dark (n = 6 cells). *p = 0.016, Wilcoxon Signed Rank test, one-tailed. e, g, i, j The box plots display the mean, 25th, and 75th percentiles, while the whiskers indicate the 1.5 interquartile range. Source data are provided as a Source Data file. All experiments were performed on VGAT-iCreER;Scg2-tTA;Ai93 mice.
Fig. 7
Fig. 7. SI-AC is tracer coupled to a wide-field AC.
a Neurobiotin introduced into SI-AC via a patch-pipette spread to a wide-field AC (red). b Grayscale conversion of a. Red box is shown enlarged in c and blue box is enlarged in e. c Enlarged view of SI-AC and wide-field AC in whole mount view. Inset: SI-AC soma labeled with GCaMP6f and neurobiotin. d Side view of SI-AC and wide-field AC with ChAT immunolabeling (blue). e Stratification of wide-field AC neurites. Green box was enlarged and rotated in f and orange box was enlarged and rotated in g. Arrowheads show branching points. f, g Transversal view of the primary dendrite of the wide-field AC, which started at the middle of the IPL, then branched and extended (neurites 1, 3, and 4) to the OFF layer between the outer ChAT band (blue) and the INL. h, i 3D reconstruction of the SI-AC and wide-field AC. SI-AC is pseudo-colored in green, the wide-field AC is in red. Dotted lines in i: ON and OFF ChAT bands. j Number of neurobiotin-labeled wide-field ACs for a single SI-AC. N = 6 SI-ACs. The box plot displays the mean, 25th, and 75th percentiles, while the whiskers indicate the 1.5 interquartile range. Source data are provided as a Source Data file. k Model of the OFF activation. AC1 receives excitation from OFF bipolar cells and conveys it to SI-AC in the ON sublamina via electrical synapses. The activity of AC1 is also modulated by glycinergic (AC2) and GABAergic (AC3) ACs. All experiments were performed on VGAT-iCreER;Scg2-tTA;Ai93 mice. Scale bars: 100 μm (a, b, e), 10 μm (c, d, fi). ad, f, g Experiments were replicated independently in at least 6 cells with similar results.
Fig. 8
Fig. 8. Unusual receptive field of SI-AC allows for crossover inhibition and push-pull activation.
a SI-AC center-surround receptive field organization. SI-AC has a strong inhibitory “ON center” (top panel, middle) with a weak inhibitory “ON surround” (middle panel, middle), and an excitatory “OFF surround” (middle panel, right) without an opposed “OFF center” (top panel, right). Consequently, full-field ON stimulation produces an inhibition composed of both center and surround inhibitions (bottom panel, middle), while full-field OFF stimulation produces an excitation only from the surround (bottom panel, right). b Schematic diagrams of SI-AC mediated OFF to ON crossover inhibition. a OFF bipolar cells are activated by a dark background (OFF, dark gray bar), leading to a tonic inward current (red trace) in the wide-field AC1. The inward current is slightly reduced by a light spot in the center (ON, light blue bar). b AC1 transfers the inward current to SI-AC via an electrical synapse. c A light spot in the dark activates the ON bipolar cell (blue) which produces a large outward current at ON and a small inward current in OFF (blue trace) in the SI-AC via sign-inverting mGluR8 receptors. d The same (blue) or a different (orange) bipolar cell produces a large inward current at ON and a small outward current in OFF in neurons (PN) postsynaptic to the SI-AC. e Currents from AC1 (b) and ON bipolar cells (c) combine in the SI-AC to gate a Ca2+ conductance that leads to a tonic suppression in glycine release and an outward current during OFF and an inward current during ON in the postsynaptic neuron. f The currents from SI-AC (e) and ON bipolar cells (d) combine in the postsynaptic neuron, resulting in an enhanced inward current during ON together with a large outward current during OFF. c Model of SI-AC circuitry. In the dark, OFF bipolar cells depolarized SI-AC via a bistratified AC at electrical synapses. Glycine released by SI-AC inhibits ACs (AIIs, VGlut3-ACs), ON-RGCs, and ON-OFF RGCs. A spot of light hyperpolarizes SI-AC via mGluR8, relieving the inhibition and increasing the excitability of postsynaptic neurons that respond during light.

References

    1. Wassle H, Boycott BB. Functional architecture of the mammalian retina. Physiol. Rev. 1991;71:447–480. - PubMed
    1. Massey, S. In: Progress in retinal research, Vol. 9 (ed Chader G. Osborne N. N.) Ch. p 399–425, (Pergamon Press, 1990).
    1. Masland RH. The fundamental plan of the retina. Nat. Neurosci. 2001;4:877–886. - PubMed
    1. Werblin FS, Dowling JE. Organization of the retina of the mudpuppy, Necturus maculosus. II. Intracellular recording. J. Neurophysiol. 1969;32:339–355. - PubMed
    1. Kaneko A. Physiological and morphological identification of horizontal, bipolar and amacrine cells in goldfish retina. J. Physiol. 1970;207:623–633. - PMC - PubMed

Publication types