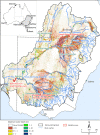
The floodplain inundation history of the Murray-Darling Basin through two-monthly maximum water depth maps
- PMID: 37741870
- PMCID: PMC10517945
- DOI: 10.1038/s41597-023-02559-4
The floodplain inundation history of the Murray-Darling Basin through two-monthly maximum water depth maps
Abstract
With growing concerns over water management in rivers worldwide, researchers are seeking innovative solutions to monitor and understand changing flood patterns. In a noteworthy advancement, stakeholders interested in the changing flood patterns of the Murray Darling Basin (MDB) in Australia, covering an area of 1 million km2, can now access a consistent timeseries of water depth maps for the entire basin. The dataset covers the period from 1988 to 2022 at two-monthly timestep and was developed using remotely sensed imagery and a flood depth estimation model at a spatial resolution of ≈30 m, providing a comprehensive picture of maximum observed inundation depth across the MDB. Validation against 13 hydrodynamic model outputs for different parts of the MDB yielded a mean absolute error of 0.49 m, demonstrating reasonable accuracy and reliability of the dataset. The resulting dataset is best suited to system-wide analysis but might also be useful for those interested in the history of flooding at specific locations in the system. We provide the dataset, visualization tools, and examples to support ongoing research.
© 2023. Springer Nature Limited.
Conflict of interest statement
The authors have no conflicts of interest to declare. All co-authors have seen and agree with the contents of the manuscript and there is no financial interest to report. We certify that the submission is original work and is not under review at any other publication.
Figures


References
-
- Association of State Floodplain Managers. Flood mapping for the nation: A cost analysis for completing and maintaining the Nation’s NFIP flood map Inventory. (Association of State Floodplain Managers Madison, WI:, 2020).
-
- Grimaldi S, Schumann G, Shokri A, Walker JP, Pauwels VRN. Challenges, opportunities, and pitfalls for global coupled hydrologic‐hydraulic modeling of floods. Water Resour Res. 2019;55:5277–5300. doi: 10.1029/2018WR024289. - DOI
-
- Michael Johnson J, Munasinghe D, Eyelade D, Cohen S. An integrated evaluation of the National Water Model (NWM)-Height above nearest drainage (HAND) flood mapping methodology. Natural Hazards and Earth System Sciences. 2019;19:2405–2420. doi: 10.5194/nhess-19-2405-2019. - DOI
-
- Penton, D. J. & Overton, I. C. Spatial modelling of floodplain inundation combining satellite imagery and elevation models. MODSIM07 - Land, Water and Environmental Management: Integrated Systems for Sustainability, Proceedings 1464–1470 (2007).
-
- Johnson JM, Munasinghe D, Eyelade D, Cohen S. An integrated evaluation of the national water model (NWM)–Height above nearest drainage (HAND) flood mapping methodology. Natural Hazards and Earth System Sciences. 2019;19:2405–2420. doi: 10.5194/nhess-19-2405-2019. - DOI
Publication types
LinkOut - more resources
Full Text Sources

