. 2023 Oct;42(44):3274-3286.
doi: 10.1038/s41388-023-02845-w. Epub 2023 Sep 23.

Pooled genetic screens to identify vulnerabilities in TERT-promoter-mutant glioblastoma

Affiliations

Pooled genetic screens to identify vulnerabilities in TERT-promoter-mutant glioblastoma

Kevin J Tu et al. Oncogene. 2023 Oct.

Abstract

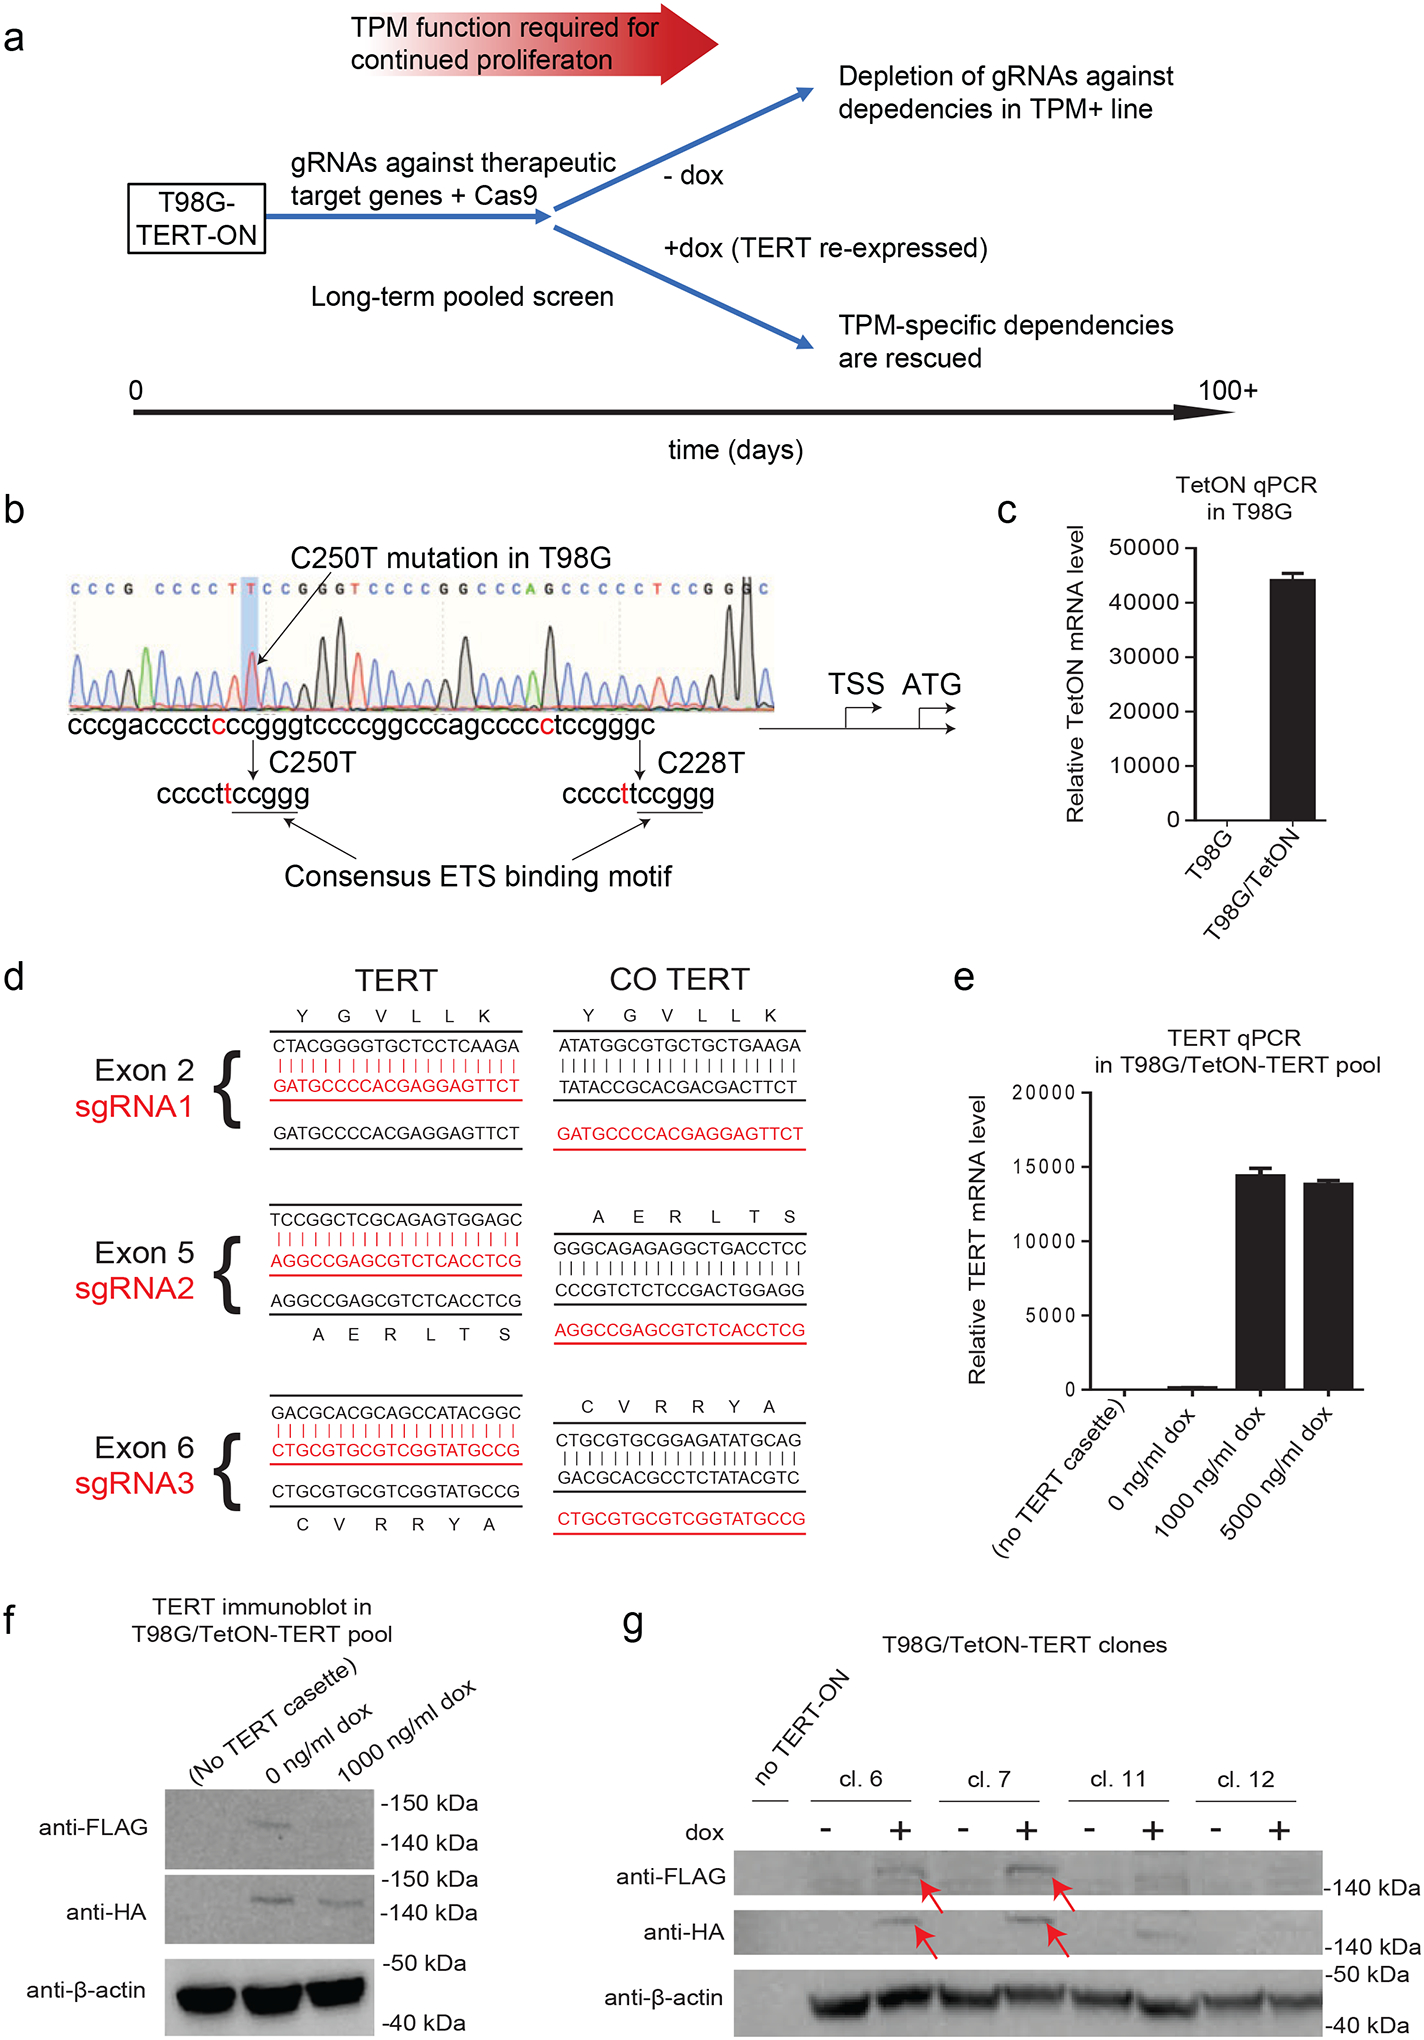
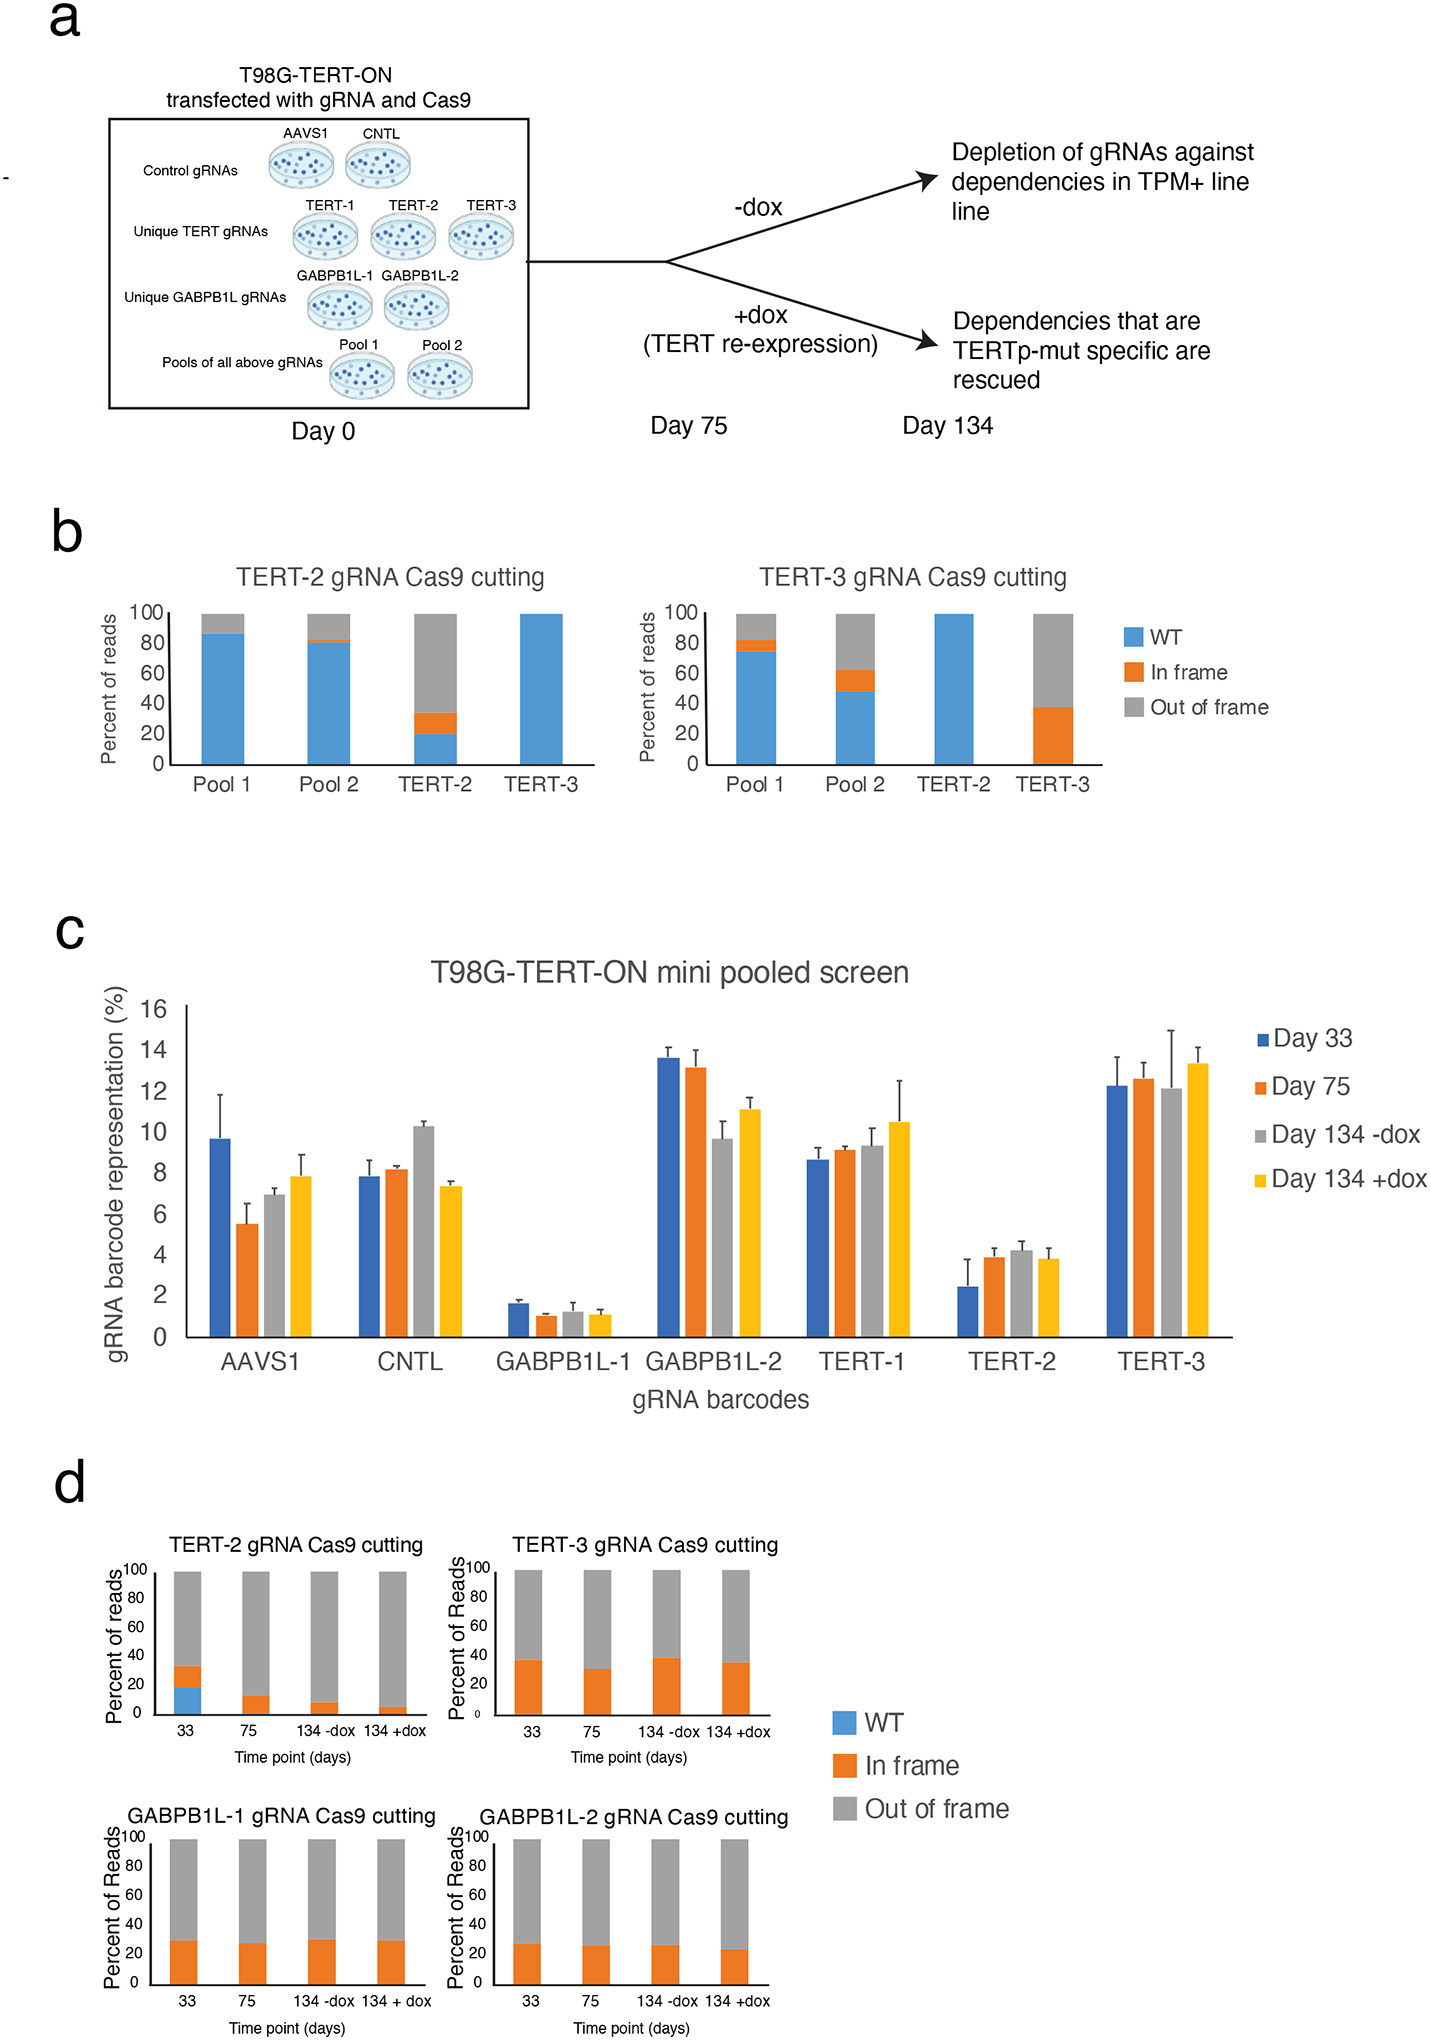
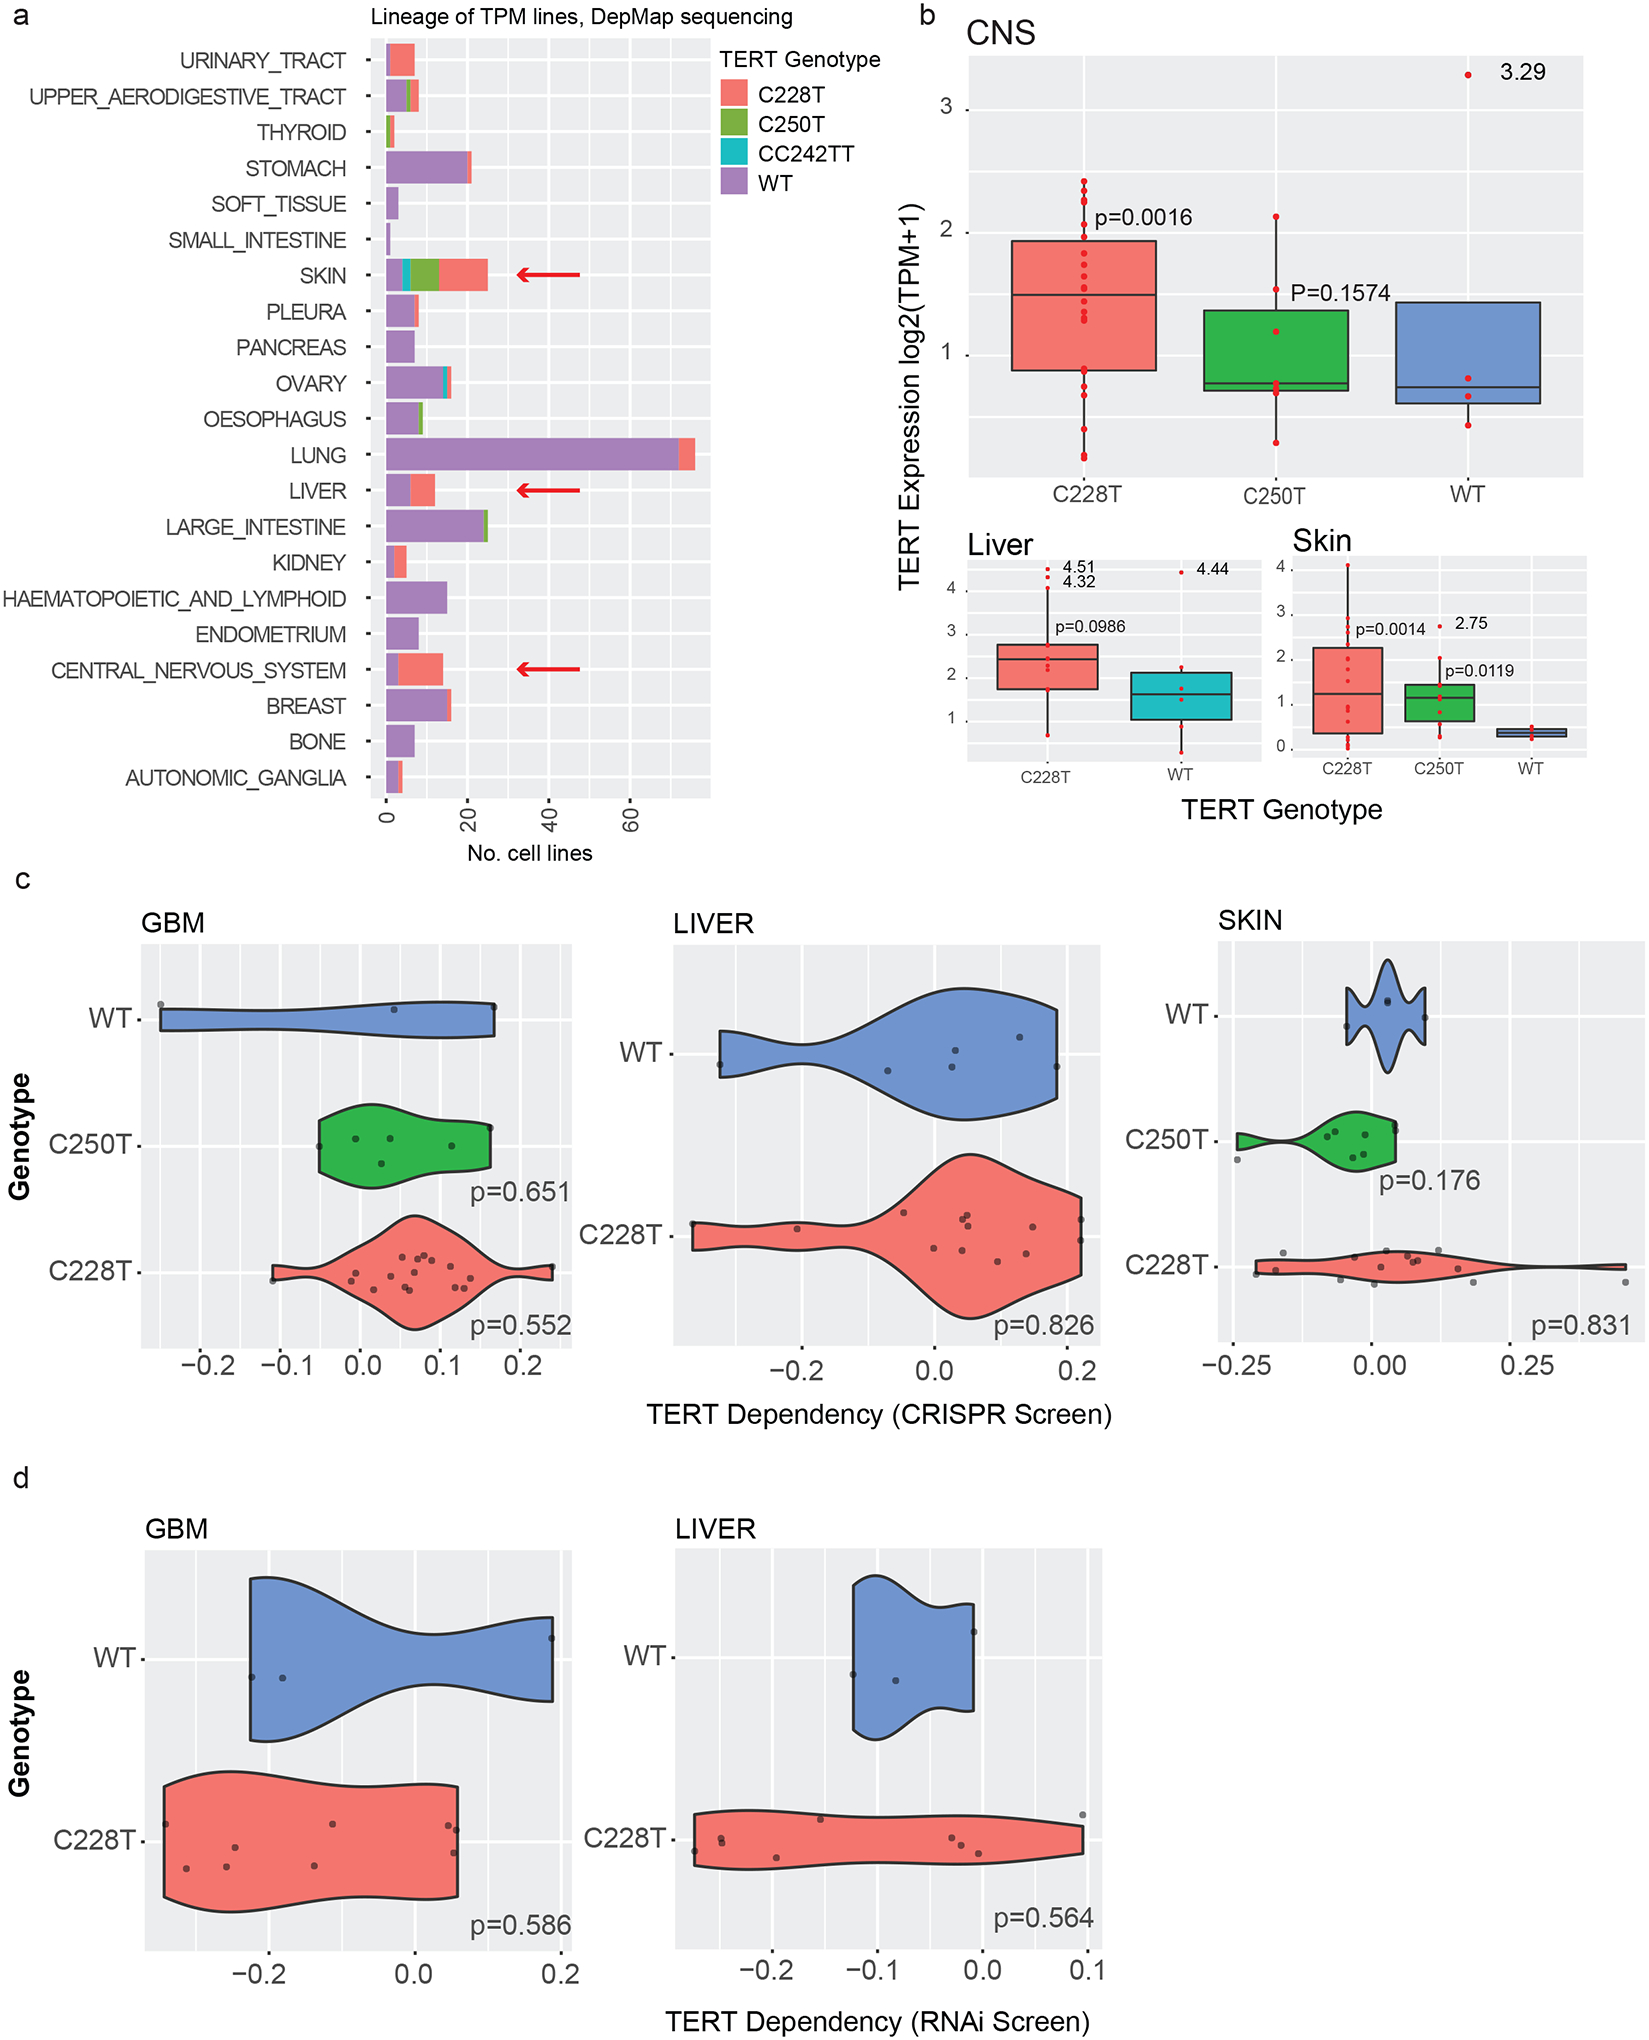
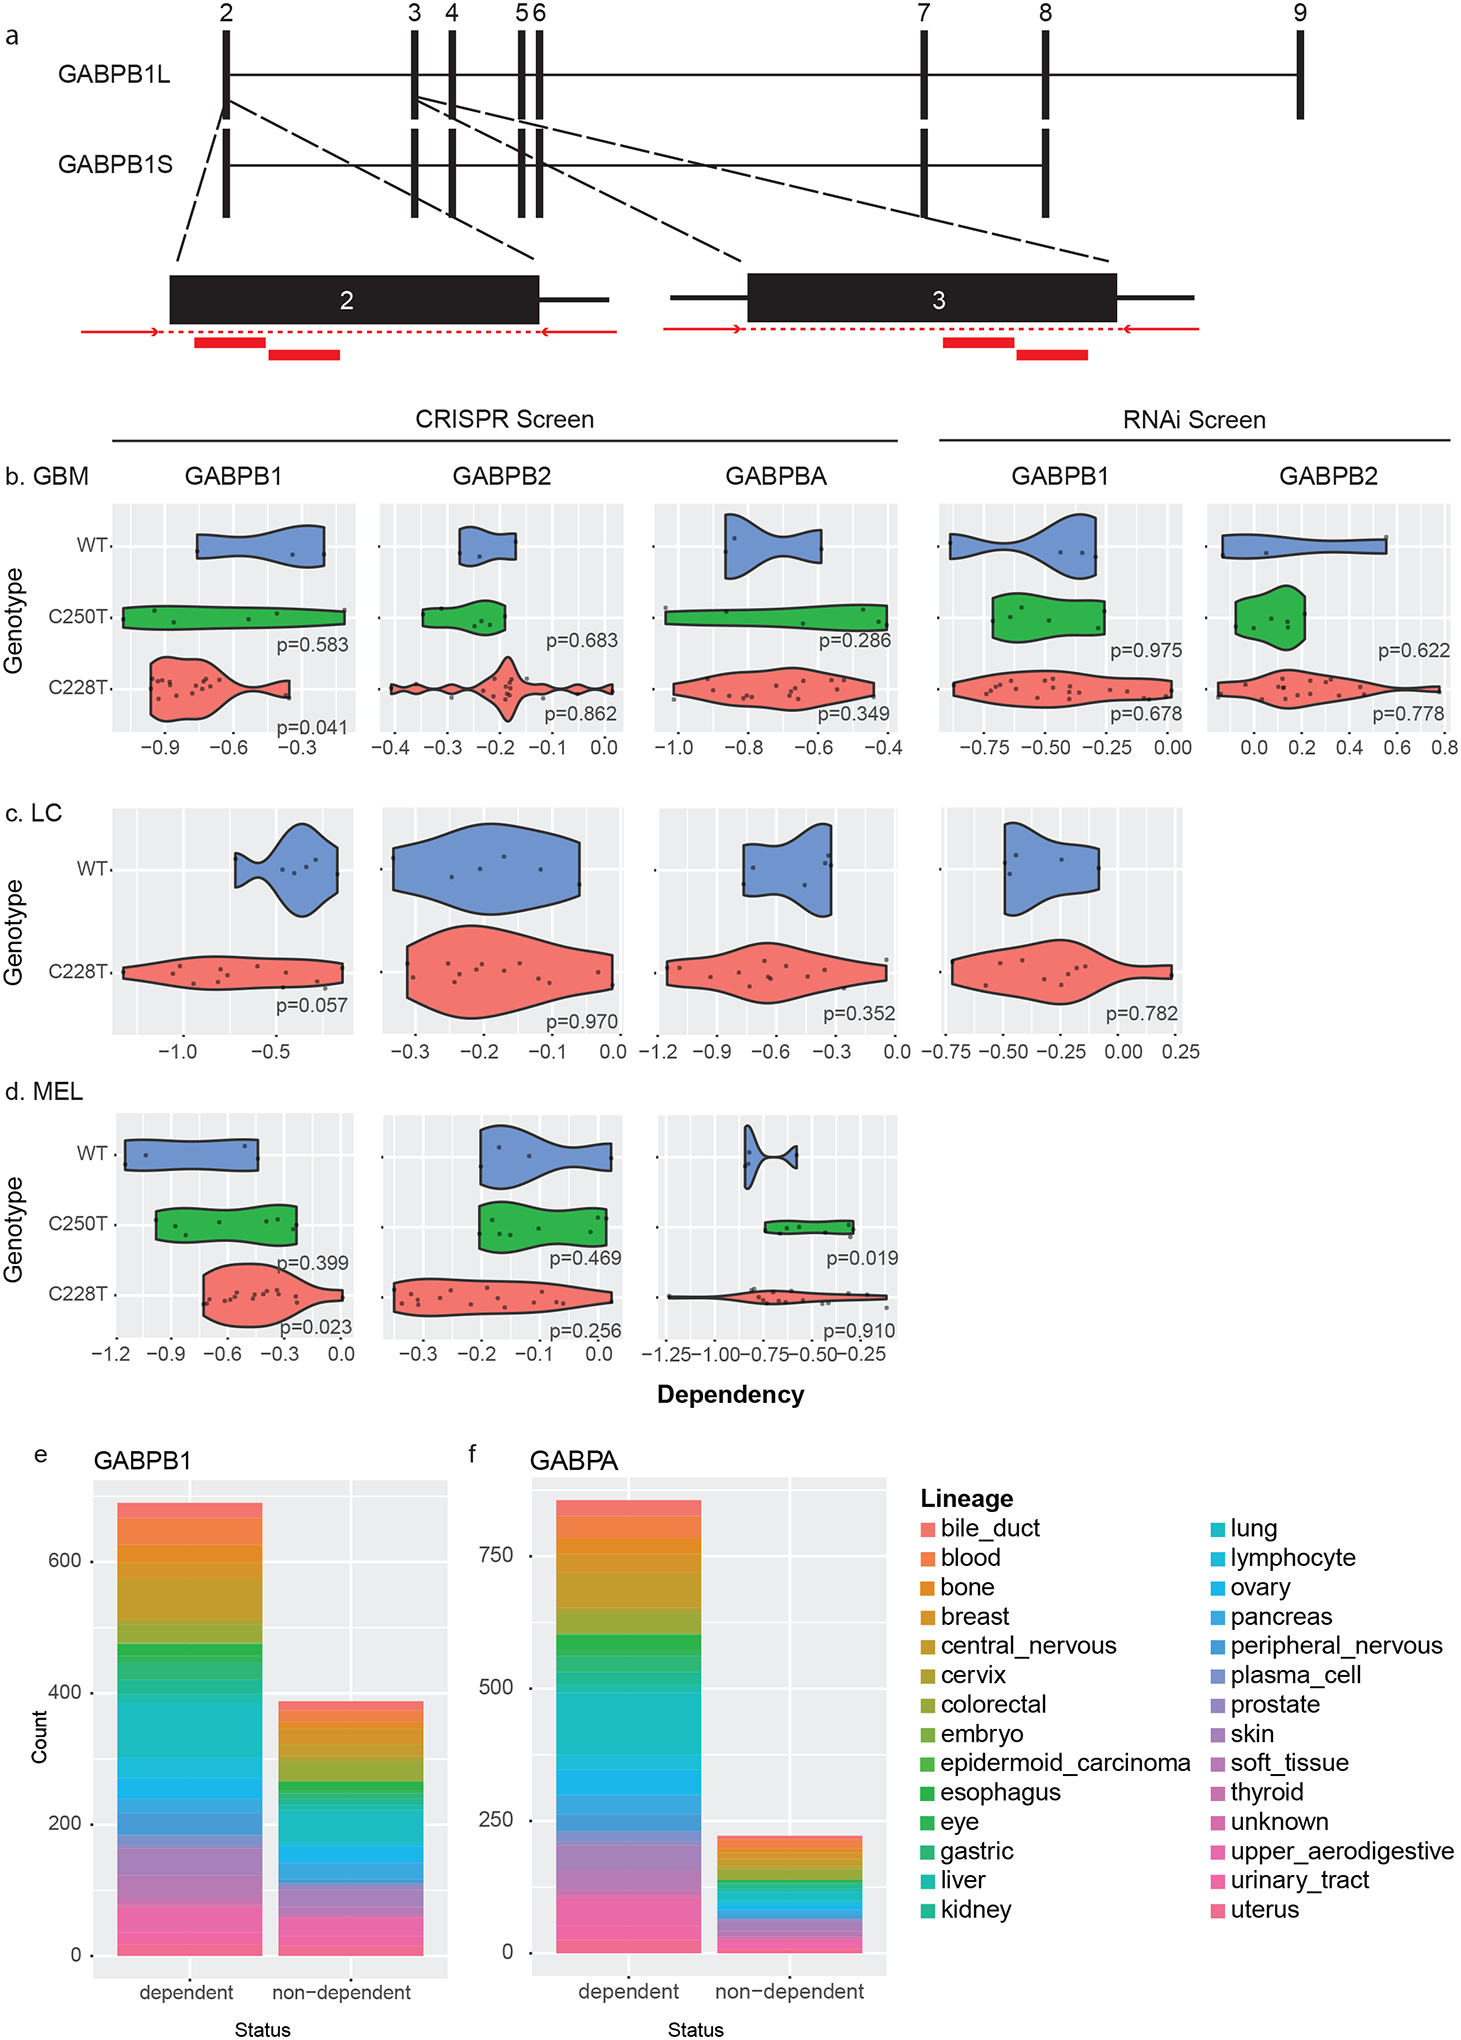
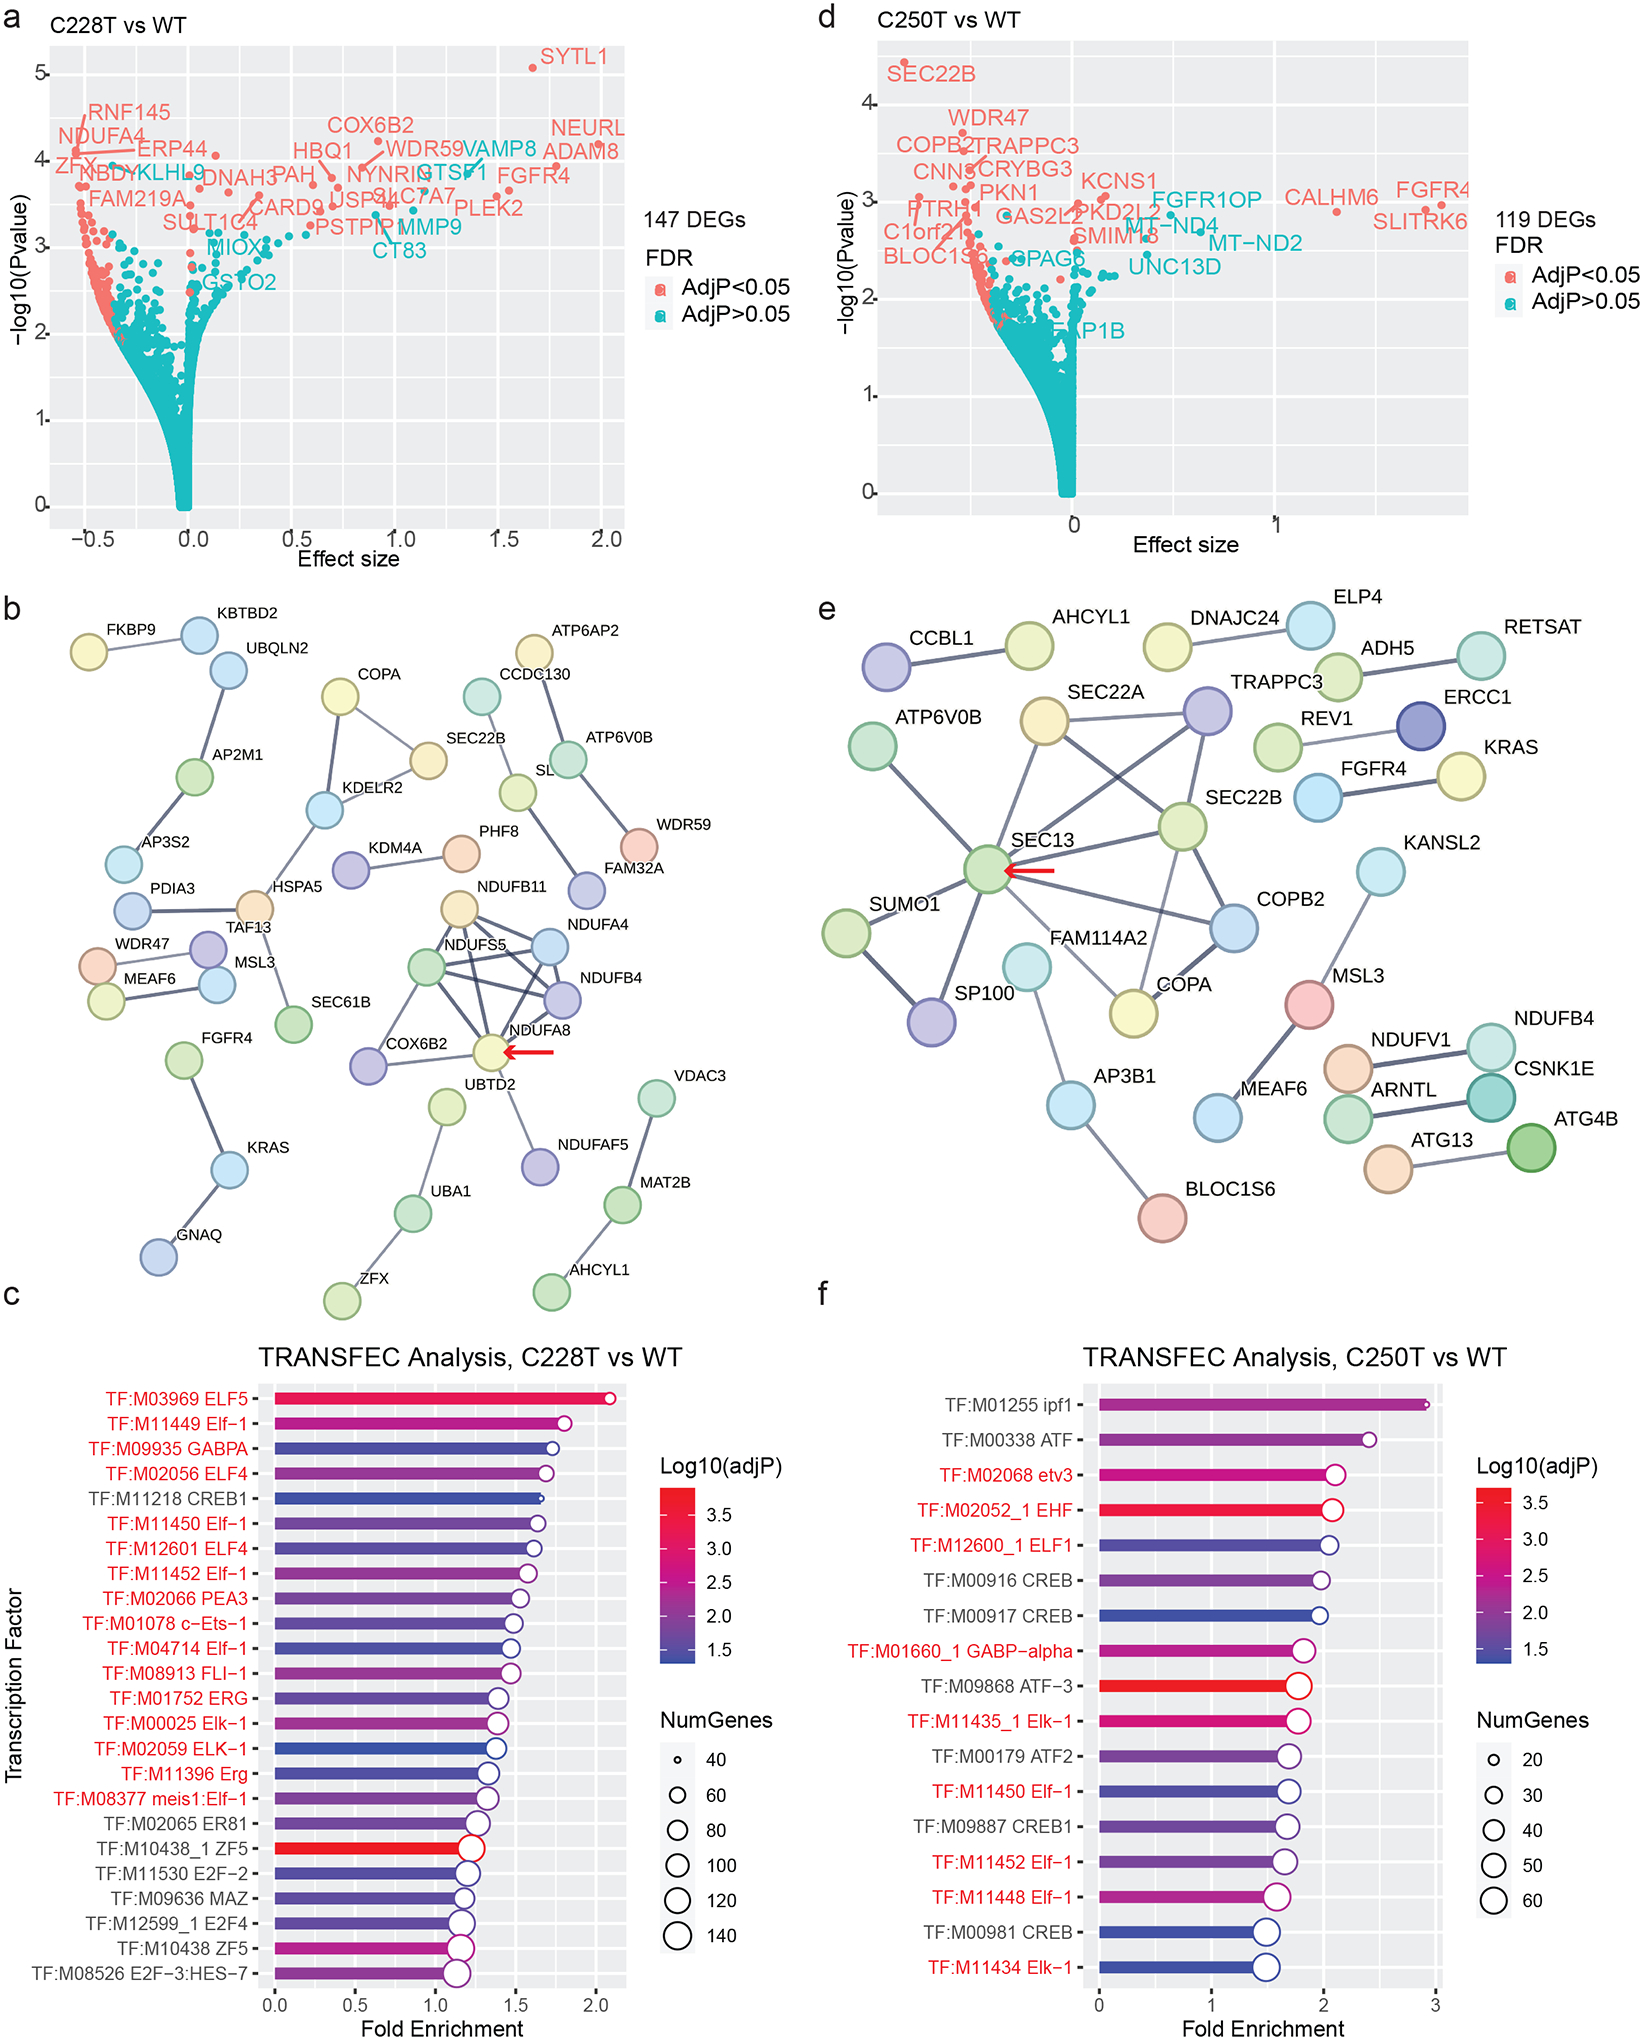
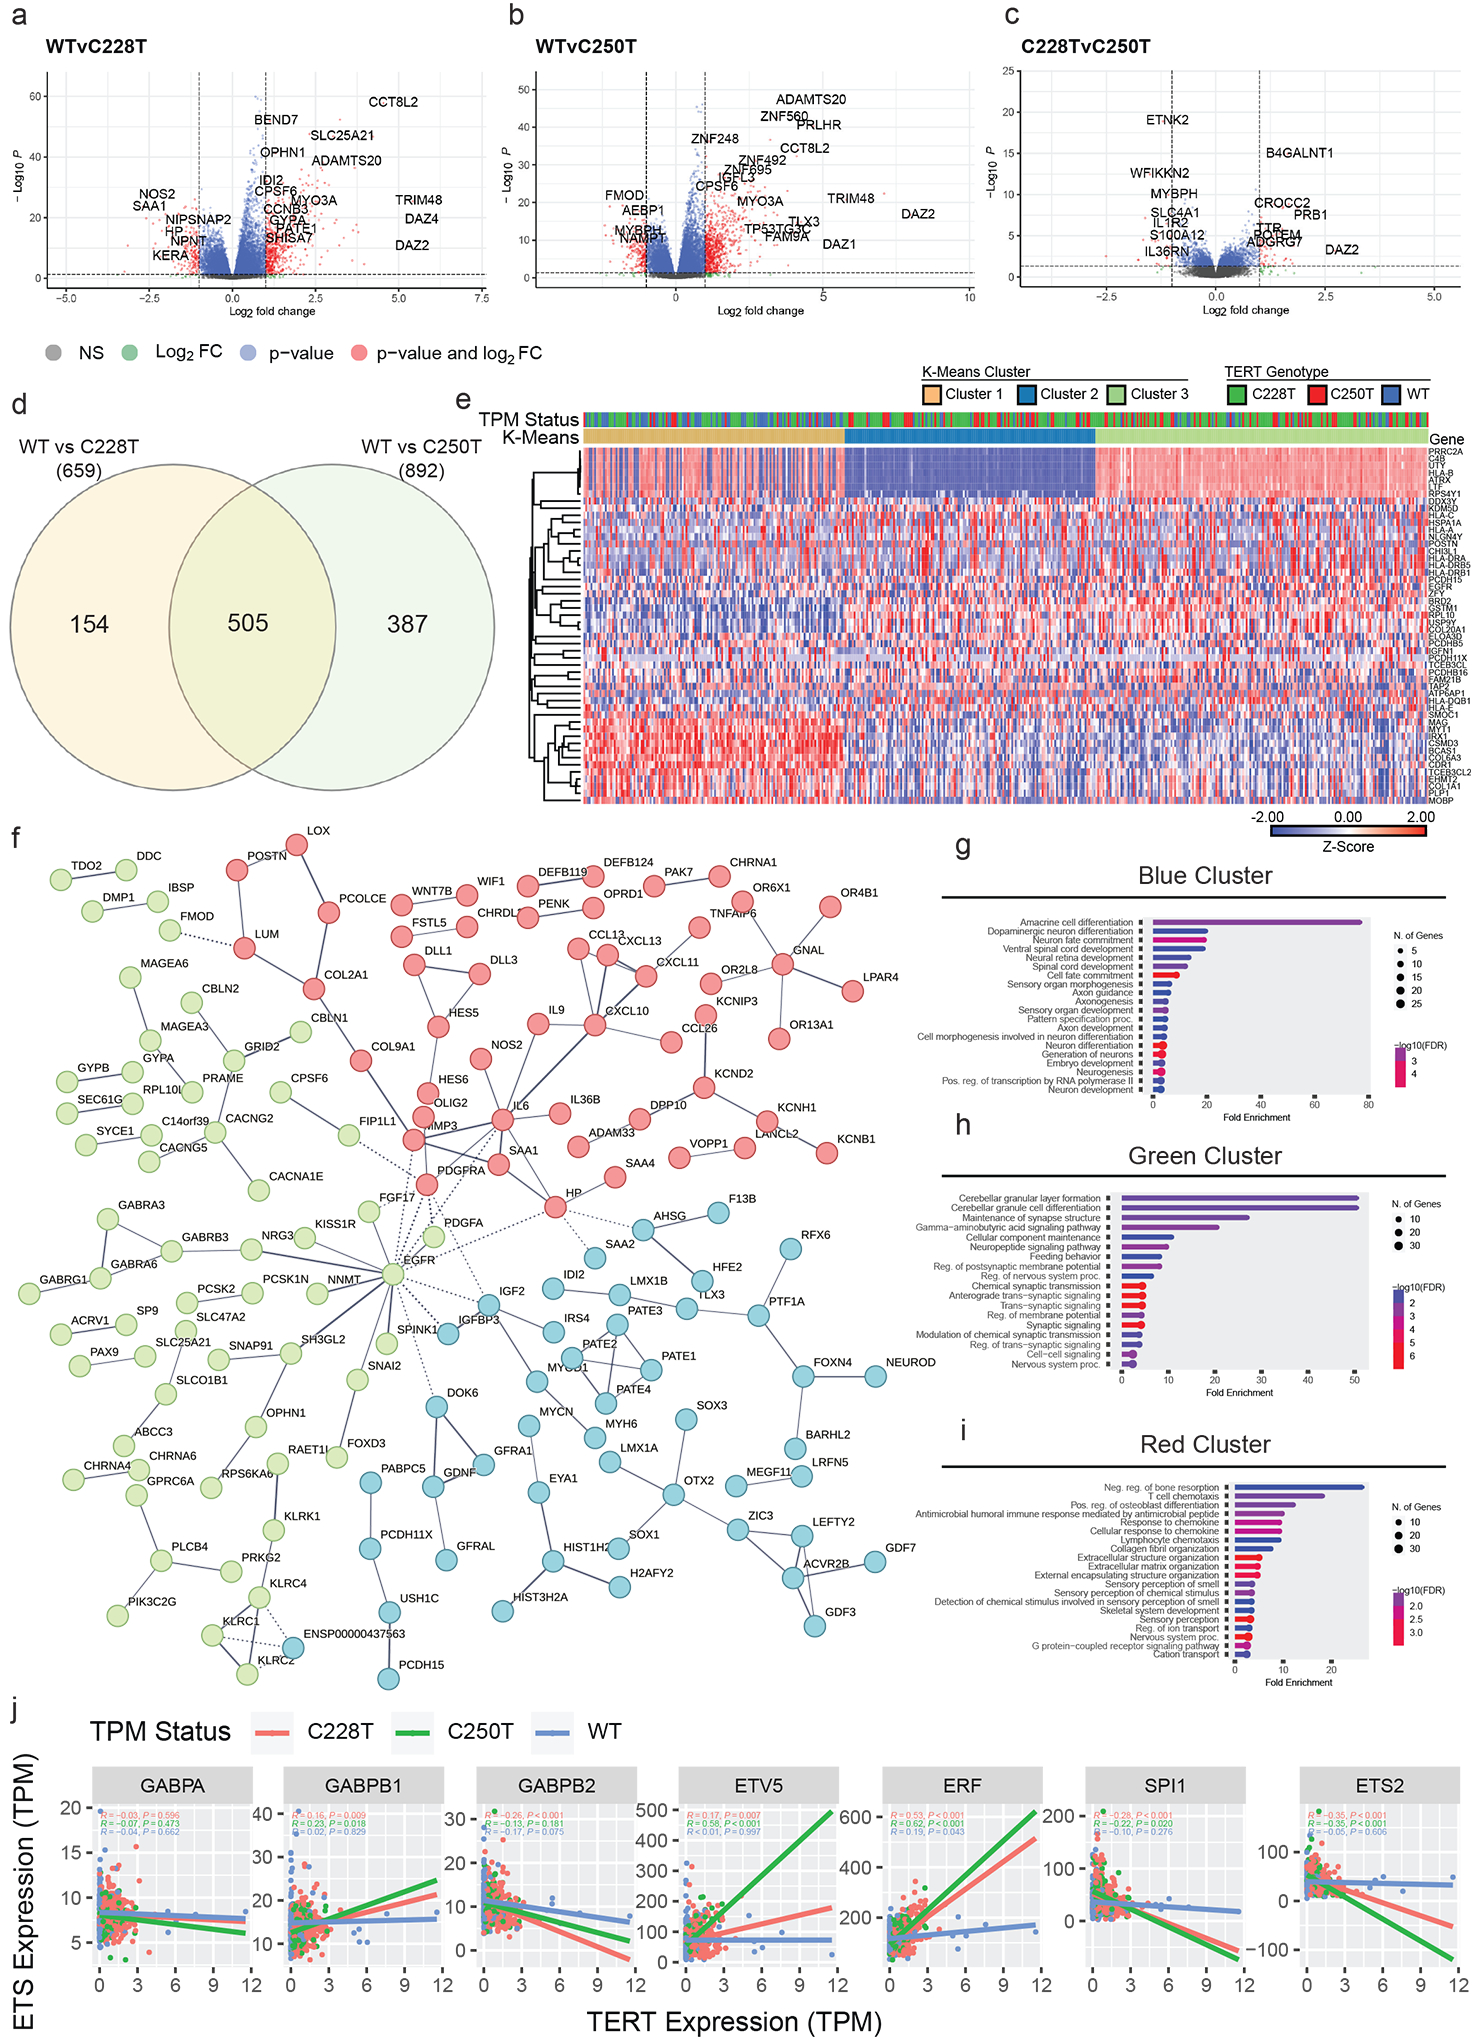
Pooled genetic screens represent a powerful approach to identify vulnerabilities in cancer. Here we used pooled CRISPR/Cas9-based approaches to identify vulnerabilities associated with telomerase reverse transcriptase (TERT) promoter mutations (TPMs) found in >80% of glioblastomas. We first developed a platform to detect perturbations that cause long-term growth defects in a TPM-mutated glioblastoma cell line. However, we could not detect dependencies on either TERT itself or on an E-twenty six transcription (ETS) factor known to activate TPMs. To explore this finding, we cataloged TPM status for 441 cell lines and correlated this with genome-wide screening data. We found that TPM status was not associated with differential dependency on TERT, but that E-twenty six (ETS) transcription factors represent key dependencies in both TPM+ and TPM- lines. Further, we found that TPMs are associated with expression of gene programs regulated by a wide array of ETS-factors in both cell lines and primary glioblastoma tissues. This work contributes a unique TPM cell line reagent, establishes TPM status for many deeply-profiled cell lines, and catalogs TPM-associated vulnerabilities. The results highlight challenges in executing genetic screens to detect TPM-specific vulnerabilities, and suggest redundancy in the genetic network that regulates TPM function with therapeutic implications.


Conflict of interest statement

Conflict of interest statement: ZJR is listed as an inventor for intellectual property related to genetic testing for TERT and other alterations in brain tumors that is managed by Duke Office of Licensing and Ventures and has been licensed to Genetron Health. The other authors have no conflicts of interest to report.

Figures

Figure 1.
Figure 1.. Generation of TPM+ GBM cell line with inducible, exogenous TERT expression.
(A) Schema of genome-wide screen to identify dependencies associated with TPMs. gRNAs and Cas9 are introduced to cells at day 0 using lentivirus vectors which are then continuously passaged in the absence of dox. At a predefined timepoint, cells are divided into two separate pools. One pool is cultured in the absence of dox allowing for gRNAs to be depleted from culture. To distinguish TPM specific from non-specific hits, the other pool is induced with dox to re-express TERT. TERT re-expression will rescue cells containing gRNAs that disrupt the TPMs from replicative senescence, but gRNAs that nonspecifically disrupt cell growth will still be depleted. (B) Sanger sequencing showing C250T mutation in T98G cell line. TSS, transcription start site; ATG, ATG start codon. (C) TET-ON cassette mRNA expression in parental T98G cells and T98G with TetON cassette (T98G/TetON). Data are for mean +/− S.E.M. for n=3 technical qPCR replicates. (D) Sequence alignment between the endogenous TERT sequences and the codon optimized sequence for each sgRNA. Codon optimized TERT was not targeted by sgRNAs. CO = codon optimized. (E) TERT mRNA expression as assessed by qPCR for parental T98G cells (no TERT-ON cassette), and stable T98G/TetON-TERT pool treated with 0–5000 ng/ml dox. Data are for mean +/− S.E.M. for n=3 technical qPCR replicates. (F) Immunoblot for HA and FLAG showing Tag-TERT expression in stable cell pool. Lane 1 is the parental T98G cell line. Lanes 2–3 are T98G/TetON-TERT cells with and without 1000 ng/ml dox added. (G) Immunoblot for HA and FLAG showing Tag-TERT expression in subclones, either with (+) or without (−) addition of 1000 ng/ml dox.
Figure 2.
Figure 2.. Mini pooled screen to identify genetic dependencies that can be rescued by exogenous TERT expression.
(A) Schematic for individual gRNA experiments and mini pooled screens. T98G-TERT-ON cells were transfected with either individual gRNAs or a pool of all gRNAs as shown. Antibiotic selection was added and cells were continuously cultured. At day 75, cells were divided into two parallel cultures to which dox or mock treatment was added. Cells were collected at multiple time points during the experiment for NGS analysis, including day 134. (B) Percent Cas9 cutting induced by TERT-2 and TERT-3 gRNAs at 33 days post-transduction as assessed by targeted NGS of the gRNA target sites in Pool 1 and Pool 2, and in the cells transduced with the TERT-2 and TERT-3 gRNAs. (C) Relative abundance of gRNA barcodes in pooled mini screen experiments. Percent representation determined by NGS sequencing of LentiCRISPRv2 barcodes, ~50,000 reads per sample. Data are for mean + S.E.M. for n=2 independent pooled screens. (D) Percent Cas9 cutting induced by TERT-2, TERT-3, GABPB1L-1, and GABPB1L-2 gRNAs as assessed by targeted NGS of the target sites in cells transfected with each respective gRNA and Cas9.
Figure 3.
Figure 3.. TERT dependency scores in DepMap lines.
(A) Consensus TPM status for 441 cell lines. CNS, liver, and skin lineages (arrows) all contain at least three TPM+ and at least three TPM− lines, allowing comparative analyses within these lineages. (B) Association between TPM status and TERT mRNA expression in DepMap cell lines in CNS, liver, and skin lineages. Welch’s t-test compared to the TPM-WT group, *p<0.05, **p<0.01, outliers excluded. (C) Dependency scores in CRISPR/Cas9 screens in CNS, liver, and skin DepMap cell lines with and without TPMs. P-values were calculated with a linear hypothesis test, p<0.05 considered significant. (D) Dependency scores in RNAi screens in CNS and liver DepMap cell lines with and without TPMs. Skin lines did not contain sufficient information for analysis in the RNAi dataset. P-values were calculated with a linear hypothesis test, p<0.05 considered significant.
Figure 4.
Figure 4.. GABP subunit dependency scores in DepMap cell lines.
(A) Schematic showing locations of GABB1L gRNAs on B1S and B1L isoforms. Exons 2–9 are shown, with exon 1 located far upstream of exon 2. (B) CRISPR-based dependency scores for GABPB1, GABPB2, and GABPA and RNAi-based dependency scores for GABPB1 and GABPB2 are shown for TPM+ and TPM− GBM cell lines (linear hypothesis test, p<0.05 considered significant). (C) CRISPR-based dependency scores for GABPB1, GABPB2, and GABPA and RNAi-based dependency scores for GABPB1 are shown for TPM+ and TPM- liver cancer cell lines (linear hypothesis test, p<0.05 considered significant). (D) CRISPR-based dependency scores for GABPB1, GABPB2, and GABPA are shown for TPM+ and TPM− skin cancer cell lines (linear hypothesis test, p<0.05 considered significant). (E) Lineage of 742/1086 cell lines for which GABPB1 scored as a dependency based on CRISPR pooled screening experiments, compared to 344/1086 for which GABPB1 did not score as a dependency. (F) Lineage of 930/1086 cell lines for which GABPA scored as a dependency based on CRISPR pooled screening experiments, compared to 156/1086 for which GABPA did not score as a dependency.
Figure 5.
Figure 5.. Expression patterns associated with TPM status in GBM cell lines
(A) Volcano plot showing DEGs between TPM-C228T vs. TPM-WT GBM cell lines. Top DEGs are labeled. (B) Protein interaction network of DEGs identified from TPM C228T GBM cell lines. Red arrow denotes the gene with the highest number of interaction edges. (C) TRANSFAC analysis of DEGs in TPM C228T GBM cell lines. Transcription factors whose regulated genes are significantly enriched among the DEGs are shown. ETS-factors are highlighted in red text. (D) Volcano plot showing DEGs between TPM C250T vs. TPM-WT GBM cell lines. Top DEGs are labeled. (E) Protein interaction network of DEGs in TERTp.C250TGBM cell lines. Red arrow denotes the gene with the highest number of interaction edges. (F) TRANSFAC Analysis of DEGs in TERTp.C250T GBM cell lines. ETS-factors are highlighted in red text.
Figure 6.
Figure 6.. Expression patterns associated with TPM status in 500 primary GBM tumors
(A) Volcano plot showing DEGs between TPM-C228T and TPM-WT GBM primary tissues. (B) Volcano plot showing DEGs between TPM-C250T and TPM-WT GBM primary tissues. (C) Volcano plot showing DEGs between TPM-C228T and TPM-C250T GBM primary tissues. (D) Shared DEGs between C228T and C250T GBM primary tissues. (E) Heat map of the z-scores of expression for the top 50 most variable genes (rows) from GBM primary tissue expression profiles (columns). Rows are grouped by unsupervised hierarchical clustering and the columns are grouped by k-means clustering. TPM genotype and k-means cluster are indicated in the color strip above the heat map. One minus person correlation with averages linkage was used for all clustering. (F) Protein interaction analysis of shared DEGs between C228T and C250T GBM primary tissues. Three clusters (blue, green, red) are developed by k-means clustering. (G) Gene ontology analysis of genes from blue cluster derived from k-means clustering of consensus DEGs based on associated protein interaction networks. (H) Gene ontology analysis of genes from green cluster derived from k-means clustering of consensus DEGs based on associated protein interaction networks. (I) Gene ontology analysis of genes from red cluster derived from k-means clustering of consensus DEGs based on associated protein interaction networks. (J) Selected pairwise correlations between TERT expression and ETS-factor expression. Pearson r statistic, associated p-values, and linear regression lines are shown for correlations between each respective ETS-factor expression and TERT expression. For each pairwise correlation, statistics were calculated among subgroups of TPM-C228T tumors, TPM-C250T tumors, and TPM-WT tumors.

References

    1. Thakkar JP, Dolecek TA, Horbinski C, Ostrom QT, Lightner DD, Barnholtz-Sloan JS, et al. Epidemiologic and Molecular Prognostic Review of Glioblastoma. Cancer Epidemiol Biomarkers Prev. 2014. Oct 1;23(10):1985–96. - PMC - PubMed
    1. Mancini A, Xavier-Magalhães A, Woods WS, Nguyen KT, Amen AM, Hayes JL, et al. Disruption of the β1L Isoform of GABP Reverses Glioblastoma Replicative Immortality in a TERT Promoter Mutation-Dependent Manner. Cancer Cell. 2018. Sep;34(3):513–528.e8. - PMC - PubMed
    1. Reitman ZJ, Pirozzi CJ, Yan H. Promoting a new brain tumor mutation: TERT promoter mutations in CNS tumors. Acta Neuropathol (Berl). 2013. Dec;126(6):789–92. - PMC - PubMed
    1. Körber V, Yang J, Barah P, Wu Y, Stichel D, Gu Z, et al. Evolutionary Trajectories of IDHWT Glioblastomas Reveal a Common Path of Early Tumorigenesis Instigated Years ahead of Initial Diagnosis. Cancer Cell. 2019. Apr;35(4):692–704.e12. - PubMed
    1. Lee JH, Lee JE, Kahng JY, Kim SH, Park JS, Yoon SJ, et al. Human glioblastoma arises from subventricular zone cells with low-level driver mutations. Nature. 2018. Aug;560(7717):243–7. - PubMed