Review
. 2023 Sep 23;42(1):247.
doi: 10.1186/s13046-023-02802-1.

Phosphoflow cytometry to assess cytokine signaling pathways in peripheral immune cells: potential for inferring immune cell function and treatment response in patients with solid tumors

Affiliations
Review

Phosphoflow cytometry to assess cytokine signaling pathways in peripheral immune cells: potential for inferring immune cell function and treatment response in patients with solid tumors

Nicole J Toney et al. J Exp Clin Cancer Res. .

Abstract

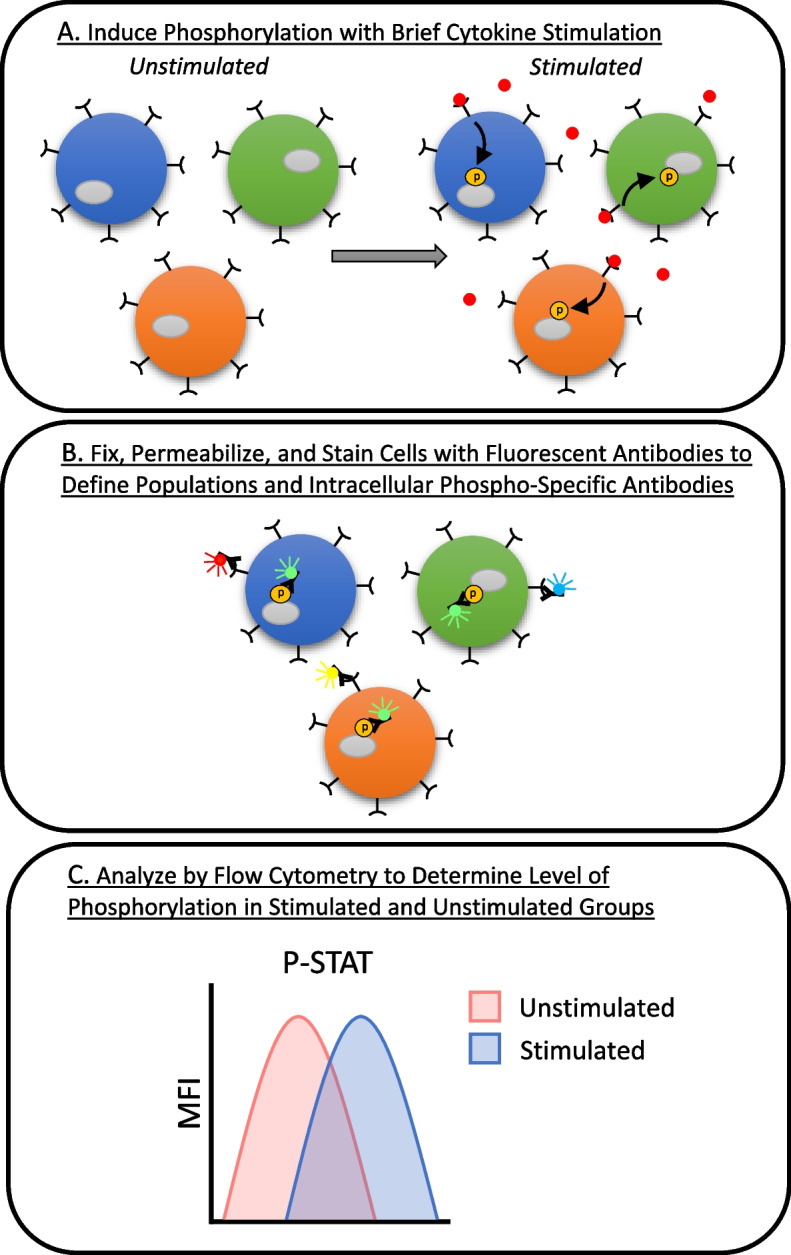
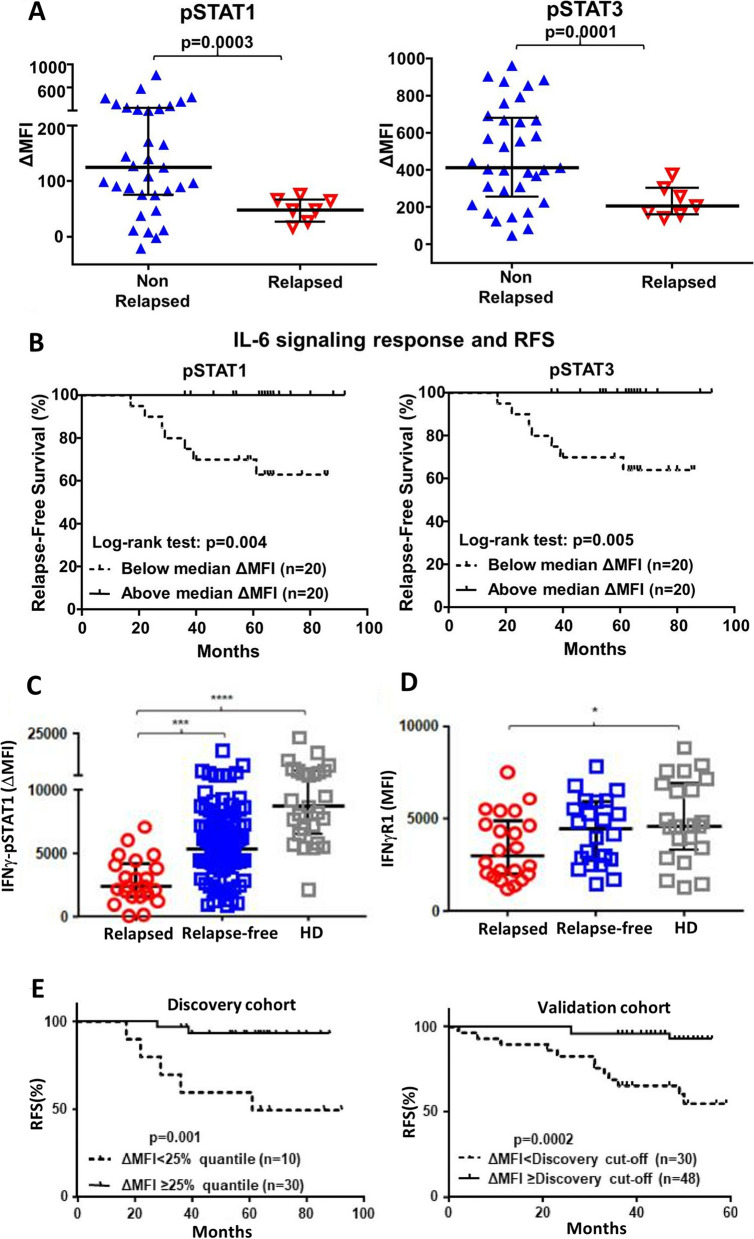
Tumor biopsy is often not available or difficult to obtain in patients with solid tumors. Investigation of the peripheral immune system allows for in-depth and dynamic profiling of patient immune response prior to and over the course of treatment and disease. Phosphoflow cytometry is a flow cytometry‒based method to detect levels of phosphorylated proteins in single cells. This method can be applied to peripheral immune cells to determine responsiveness of signaling pathways in specific immune subsets to cytokine stimulation, improving on simply defining numbers of populations of cells based on cell surface markers. Here, we review studies using phosphoflow cytometry to (a) investigate signaling pathways in cancer patients' peripheral immune cells compared with healthy donors, (b) compare immune cell function in peripheral immune cells with the tumor microenvironment, (c) determine the effects of agents on the immune system, and (d) predict cancer patient response to treatment and outcome. In addition, we explore the use and potential of phosphoflow cytometry in preclinical cancer models. We believe this review is the first to provide a comprehensive summary of how phosphoflow cytometry can be applied in the field of cancer immunology, and demonstrates that this approach holds promise in exploring the mechanisms of response or resistance to immunotherapy both prior to and during the course of treatment. Additionally, it can help identify potential therapeutic avenues that can restore normal immune cell function and improve cancer patient outcome.

Keywords: Clinical response; PBMC; Phosphoflow cytometry; Signaling; Solid tumors.


Conflict of interest statement

The authors declare that they have no competing interests.

Figures

Fig. 1
Fig. 1
Phosphoflow cytometry method. A heterogeneous population of cells is briefly stimulated with cytokines, which bind to receptors and phosphorylate intracellular signaling proteins A. Cells are then fixed to preserve their phosphorylation status and stained with fluorescently labeled extracellular antibodies to define cell populations. Next, cells are permeabilized to allow access to intracellular proteins and stained with fluorescently labeled intracellular antibodies that specifically recognize phosphorylated forms of proteins of interest B. Labeled cells are then detected by flow cytometric analysis to determine phosphorylation levels in specific immune cell subsets of cytokine-stimulated and unstimulated groups C. MFI, mean fluorescent intensity. P-STAT, phosphorylated signal transducer and activator of transcription
Fig. 2
Fig. 2
IL-6 signaling responsiveness in breast cancer patients’ CD4+ naïve T cells compared to healthy donors measured by phosphoflow cytometry. Median fluorescent intensity (MFI) of p-STAT1 and p-STAT3 between CD4+ naïve T cells stimulated with IL-6 minus unstimulated in healthy donors and breast cancer patients A. Flow-cytometry expression of IL-6Rα and GP130 on CD4+ naïve T cells in healthy donors and breast cancer patients, and the correlation with IL-6 signaling responsiveness of p-STAT1 and p-STAT3 B. Modified from Wang et al., Cancer Res. 2017 [19]. Copyright© 2017. American Association for Cancer Research
Fig. 3
Fig. 3
Association of signaling responsiveness in regulatory T cell (Treg) II cells with intratumoral Tregs and suppressive function. Peripheral Treg populations were defined based on differential expression of CD45RA and FoxP3 and compared to intratumoral Tregs A. Peripheral Treg populations were compared to intratumoral Tregs for expression of CD25 and other markers (not shown) B. T cell receptor sequencing was performed and the proportion of overlapping clones among the top 50 clones was compared between peripheral Treg populations and matched intratumoral Tregs C. A cytokine signaling index (CSI) was calculated from the z-score of the difference in median fluorescent intensities of cytokine-stimulated minus unstimulated groups D. Suppression of responder T cells (CD4+CD45RA+CD25) by Treg I, II, and III cells was compared, and Treg II cell suppression was correlated with the Treg II CSI E. Modified from Wang et al., Nat Immunol. 2019 [47]. Copyright© 2019, Springer Nature
Fig. 4
Fig. 4
Associations of phosphoflow cytometry signaling with outcome in melanoma patients. In panels A and B, 14 melanoma patients were treated with high-dose IFN-α (HDI) and p-STAT1 signaling responsiveness to IFN-α was analyzed both prior to and after treatment. p-STAT1 induction at baseline and after 4 weeks of treatment was analyzed in total lymphocytes and CD8+ T cells from responding (R) and non-responding (NR) patients A. The relationship between IFN-α-induced p-STAT1 activation and clinical outcome was assessed by Kaplan–Meier analysis by generating a ratio (post/pre) of p-STAT1 fold induction in lymphocytes before and after treatment, and comparing patients above and below the median B. In a separate study, in panels C and D, melanoma patients were analyzed for p-STAT3 expression after surgical resection and adjuvant nivolumab. The geometric mean fluorescent intensity (gMFI) of p-STAT3 from baseline to week 13 in regulatory T cells (Tregs) and CD8+ T cells was compared between patients with no evidence of disease (NED) and relapse C. The correlation between overall survival and percent change in p-STAT3 at week 13 compared to baseline was assessed in Tregs, conventional T cells (Tcon), and CD8+ T cells D. Panels A and B are modified from Simons et al., J. Transl Med. 2011 [52]. Copyright© 2011, Simons et al., Licensee BioMed Central Ltd. Panels C and D are modified from Woods et al., Clin Cancer Res. 2018 [53]. Copyright© 2018, American Association for Cancer Research
Fig. 5
Fig. 5
Associations of phosphoflow cytometry signaling with outcome in breast cancer patients. In panels A-B, IL-6 signaling response was assessed in peripheral blood CD4+ naïve T cells prior to any therapy. The delta median fluorescent intensity (ΔMFI) in p-STAT1 and p-STAT3 response to IL-6 was assessed between non-relapsed and relapsed patients A. The signaling responsiveness (ΔMFI) above and below the median was also compared by Kaplan–Meier analysis to assess relapse-free survival B. In panels C-E, IFN-γ signaling response was assessed in peripheral monocytes from breast cancer patients prior to therapy. IFN-γ p-STAT1 signaling responsiveness in peripheral blood monocytes of breast cancer patients associates with relapse and relapse-free survival. MFI of pSTAT1 in monocytes stimulated with IFN-γ minus unstimulated in relapsed and relapsed-free breast cancer patients compared to healthy donors (HD) C. MFI of IFNγR1 on monocytes in relapsed and relapsed-free breast cancer patients compared to healthy donors D. Kaplan–Meier survival curves of relapse-free survival (RFS) between patients with high (≥ 25% quantile) vs low (< 25% quantile) IFN-γ responsiveness in both a discovery and validation cohort E. Panels A and B are modified from Wang et al., Cancer Res. 2017 [19]. Copyright© 2017. American Association for Cancer Research. Panels C-E are modified from Wang et al., EBioMedicine 2020 [48]. © Wang et al. Published by Elsevier B.V

References

    1. Nixon AB, Schalper KA, Jacobs I, Potluri S, Wang IM, Fleener C. Peripheral immune-based biomarkers in cancer immunotherapy: can we realize their predictive potential? J Immunother Cancer. 2019;7(1):325. - PMC - PubMed
    1. Morris R, Kershaw NJ, Babon JJ. The molecular details of cytokine signaling via the JAK/STAT pathway. Protein Sci. 2018;27(12):1984–2009. - PMC - PubMed
    1. Griffiths JI, Wallet P, Pflieger LT, Stenehjem D, Liu X, Cosgrove PA, et al. Circulating immune cell phenotype dynamics reflect the strength of tumor-immune cell interactions in patients during immunotherapy. Proc Natl Acad Sci U S A. 2020;117(27):16072–16082. - PMC - PubMed
    1. Krutzik PO, Nolan GP. Intracellular phospho-protein staining techniques for flow cytometry: monitoring single cell signaling events. Cytometry A. 2003;55(2):61–70. - PubMed
    1. Goldeck D, Low I, Shadan NB, Mustafah S, Pawelec G, Larbi A. Multi-parametric phospho-flow cytometry: a crucial tool for T lymphocyte signaling studies. Cytometry A. 2013;83(3):265–272. - PubMed