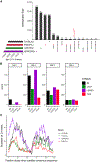
Variation in the CENP-A sequence association landscape across diverse inbred mouse strains
- PMID: 37742188
- PMCID: PMC10873113
- DOI: 10.1016/j.celrep.2023.113178
Variation in the CENP-A sequence association landscape across diverse inbred mouse strains
Abstract
Centromeres are crucial for chromosome segregation, but their underlying sequences evolve rapidly, imposing strong selection for compensatory changes in centromere-associated kinetochore proteins to assure the stability of genome transmission. While this co-evolution is well documented between species, it remains unknown whether population-level centromere diversity leads to functional differences in kinetochore protein association. Mice (Mus musculus) exhibit remarkable variation in centromere size and sequence, but the amino acid sequence of the kinetochore protein CENP-A is conserved. Here, we apply k-mer-based analyses to CENP-A chromatin profiling data from diverse inbred mouse strains to investigate the interplay between centromere variation and kinetochore protein sequence association. We show that centromere sequence diversity is associated with strain-level differences in both CENP-A positioning and sequence preference along the mouse core centromere satellite. Our findings reveal intraspecies sequence-dependent differences in CENP-A/centromere association and open additional perspectives for understanding centromere-mediated variation in genome stability.
Keywords: CENP-A association; CENP-A positioning; CP: Genomics; Mus musculus; centromere evolution; centromere transcription; centromere variation; genome instability; kinetochore; meiotic drive.
Copyright © 2023 The Authors. Published by Elsevier Inc. All rights reserved.
Conflict of interest statement
Declaration of interests The authors declare no competing interests.
Figures


Similar articles
-
Dissection of CENP-C-directed centromere and kinetochore assembly.Mol Biol Cell. 2009 Oct;20(19):4246-55. doi: 10.1091/mbc.e09-05-0378. Epub 2009 Jul 29. Mol Biol Cell. 2009. PMID: 19641019 Free PMC article.
-
Immunolocalization of CENP-A suggests a distinct nucleosome structure at the inner kinetochore plate of active centromeres.Curr Biol. 1997 Nov 1;7(11):901-4. doi: 10.1016/s0960-9822(06)00382-4. Curr Biol. 1997. PMID: 9382805
-
Centromere/kinetochore is assembled through CENP-C oligomerization.Mol Cell. 2023 Jul 6;83(13):2188-2205.e13. doi: 10.1016/j.molcel.2023.05.023. Epub 2023 Jun 8. Mol Cell. 2023. PMID: 37295434
-
Plasticity in centromere organization and kinetochore composition: Lessons from diversity.Curr Opin Cell Biol. 2022 Feb;74:47-54. doi: 10.1016/j.ceb.2021.12.007. Epub 2022 Feb 2. Curr Opin Cell Biol. 2022. PMID: 35108654 Free PMC article. Review.
-
The ins and outs of CENP-A: Chromatin dynamics of the centromere-specific histone.Semin Cell Dev Biol. 2023 Feb 15;135:24-34. doi: 10.1016/j.semcdb.2022.04.003. Epub 2022 Apr 11. Semin Cell Dev Biol. 2023. PMID: 35422390 Review.
Cited by
-
H2B.W2, a spermatocyte-specific histone variant, disrupts nucleosome stability, and reduces chromatin compaction.Nucleic Acids Res. 2025 Aug 27;53(16):gkaf825. doi: 10.1093/nar/gkaf825. Nucleic Acids Res. 2025. PMID: 40874595 Free PMC article.
-
Adaptive evolution of CENP-T modulates centromere binding.Curr Biol. 2025 Mar 10;35(5):1012-1022.e5. doi: 10.1016/j.cub.2025.01.017. Epub 2025 Feb 12. Curr Biol. 2025. PMID: 39947176
-
CENP-A and centromere evolution in equids.Chromosome Res. 2025 Jun 30;33(1):13. doi: 10.1007/s10577-025-09773-3. Chromosome Res. 2025. PMID: 40586953 Free PMC article. Review.
References
Publication types
MeSH terms
Substances
Grants and funding
LinkOut - more resources
Full Text Sources
Molecular Biology Databases
Miscellaneous

